Lana Rhoades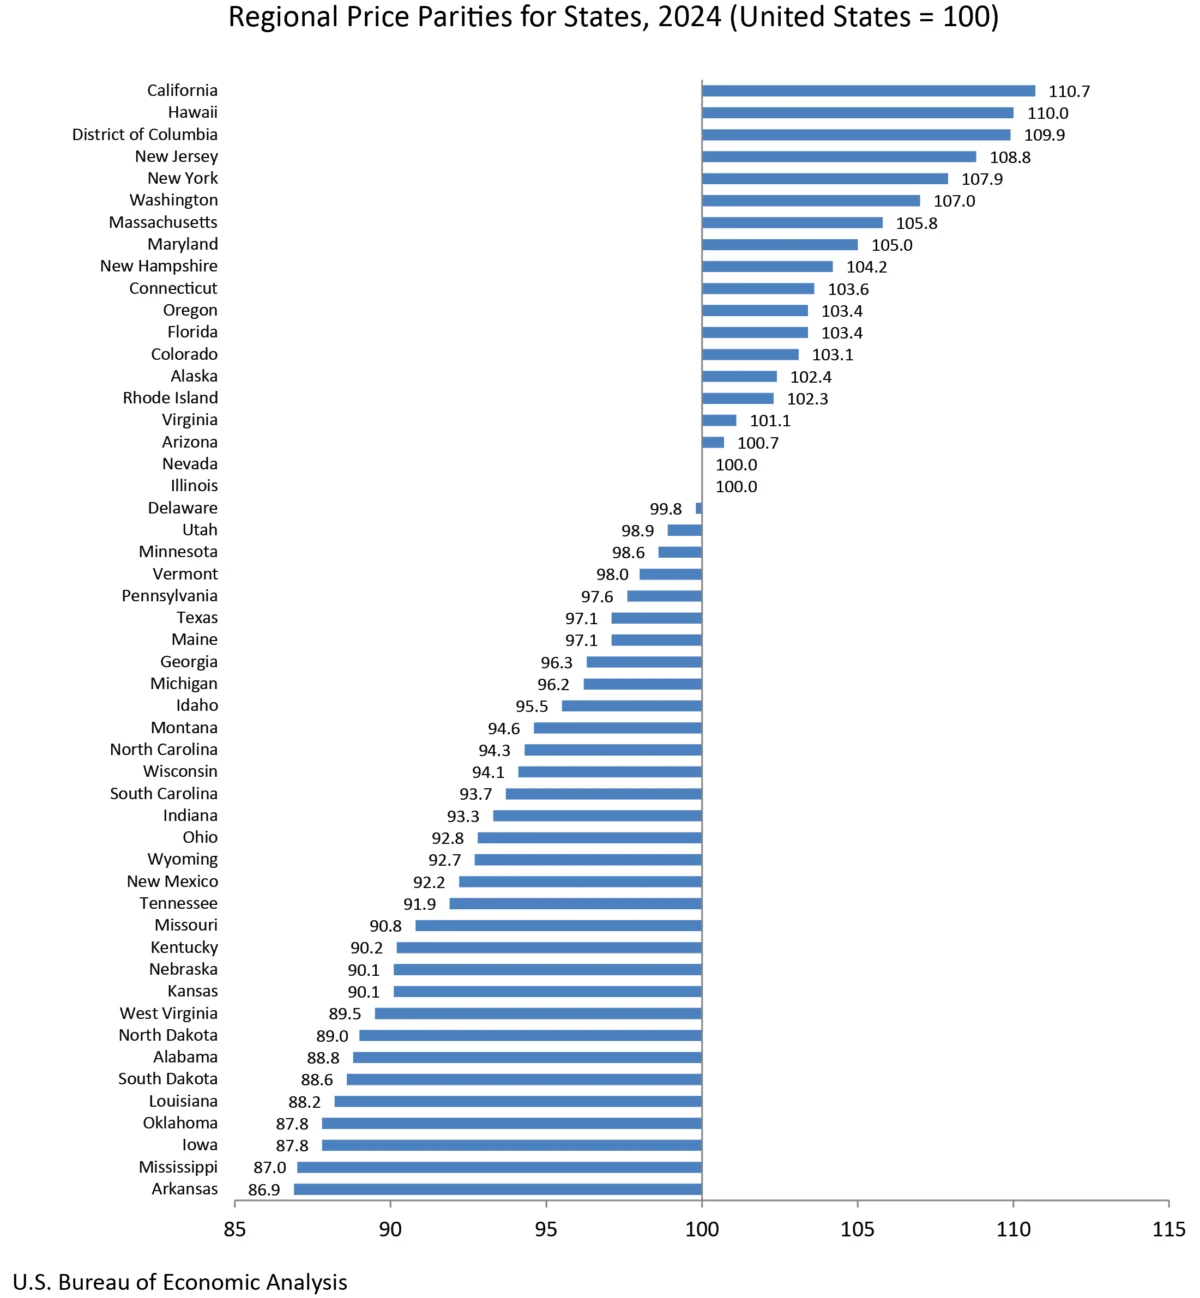
Washington D.C. – The U.S. Bureau of Economic Analysis (BEA) today unveiled its latest annual statistics, offering a detailed look at the economic landscape of all 50 states and the District of Columbia for the year 2024. This comprehensive release includes crucial data on real personal consumption expenditures (PCE), real personal income, and regional price parities (RPPs), providing policymakers, businesses, and the public with an updated understanding of economic activity and cost of living variations across the nation. The data reveal a broad-based increase in consumer spending and personal income, though significant disparities persist among states, underscoring the diverse economic trajectories within the United States.
Real Personal Consumption Expenditures Show Widespread Growth
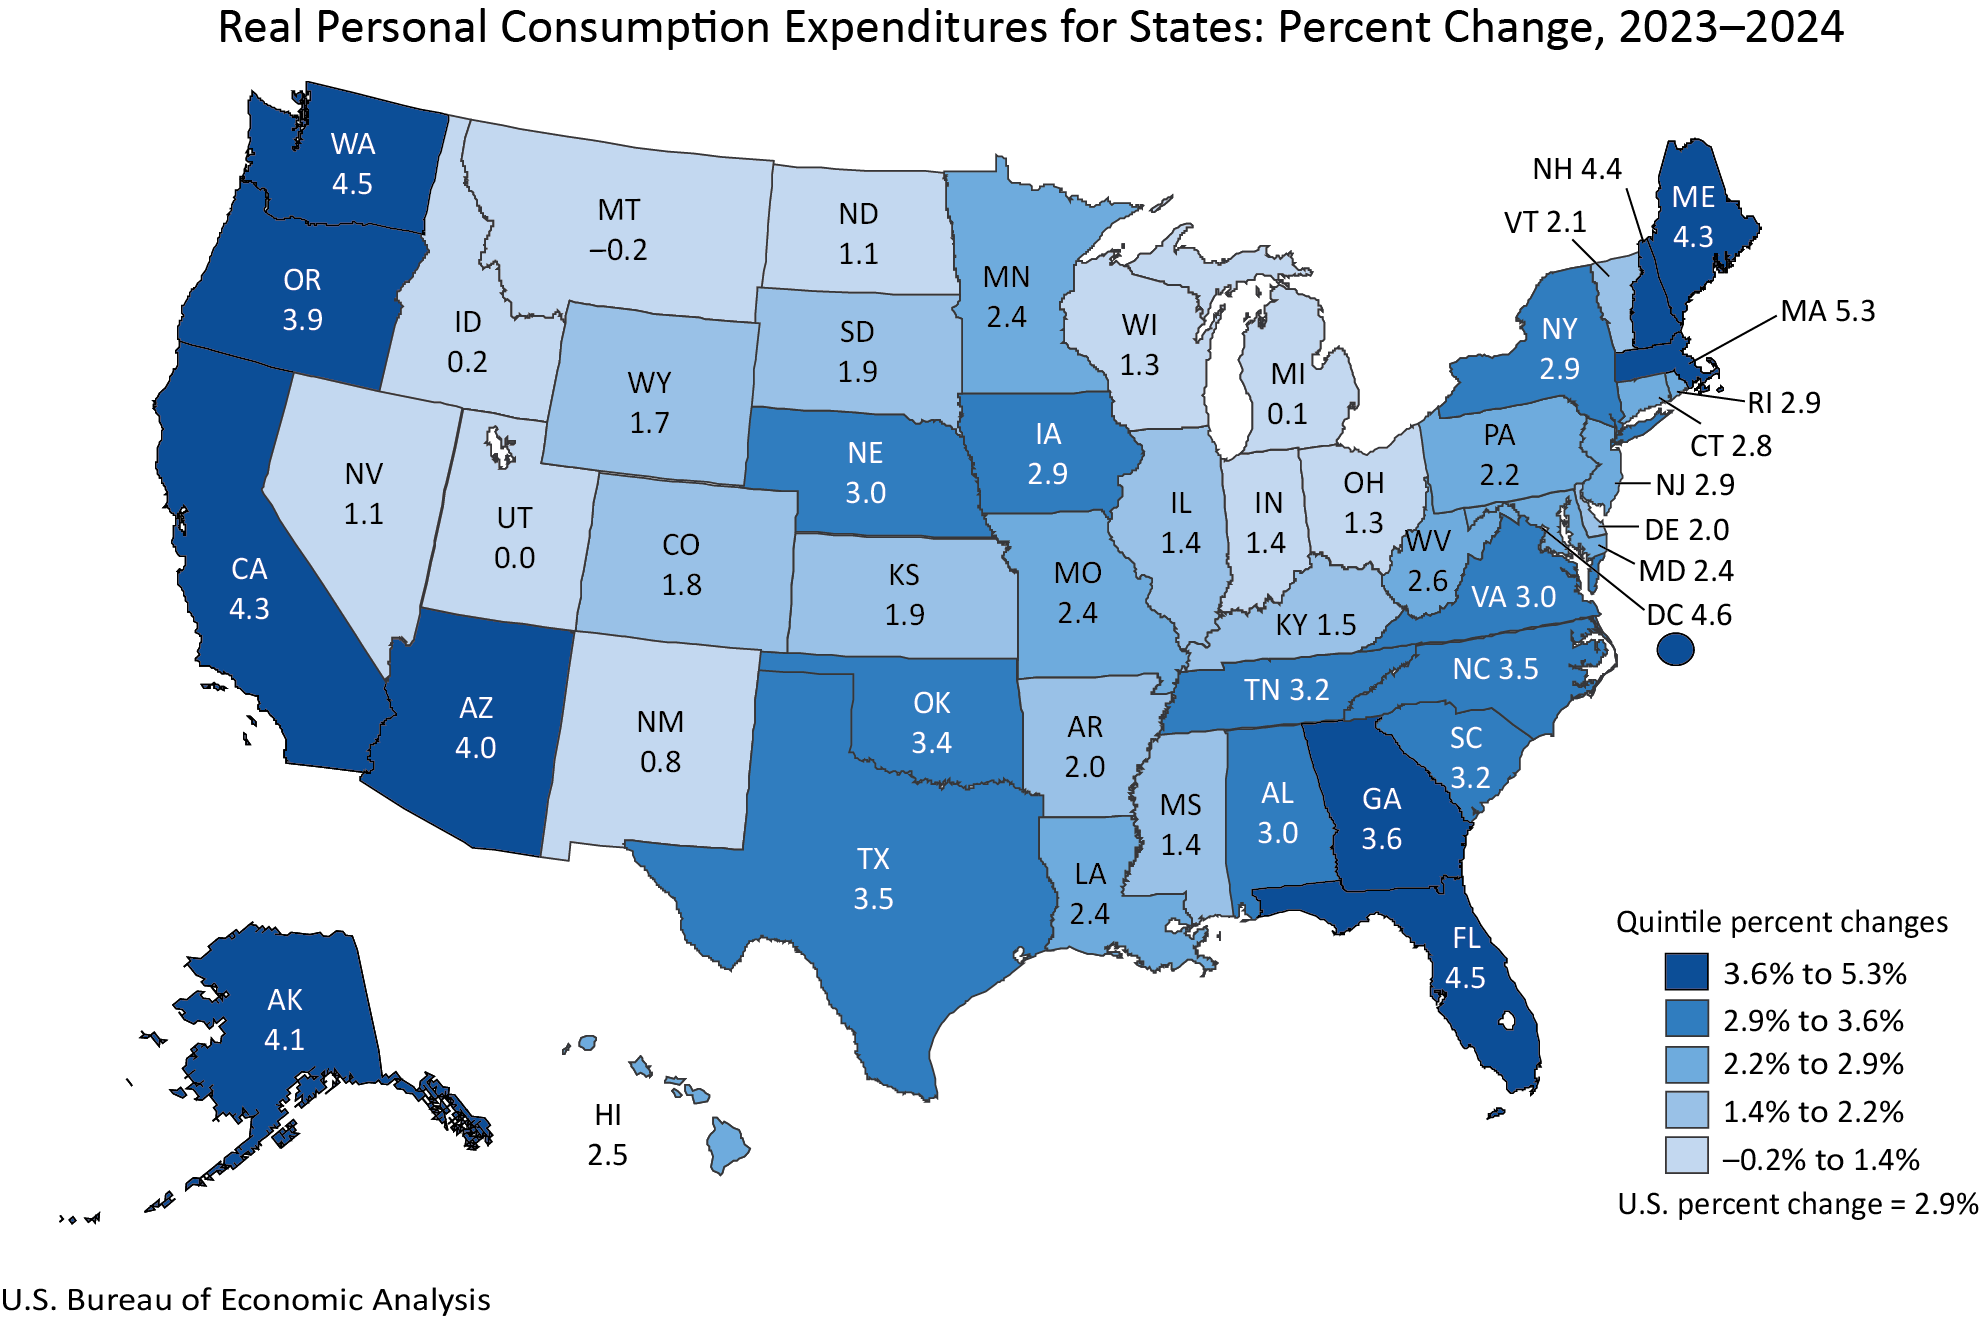
The data indicate a robust expansion in real personal consumption expenditures, a key indicator of consumer demand and economic health, across a significant majority of the nation. In 2024, 48 states and the District of Columbia experienced an increase in real PCE. This widespread growth suggests a generally positive consumer sentiment and spending environment throughout the country.
Massachusetts led the nation with a remarkable 5.3 percent surge in real PCE, signaling a particularly strong year for consumer spending in the Bay State. This significant uptick may be attributed to a confluence of factors, including a thriving technology sector, a robust labor market, and potentially increased disposable income among its residents. Conversely, Montana saw a slight contraction of -0.2 percent in real PCE, marking it as the sole state to experience a decline, albeit a minimal one. This modest decrease in Montana warrants further investigation into localized economic conditions that may have tempered consumer spending.
Nationally, real PCE grew by 2.9 percent in 2024. This figure is a testament to the resilience of the American consumer. To put this in perspective, current-dollar PCE—which reflects nominal spending—increased by a more substantial 5.6 percent. The difference between nominal and real PCE growth is accounted for by the national PCE price index, which rose by 2.6 percent in the same period. This means that while consumers were spending more dollars, a portion of that increase was due to rising prices rather than an expansion in the volume of goods and services purchased. The BEA’s calculation of real PCE for states involves adjusting current-dollar estimates by both the corresponding regional price parity and the national PCE price index, ensuring a more accurate reflection of purchasing power across different locales.
Real Personal Income Sees Broad-Based Gains
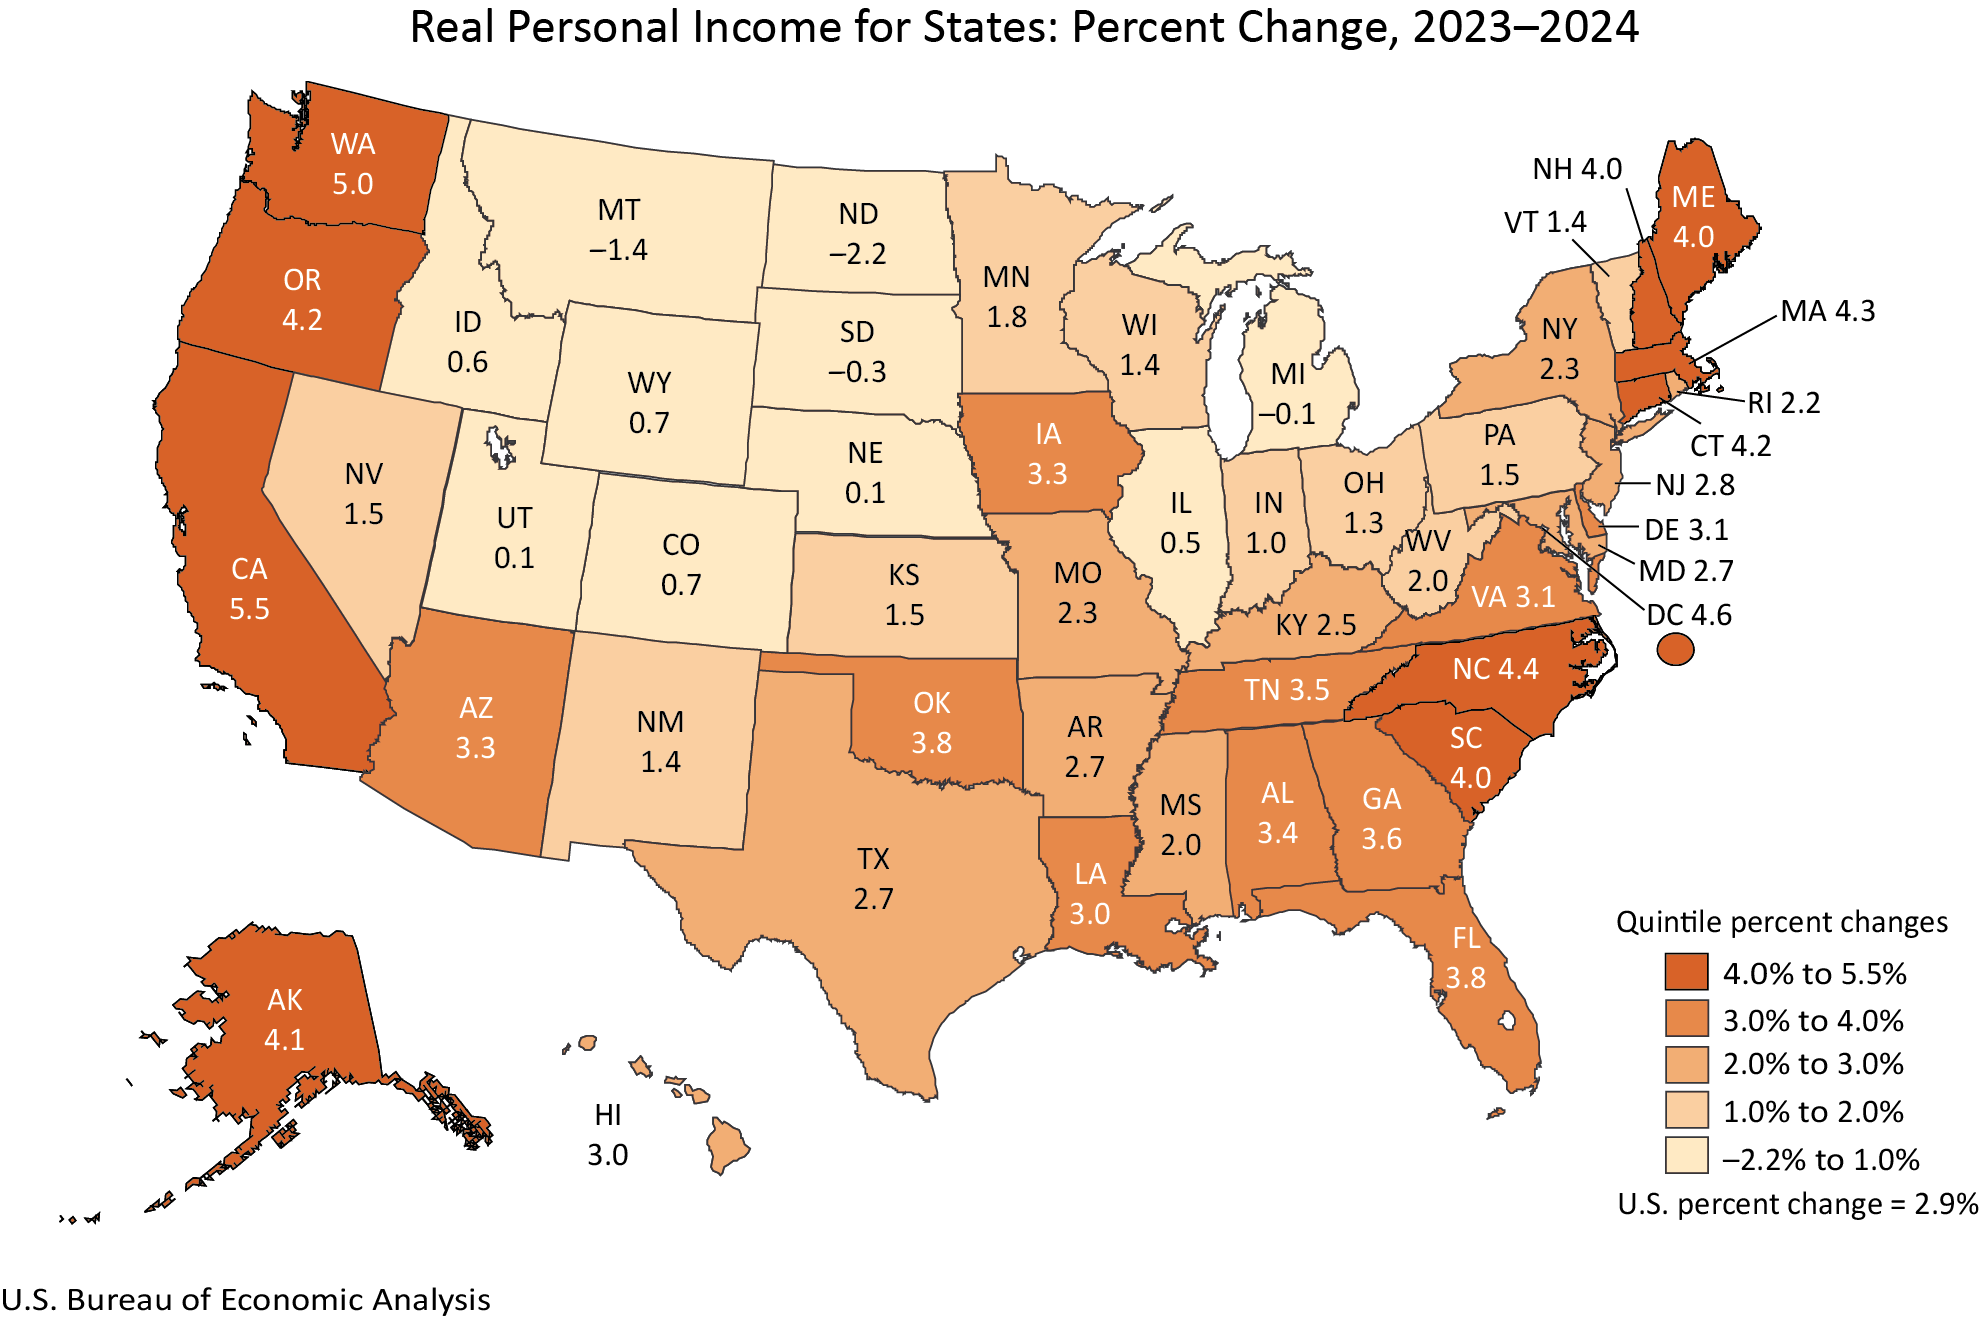
Complementing the rise in consumer spending, real personal income also demonstrated widespread growth across the United States. In 2024, 46 states and the District of Columbia reported an increase in real personal income, indicating that a large portion of the population saw their purchasing power grow after accounting for inflation.
California emerged as a frontrunner in real personal income growth, with an impressive increase of 5.5 percent. This surge in California is likely influenced by its substantial technology and entertainment industries, which often command high wages and generate significant economic activity. In contrast, North Dakota experienced a decline of -2.2 percent in real personal income. This decrease in a state that has historically seen fluctuations tied to its energy sector suggests potential headwinds or adjustments within its primary economic drivers.
At the national level, real personal income grew by 2.9 percent in 2024, mirroring the national growth rate of real PCE. Similar to PCE, current-dollar personal income saw a more pronounced increase of 5.6 percent, outpacing the national PCE price index of 2.6 percent. This indicates that, on average, individuals’ earnings outpaced the rate of inflation, contributing to an increase in real disposable income for many Americans.
Regional Price Parities Reveal Cost of Living Variations
The BEA’s release also provided updated figures for Regional Price Parities (RPPs), a critical metric for understanding the cost of living differences between states. RPPs measure the relative price levels for a given area compared to the national average, expressed as a percentage. These parities are crucial for accurately comparing economic well-being and purchasing power across different regions.
The "all items RPP" encompasses all consumption goods and services, with a significant emphasis placed on housing rents, which are frequently the primary driver of RPP differentials. States with higher housing costs naturally exhibit higher RPPs, meaning a dollar spent in these areas buys less than a dollar spent in regions with lower housing expenses. This disparity directly impacts the real value of personal income and the effective purchasing power of consumer expenditures. For instance, a nominal income of $60,000 in a high-cost state might offer a similar standard of living to a nominal income of $45,000 in a low-cost state, after accounting for RPPs.
The BEA continues to publish RPP statistics for metropolitan areas on its website, offering an even more granular view of price level variations within states. These detailed RPP figures are invaluable for businesses making location decisions and for individuals planning relocation.
Revisions and Data Updates
A significant aspect of this release is the revision of annual estimates for real PCE and real personal income by state from 2008 to 2023. These revisions incorporate more complete and detailed source data, ensuring the historical figures are as accurate as possible. This meticulous updating process aligns the state-level data with the annual updates of the National Income and Product Accounts (NIPA) and Gross Domestic Product (GDP) by industry statistics, which were released on September 25, 2025, and the GDP, personal income, and PCE by state statistics released on September 26, 2025. Such consistency across different BEA datasets is vital for comprehensive economic analysis.
Furthermore, the BEA has released new estimates of real per capita PCE and real per capita personal income for 2024. These per capita figures are calculated using U.S. Census Bureau population data for the years 2020 through 2024, providing insights into the average economic well-being of residents in each state. Real per capita data offers a valuable perspective on individual economic standing, factoring in both income and population density.
Discontinuation of Metropolitan Area Statistics
In a notable shift in data presentation, the BEA has discontinued the publication of statistics for metropolitan statistical areas and their metropolitan and nonmetropolitan portions, beginning with the 2024 data release. While real PCE and real personal income will continue to be reported at the state level, and RPPs will still be available for state and local areas, the more granular breakdown for metropolitan areas will no longer be included in these specific news releases. The BEA has provided an FAQ on its website to address user queries regarding this change. This decision likely stems from a strategic effort to streamline reporting and focus resources on core state-level and broader regional data.
Evolution of Data Presentation
The BEA has also implemented changes in how its data tables are presented. Previously embedded within news releases, detailed data tables for real PCE and real personal income by state are now exclusively available through the BEA’s online Interactive Data Application. This modernization aims to reduce duplication, enhance efficiency, and direct users to a more comprehensive and flexible data platform. The Interactive Data Application allows users to customize their data views, access full time series, and download information in various formats, including PDF, Excel, and CSV. This move aligns with broader trends in government data dissemination, emphasizing digital accessibility and user-driven data exploration.
Implications and Broader Context
The comprehensive data released today offers a nuanced view of the American economy at the state level. The widespread growth in real PCE and real personal income suggests a generally healthy economic environment in 2024. However, the variations in growth rates and the significant differences in regional price parities highlight persistent economic disparities.
For policymakers, these figures provide essential insights for fiscal and economic development strategies. States experiencing strong growth may be able to leverage their economic momentum, while those facing contractions or higher costs of living may require targeted interventions or policy adjustments. The data on RPPs, in particular, underscore the importance of considering the cost of living when evaluating economic well-being and implementing social programs or wage policies.
Businesses can utilize this information to inform investment decisions, market analysis, and strategic planning. Understanding where consumer spending is robust and where the cost of doing business is more manageable can be critical for profitability and expansion. For example, a company considering expanding its operations might find states with strong real PCE growth and moderate RPPs particularly attractive.
The revised historical data also allows for more accurate trend analysis and forecasting. The integration of updated source data ensures that the BEA’s economic indicators are as precise as possible, providing a reliable foundation for academic research and economic modeling.
The discontinuation of metropolitan area data, while a change for some users, emphasizes the BEA’s commitment to providing high-level, impactful data. The continued availability of state-level data, along with RPPs for local areas, ensures that essential comparative economic information remains accessible.
Looking Ahead
The BEA has also provided a preview of its next release, scheduled for December 10, 2026. This upcoming release will feature the 2025 data for real personal consumption expenditures by state and real personal income by state. The 2024 data, as presented today, will be superseded by the 2025 figures, with the original 2024 data archived for historical reference. This regular cycle of data updates and revisions ensures that the nation’s economic statistics remain current and reflective of evolving economic conditions.
The BEA’s commitment to providing timely and detailed economic data is fundamental to informed decision-making across all sectors of society. The 2024 state-level economic statistics offer a valuable snapshot of the nation’s economic health, highlighting both areas of strength and persistent challenges.