Lana Rhoades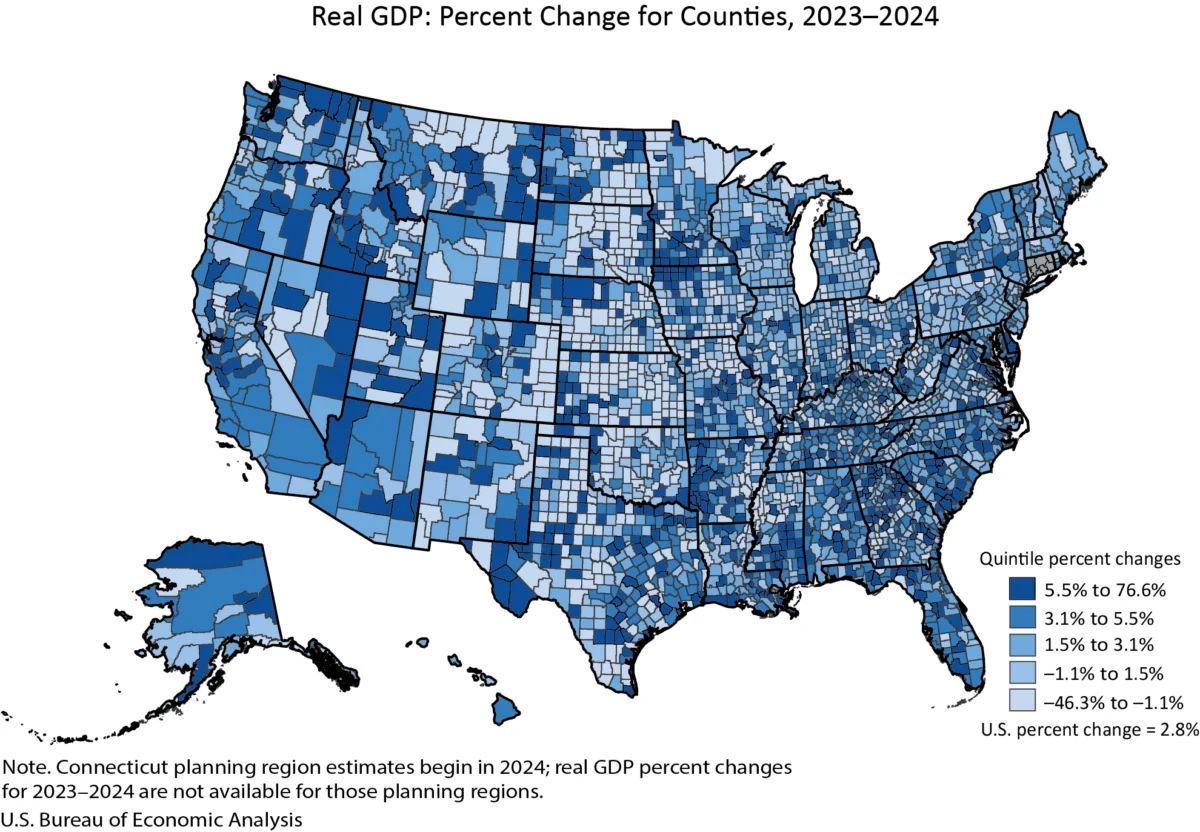
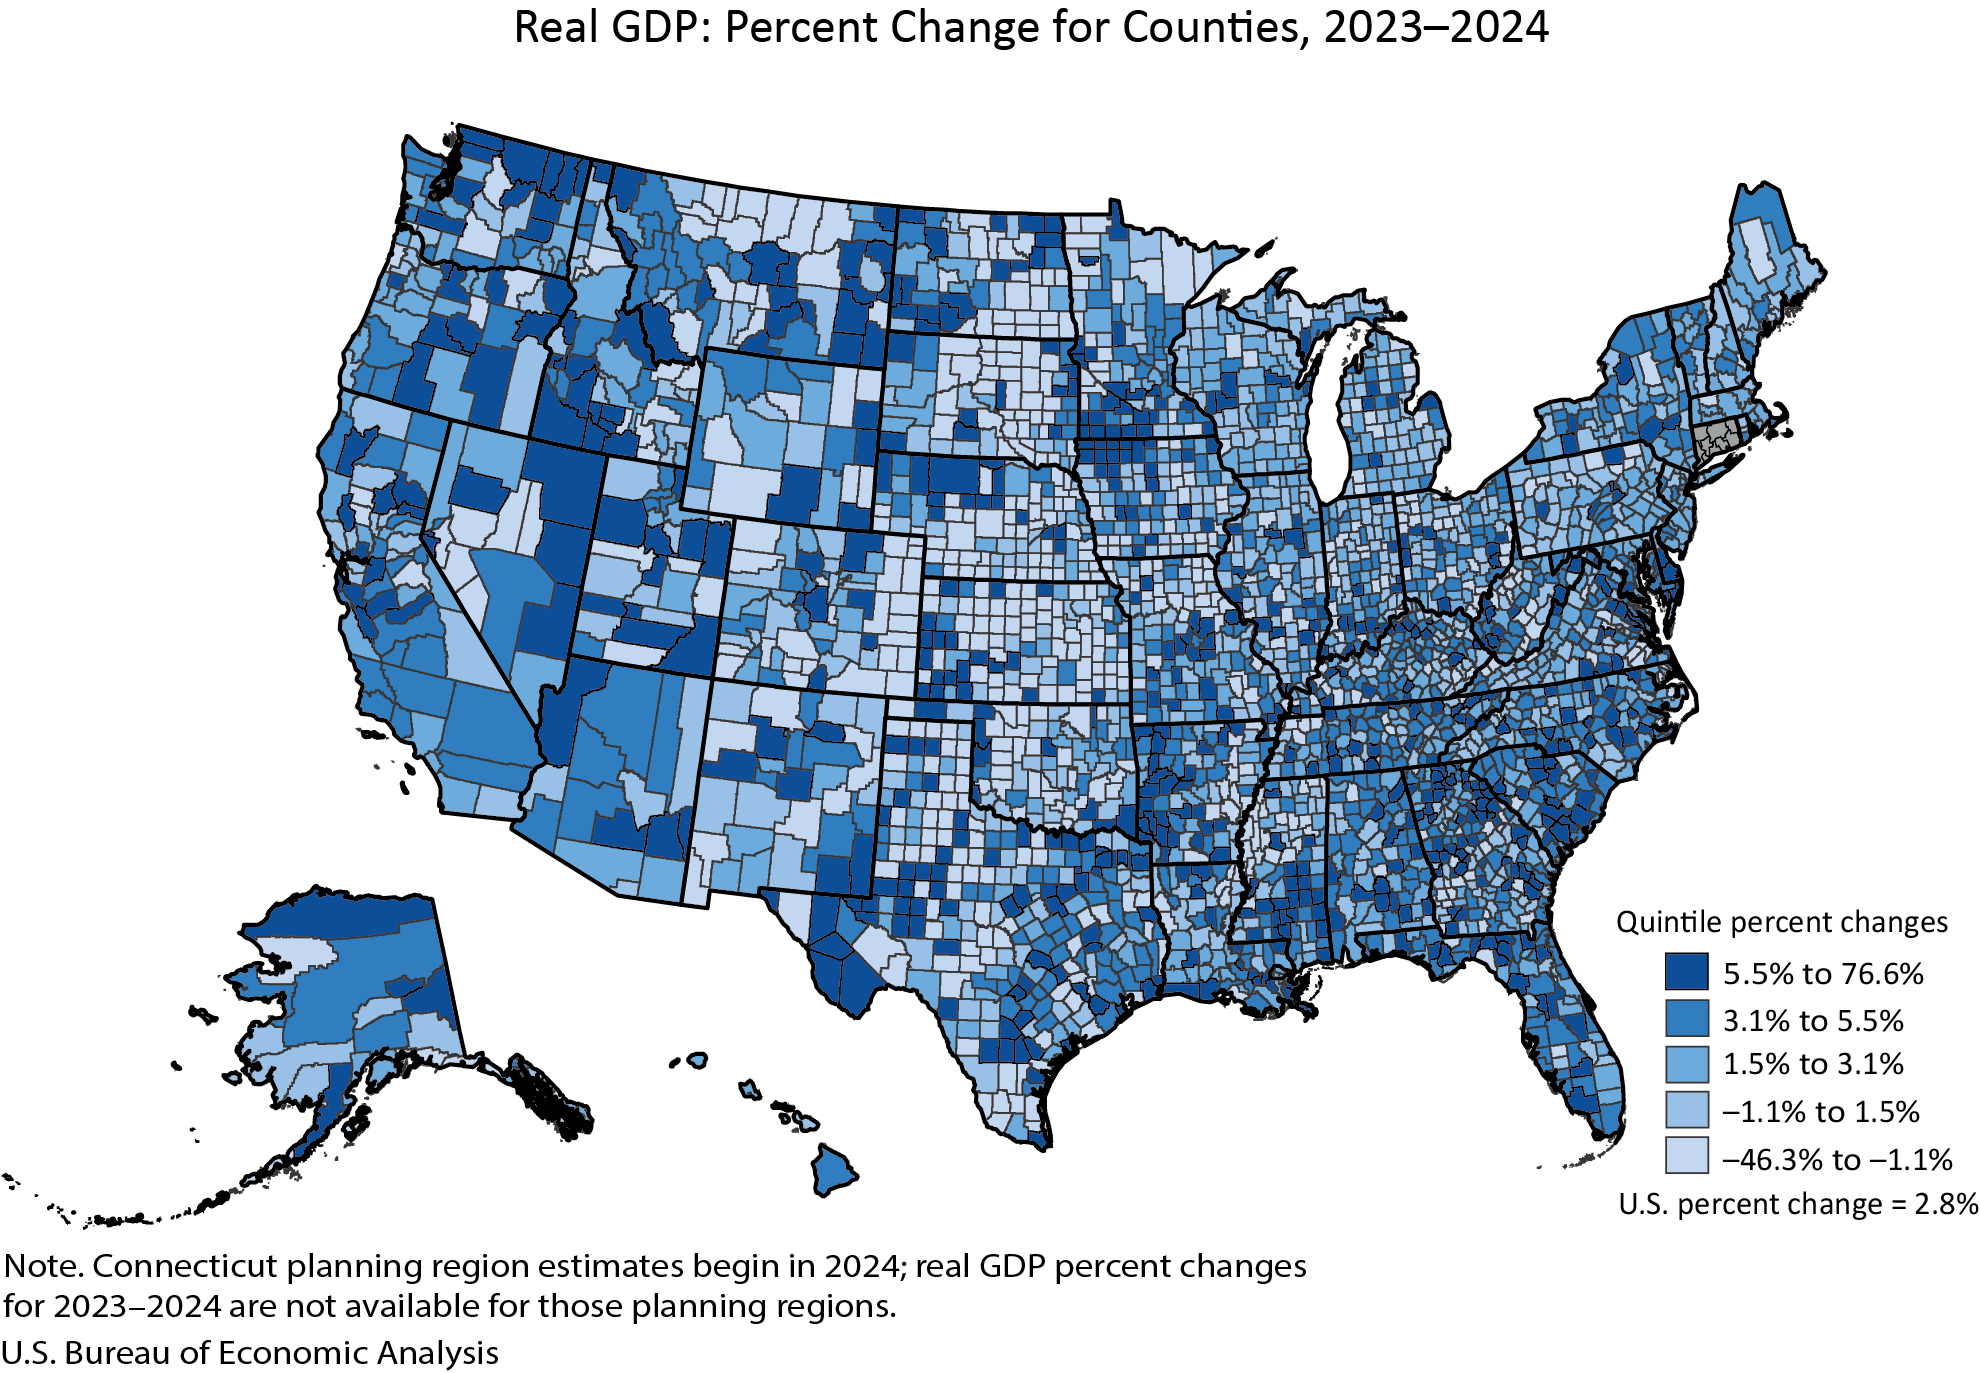
The economic landscape of the United States in 2024 presented a mosaic of growth and contraction at the county level, with real Gross Domestic Product (GDP) expanding in a substantial majority of counties while others faced significant economic headwinds. According to the latest estimates released by the U.S. Bureau of Economic Analysis (BEA), real GDP saw an increase in 2,273 counties, a decrease in 809 counties, and remained unchanged in 24 counties. This divergence underscores the varied economic realities faced by communities across the nation, reflecting a complex interplay of industry performance, demographic shifts, and local economic drivers.
The breadth of economic activity is starkly illustrated by the range of percent changes in real GDP. Carter County, Montana, emerged as a standout performer, registering an impressive 76.6 percent increase in its real GDP. Conversely, Baca County, Colorado, experienced a significant contraction, with its real GDP declining by 46.3 percent. These extreme figures highlight the potential for dramatic economic swings at the local level, influenced by factors ranging from natural resource extraction to the fortunes of specific industries.
The sheer scale of county economies, as measured by real GDP, also reveals considerable disparities. In 2024, New York County, New York, anchored by Manhattan’s vibrant financial and service sectors, recorded the highest total level of real GDP at an astounding $813.7 billion. In stark contrast, Issaquena County, Mississippi, a primarily rural area, reported the smallest economic output, with a real GDP of just $15.7 million. This vast difference in economic size points to the persistent urban-rural divide and the concentration of economic power in major metropolitan centers.
Understanding the Data: A Deeper Dive into County Economic Performance
The BEA’s annual release of county-level economic data provides a granular look at the engines driving local economies. Real GDP, the core metric, represents the total market value of all final goods and services produced within a county in a given year, adjusted for inflation. This measure is crucial for understanding the productive capacity and overall economic health of a region.
The data released today revises estimates from 2020 to 2023, incorporating new and more comprehensive source data. This iterative process ensures that the statistics reflect the most accurate picture of economic activity. The 2024 estimates are particularly significant as they align with the BEA’s annual updates to the National Income and Product Accounts (NIPA) and state-level GDP statistics, released in late September 2025. This synchronization enhances the consistency and comparability of economic data across different geographic levels.
Economic Trends Across County Size Categories
The BEA’s analysis also breaks down economic trends by county population size, offering insights into how different types of communities are faring.
-
Large Counties (Population > 500,000): These economic powerhouses saw a strong performance, with 145 large counties experiencing GDP growth, zero experiencing decline, and one remaining unchanged. The trend range within this group was from a 10.7 percent increase in Pinal County, Arizona, to a 0.0 percent change in Johnson County, Kansas, indicating a generally stable and positive growth trajectory for the largest economies. Their total GDP levels are substantial, with New York County, NY, at $813.7 billion and Pinal County, AZ, at $12.7 billion, illustrating the immense economic weight of these areas.
-
Medium Counties (Population 100,000 to 500,000): This category demonstrated robust growth, with 451 medium counties increasing their real GDP, 20 experiencing a decline, and 3 remaining unchanged. The growth range was significant, from a 12.4 percent surge in Jefferson County, Texas, to a modest 2.6 percent decline in Black Hawk County, Iowa. The economic output in these counties varies, with Mercer County, New Jersey, at $46.6 billion and Liberty County, Texas, at $2.6 billion, showing a wide spectrum of economic scale within this group.
-
Small Counties (Population < 100,000): While the majority of counties fall into this category, their economic performance was more mixed. A total of 1,677 small counties saw their real GDP grow, but a substantial 789 experienced declines, and 20 showed no appreciable change. The trend range here was the widest, from the exceptional 76.6 percent rise in Carter County, Montana, to the significant 46.3 percent drop in Baca County, Colorado. The economic scale within small counties also varies greatly, from Martin County, Texas, at $15.1 billion to Issaquena County, Mississippi, at $15.7 million.
Personal Income Trends Mirror Economic Activity
Complementing the GDP data, the BEA also released estimates for personal income at the county level. Personal income, in current dollars, provides a measure of the income received by households and is a key indicator of consumer spending power and household well-being.
In 2024, personal income saw a widespread increase, with 2,768 counties reporting growth, 331 experiencing a decrease, and 7 remaining unchanged. The percent change in personal income ranged from a notable 22.6 percent increase in Harding County, South Dakota, to a significant 23.3 percent decline in Issaquena County, Mississippi. This aligns with the broader GDP trends, suggesting that economic growth generally translates to increased household earnings, although specific factors can influence income levels independently of overall economic output.
The disparity in personal income levels across counties is as pronounced as that of GDP. Los Angeles County, California, boasted the highest total personal income at $818.5 billion, driven by its vast population and diverse economic base. In contrast, Loving County, Texas, a sparsely populated oil-producing region, recorded the lowest personal income at $10.6 million.
Personal Income Highlights by Population Size:
-
Large Counties: 146 large counties reported personal income growth, with San Joaquin County, California, seeing a 9.7 percent increase and Philadelphia County, Pennsylvania, experiencing a 2.7 percent rise. Total personal income in this category is substantial, with Los Angeles County, CA, at $818.5 billion and Pinal County, AZ, at $26.1 billion.
-
Medium Counties: 474 medium counties saw their personal income grow. Merced County, California, led with a 10.9 percent increase, followed by Genesee County, Michigan, with a 1.6 percent rise. Collier County, Florida, reported $62.5 billion in personal income, while Floyd County, Georgia, had $4.9 billion.
-
Small Counties: A significant 2,148 small counties experienced personal income growth, while 331 declined and 7 remained unchanged. The range was wide, with Harding County, SD, at 22.6 percent growth and Issaquena County, MS, at a 23.3 percent decline. Teton County, Wyoming, reported $12.4 billion in personal income, and Loving County, Texas, had $10.6 million.
Evolution of BEA County Data Reporting
This year’s release marks a significant shift in how the BEA presents county-level economic data. For the first time, the annual GDP and personal income by county statistics are being published in a single, combined news release. This consolidation aims to provide a more holistic view of county economies and replaces two separate releases that were previously issued on different days.
Furthermore, the BEA has transitioned to its Interactive Data Application for detailed statistical tables. This change means that tables are no longer embedded directly within the news release but are accessible via hyperlinks. This approach is intended to reduce duplication, enhance efficiency, and direct users to BEA’s most comprehensive and flexible data tools. The Interactive Data Application allows for customization of tables, retrieval of full time series, and downloading of data in various formats, including PDF, Excel, and CSV.
Changes in Geographic Definitions and Discontinuation of Certain Statistics
A notable change in the methodology involves Connecticut’s data. Beginning with the 2024 estimates, Connecticut’s economic statistics will incorporate the state’s planning region geographic definitions, replacing the traditional county-based definitions. As these planning region estimates are only available for 2024, they have not been included in the percent change ranges presented in this release.
In a broader shift, the BEA has discontinued the publication of statistics for metropolitan statistical areas, micropolitan statistical areas, metropolitan divisions, combined statistical areas, and metropolitan and nonmetropolitan portions. This decision aligns with the focus on county-level data for GDP and personal income. While these specific area statistics are no longer being published, GDP and personal income estimates will continue to be available for all counties. Further details on this discontinuation can be found in the BEA’s FAQ section.
The BEA has also introduced new estimates for per capita personal income for 2024, calculated using U.S. Census Bureau population figures for the years 2020 through 2024.
Looking Ahead: Future Releases and Data Accessibility
The BEA’s commitment to providing timely and accurate economic data is ongoing. The next release of GDP and personal income by county statistics, covering the year 2025, is scheduled for December 2, 2026. At that time, the 2024 data will be superseded by the updated figures. For users seeking access to historical data that has been updated or replaced, the BEA’s Data Archive will remain a valuable resource.
The BEA continues to provide extensive documentation for its statistical products. For definitions, statistical conventions, regional breakdowns, and guidance on the use of these statistics, users are encouraged to consult the "Additional Information" section available on the BEA website.
The detailed data tables referenced in this release, including GDP and personal income summaries by county, can be accessed through BEA’s Interactive Data Application. These tables offer comprehensive historical time series and allow for detailed analysis of economic trends at the county level.
The release of these detailed county-level economic statistics underscores the importance of understanding economic performance not just at the national or state level, but also within the specific contexts of local communities. The divergent trends observed in 2024 highlight the need for tailored economic development strategies and policies that address the unique challenges and opportunities faced by counties across the United States. The BEA’s continued efforts to refine its data collection and reporting methods ensure that these crucial insights remain available to policymakers, researchers, and the public.