Lana Rhoades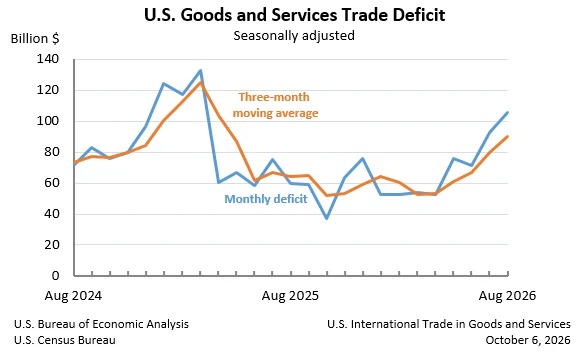
The United States experienced a substantial widening of its trade deficit in goods and services for August, reaching $105.6 billion, an increase of $12.7 billion from the revised $92.8 billion deficit recorded in July. This upward trend signals a growing imbalance in the nation’s international commerce, with imports outpacing exports at a notable pace. The latest figures, released jointly by the U.S. Census Bureau and the U.S. Bureau of Economic Analysis, highlight a complex interplay of global economic forces impacting American trade dynamics.
August Trade Imbalance: A Deeper Dive
The August deficit represents a significant 13.7% increase from the previous month. This expansion was primarily fueled by a robust rise in imports, which surged by $17.2 billion to $420.8 billion. Conversely, exports also saw growth, increasing by $4.5 billion to $315.2 billion. However, the rate of import growth significantly outpaced that of exports, leading to the wider trade gap.
Breaking down the figures, the deficit in goods alone widened by $12.8 billion to $136.6 billion in August. This substantial increase in the goods deficit was partially offset by a slight increase in the services surplus, which grew by less than $0.1 billion to $31.0 billion. The services sector, encompassing areas like travel, financial services, and intellectual property, continues to provide a positive contribution to the U.S. trade balance, though it was insufficient to counteract the growing deficit in goods.
Underlying Trends and Shifting Dynamics
The monthly figures provide a snapshot of ongoing trade patterns, but a look at longer-term trends and underlying components offers a more comprehensive understanding. While the August deficit marked an increase, year-to-date data reveals a different narrative. For the first eight months of the year, the goods and services deficit actually decreased by $138.2 billion, or 19.9%, compared to the same period in the preceding year. This significant reduction suggests that while August saw a setback, the broader trend for the year has been towards a narrowing of the overall trade imbalance.
The year-to-date export growth has been particularly strong, increasing by $267.7 billion, or 11.8%. This indicates robust demand for American goods and services in the global market. However, imports have also climbed, albeit at a slower pace year-to-date, by $129.5 billion, or 4.4%. The divergence in monthly versus year-to-date trends suggests that August’s widening deficit may be attributable to specific seasonal factors, shifts in global supply chains, or temporary demand surges for certain imported goods.
Examining the Components: Exports and Imports in Detail
Exports: In August, total exports reached $315.2 billion, an increase of $4.5 billion from July. This growth was driven by a $4.4 billion rise in exports of goods, bringing the total to $205.7 billion. On a Census basis, goods exports increased by $4.2 billion, with net balance of payments adjustments adding another $0.3 billion. Exports of services also saw a modest increase, growing by less than $0.1 billion to $109.5 billion. This continued expansion in services exports underscores the strength of the U.S. services sector as a global provider.
Imports: The surge in imports was the primary driver of the widened deficit in August. Total imports climbed to $420.8 billion, an increase of $17.2 billion from July. Imports of goods saw a substantial rise of $17.2 billion, reaching $342.2 billion. On a Census basis, goods imports increased by $17.4 billion, with a decrease of $0.2 billion in net balance of payments adjustments. Imports of services also experienced a slight uptick, increasing by less than $0.1 billion to $78.5 billion. The significant increase in goods imports suggests strong domestic demand for foreign-produced goods, potentially reflecting consumer spending patterns and business inventory adjustments.
Real vs. Nominal: Understanding Price Impacts
When analyzing trade data, it is crucial to distinguish between nominal and real values, especially in periods of fluctuating prices. The report highlighted that the real goods deficit, measured in 2017 dollars and on a Census basis, increased by $8.7 billion, or 8.2%, to $114.7 billion in August. This represents an 11.1% increase in the nominal deficit for goods. The fact that the real goods deficit grew at a slower pace than the nominal deficit suggests that some of the increase in the nominal value of goods imports was due to price increases rather than simply a higher volume of goods. This inflation effect can obscure the true underlying volume changes in trade.
Three-Month Moving Averages: Smoothing Out Volatility
To mitigate the impact of short-term fluctuations, the report also provides three-month moving averages. For the three months ending in August, the average goods and services deficit increased by $9.9 billion to $89.9 billion. This indicates a more sustained trend of widening deficits over a slightly longer period. On a year-over-year basis, the average goods and services deficit for the three months ending in August was up by $25.4 billion compared to the same period in 2025. This year-over-year increase in the moving average suggests that, despite the year-to-date reduction, the trade imbalance has been trending upwards in recent months.
Geographic Breakdown: Trade Partners and Imbalances
The report also provides insights into trade balances with specific countries and regions. In August, the U.S. recorded trade surpluses with several key partners, including the Netherlands ($7.7 billion), South and Central America ($5.6 billion), the United Kingdom ($3.6 billion), and Hong Kong ($2.3 billion). Significant surpluses were also noted with Brazil ($1.3 billion), Belgium ($1.2 billion), Australia ($0.6 billion), and Saudi Arabia ($0.4 billion).
Conversely, substantial trade deficits were observed with Mexico ($27.7 billion), Vietnam ($24.0 billion), Taiwan ($18.3 billion), and China ($16.4 billion). Other notable deficits include those with the European Union ($11.0 billion), South Korea ($9.4 billion), Canada ($7.1 billion), and India ($6.2 billion). These figures highlight the concentration of trade imbalances with specific economic blocs and nations, reflecting complex global supply chain relationships and varying levels of industrial competitiveness.
Context and Implications: What Does This Mean for the U.S. Economy?
The widening U.S. trade deficit in August, while concerning in its monthly increase, must be viewed within the broader context of global economic conditions. Factors such as fluctuating global demand, supply chain disruptions, geopolitical events, and currency exchange rates all play a role in shaping trade flows.
A persistent and growing trade deficit can have several implications for the U.S. economy. It signifies that the U.S. is consuming more goods and services than it is producing and exporting. This can lead to increased foreign debt, as the U.S. finances its imports by borrowing from or selling assets to other countries. It can also put downward pressure on domestic industries that compete with imports, potentially affecting employment in those sectors.
However, a trade deficit is not inherently negative in all circumstances. It can also reflect strong domestic investment and consumption, indicating a healthy and growing economy that attracts foreign goods and capital. The robust year-to-date export growth suggests that American businesses remain competitive on the global stage. The key is to monitor whether the deficit becomes unsustainable and begins to negatively impact long-term economic stability.
Economists often point to the relationship between national savings and investment as a driver of trade deficits. When a country’s investment exceeds its savings, it typically must borrow from abroad, leading to a current account deficit, which includes the trade deficit. The U.S. has historically had a lower national savings rate compared to some other major economies, contributing to its persistent trade imbalances.
The recent increases in both goods and services imports in August could be influenced by a variety of factors. Strong consumer demand, fueled by government stimulus measures or a robust labor market, can drive up demand for imported goods. Businesses may also be increasing imports to replenish inventories that were depleted during periods of supply chain strain. Furthermore, shifts in global manufacturing, with some countries increasing their export capacity, can also contribute to higher import volumes for the U.S.
The United States Trade Representative’s office and the Department of Commerce continuously monitor trade data to assess the impact on American industries and workers. Policymakers often consider these figures when formulating trade policy, including negotiations for trade agreements and the imposition of tariffs or other trade remedies. The August data will likely be a topic of discussion as these agencies analyze current economic trends and their implications for U.S. businesses and consumers.
Revisions and Future Outlook
The report also noted revisions to July data, with adjustments made to both exports and imports. These revisions are a standard part of the statistical process and help to refine the accuracy of the reported figures.
The next release of U.S. International Trade in Goods and Services is scheduled for November 4, 2026, covering data for September 2026. This upcoming report will provide further insights into whether the widening deficit observed in August is a temporary anomaly or the beginning of a new trend. Analysts will be closely watching for continued increases in imports or a slowdown in export growth, which could signal growing economic headwinds.
A brief notice within the release highlighted a country name change, with references to "Nauru" now being replaced by "Naoero" to align with the country’s official name and international recognition. This minor update underscores the dynamic nature of global affairs and their reflection in economic reporting.
In conclusion, the August trade data presents a mixed picture. While the year-to-date trend shows a narrowing deficit, the significant monthly increase in August, driven by a surge in imports, warrants careful observation. The interplay of global economic forces, domestic demand, and supply chain dynamics will continue to shape the U.S. trade balance in the coming months.