
 Lana Rhoades
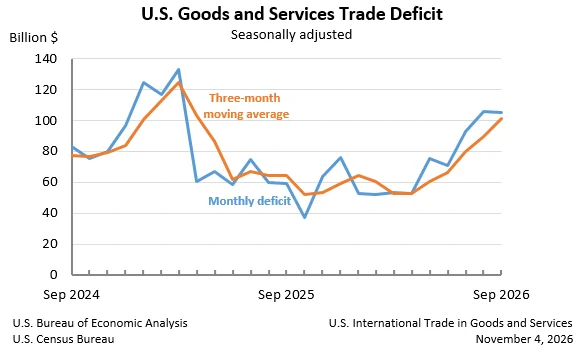
The United States recorded a goods and services deficit of $105.0 billion in September, a modest decrease of $0.7 billion from the revised August figure of $105.7 billion. This latest report from the U.S. Census Bureau and the U.S. Bureau of Economic Analysis, released on November 4, 2026, indicates a slight recalibration in the nation’s international trade balance, though underlying trends suggest continued robust trade activity.
September Trade Dynamics: A Closer Look
In September, U.S. exports of goods and services reached $321.5 billion, marking a significant increase of $5.8 billion from the previous month. This upward momentum in exports was primarily fueled by a $5.1 billion surge in goods exports, which climbed to $211.0 billion. Services exports also contributed positively, growing by $0.7 billion to $110.5 billion.
Conversely, imports also saw an increase, with total goods and services imports reaching $426.6 billion, up $5.2 billion from August. Goods imports rose by $4.4 billion to $346.9 billion, while services imports edged up by $0.8 billion to $79.7 billion.
The narrowing of the overall deficit in September was a result of two key movements: a decrease in the goods deficit and a slight reduction in the services surplus. The goods deficit contracted by $0.7 billion to $135.9 billion. Simultaneously, the services surplus experienced a marginal decrease of less than $0.1 billion, settling at $30.9 billion. This indicates that while the imbalance in goods trade lessened, the nation’s positive balance in services also saw a minor dip.
Year-to-Date Trends Show Significant Growth
Looking at the broader picture, the year-to-date figures paint a more substantial narrative of trade expansion and a narrowing deficit compared to the same period in 2025. For the first nine months of 2026, the cumulative goods and services deficit decreased by $92.4 billion, representing a 12.2 percent reduction. This substantial improvement is underpinned by robust growth in both exports and imports. Total exports for the year-to-date period increased by an impressive $297.3 billion, a 11.6 percent rise. Imports, while also growing, saw a more moderate increase of $204.9 billion, a 6.2 percent gain. This divergence in growth rates between exports and imports has contributed to the shrinkage of the overall trade deficit.
Three-Month Moving Averages Signal Shifting Momentum
Analysis of three-month moving averages provides a smoothed perspective on trade trends, mitigating the impact of monthly volatility. For the three months ending in September, the average goods and services deficit increased by $11.3 billion to $101.2 billion. This uptick in the moving average suggests a recent acceleration in the deficit’s growth trajectory, contrasting with the year-to-date improvement.
On a year-over-year basis, the average goods and services deficit for the three months ending in September 2026 saw a notable increase of $36.5 billion compared to the same period in 2025. This indicates that, despite the year-to-date improvement, the trend over the most recent three-month period reflects a wider trade gap compared to the prior year.
Deep Dive into Goods and Services Components
Exports Analysis
The $5.1 billion increase in goods exports in September was attributed to a $5.0 billion rise in goods on a Census basis, supplemented by a $0.1 billion increase in net balance of payments adjustments. This suggests broad-based strength across various categories of exported goods.
The $0.7 billion growth in services exports to $110.5 billion reflects continued demand for U.S. services globally. While the specific drivers of this growth are not detailed in the release, typical strong performers in U.S. services exports include travel, transport, financial services, intellectual property, and other business services.
Imports Analysis
The $4.4 billion increase in goods imports to $346.9 billion is a complex figure. Imports of goods on a Census basis surged by $8.0 billion, but this was partially offset by a $3.6 billion decrease in net balance of payments adjustments. This discrepancy highlights the nuances in how trade data is compiled and reported, particularly when accounting for various financial and transactional adjustments.
The $0.8 billion increase in services imports to $79.7 billion indicates a growing demand for foreign services within the U.S. economy. This could encompass a range of categories, such as foreign tourism in the U.S., foreign direct investment in U.S. services industries, or the use of foreign technological or creative services.
Real Goods Deficit and Data Revisions
The report also sheds light on the "real" goods deficit, which adjusts for price changes. The real goods deficit, calculated on a Census basis in 2017 dollars, increased by $3.5 billion, or 3.0 percent, in September. This rise in the real deficit was more pronounced than the 2.2 percent increase in the nominal goods deficit. The release notes that the divergence between the nominal goods deficit on a Census basis (which increased) and the nominal goods deficit on a Balance of Payments (BOP) basis (which decreased) in September is due to a BOP adjustment for nonmonetary gold imports. This underscores the importance of understanding the specific methodologies used when interpreting trade data, as different bases of calculation can yield different short-term trends.
The report also indicated revisions to August exports and imports, though the specific details of these revisions were not elaborated upon in the provided summary. Such revisions are common in economic data releases as more comprehensive information becomes available.
Trade Balances with Key Partners
The September data provides a snapshot of the U.S. trade balance with various countries and regions. The United States maintained trade surpluses with several key partners, including the Netherlands ($7.7 billion), South and Central America ($6.2 billion), the United Kingdom ($3.0 billion), Hong Kong ($2.5 billion), Australia ($2.1 billion), Brazil ($1.1 billion), Singapore ($0.7 billion), Saudi Arabia ($0.5 billion), and Belgium ($0.2 billion).
Conversely, significant trade deficits were recorded with a number of countries. Mexico continued to represent the largest deficit at $28.7 billion, followed by Vietnam ($25.3 billion), Taiwan ($21.9 billion), and China ($17.9 billion). Other notable deficits include those with the European Union ($14.2 billion), South Korea ($12.2 billion), Germany ($7.9 billion), Italy ($6.3 billion), Malaysia ($5.3 billion), Japan ($4.8 billion), India ($4.5 billion), and Canada ($4.4 billion). Smaller deficits were also observed with Ireland ($3.0 billion), Switzerland ($1.3 billion), France ($1.3 billion), and Israel ($0.7 billion). These figures highlight the complex and multifaceted nature of global trade relationships, with significant imbalances existing across different trading partners.
Broader Economic Context and Implications
The September trade figures arrive amidst a dynamic global economic landscape. Fluctuations in currency exchange rates, geopolitical events, and varying rates of economic growth across major economies can all influence trade balances. The reported narrowing of the deficit in September, while modest, could be interpreted as a positive signal for U.S. economic competitiveness, particularly if driven by increased export activity.
However, the increase in the three-month moving average deficit suggests that the underlying trend may not be as consistently positive. Economists often look to these moving averages for a more stable indication of trade performance, and the recent uptick warrants continued monitoring.
The year-to-date improvement in the trade deficit, however, is a more significant indicator of positive progress. A sustained reduction in the trade deficit can have several implications for the U.S. economy. It can contribute to higher domestic production, potentially leading to job creation in export-oriented industries. Furthermore, a narrowing deficit can reduce the reliance on foreign capital to finance domestic spending, potentially leading to a stronger currency and lower inflation over the long term.
The performance of both goods and services exports is crucial. A strong export sector is a vital engine for economic growth, allowing U.S. businesses to access larger international markets. The reported increase in exports of both goods and services in September is a testament to the resilience and competitiveness of American industries on the global stage.
Conversely, the rise in imports, while indicating robust domestic demand, also means that a larger portion of that demand is being met by foreign producers. The balance between export growth and import growth is key to achieving a sustainable trade position.
Looking Ahead
The next release of U.S. International Trade in Goods and Services data is scheduled for December 8, 2026, covering trade figures for October 2026. This upcoming report will provide further insights into whether the trends observed in September are continuing, accelerating, or reversing, offering a clearer picture of the evolving U.S. trade landscape. Analysts will be particularly keen to observe whether the positive year-to-date momentum continues or if the recent uptick in the three-month moving average deficit signals a shift in the trade balance. The interplay between global demand, domestic economic conditions, and the ongoing geopolitical environment will undoubtedly continue to shape these figures.
The data released today is based on seasonally adjusted statistics on a balance of payments basis, unless otherwise specified. Additional detailed statistics, including not seasonally adjusted data and goods on a Census basis, are available through the U.S. Census Bureau and the U.S. Bureau of Economic Analysis. The full release and related data can be accessed on their respective websites.