
 Lana Rhoades
The economic landscape of the United States in 2024 presented a varied picture at the county level, with real gross domestic product (GDP) experiencing growth in a significant majority of counties, while personal income saw an even broader surge. According to the latest estimates released by the U.S. Bureau of Economic Analysis (BEA), this divergence highlights the complex and often localized nature of economic activity across the nation. The data reveals a landscape where some counties are thriving, others are contracting, and many are navigating a period of subtle or stagnant economic change.
County-Level Economic Performance: A Tale of Two Metrics
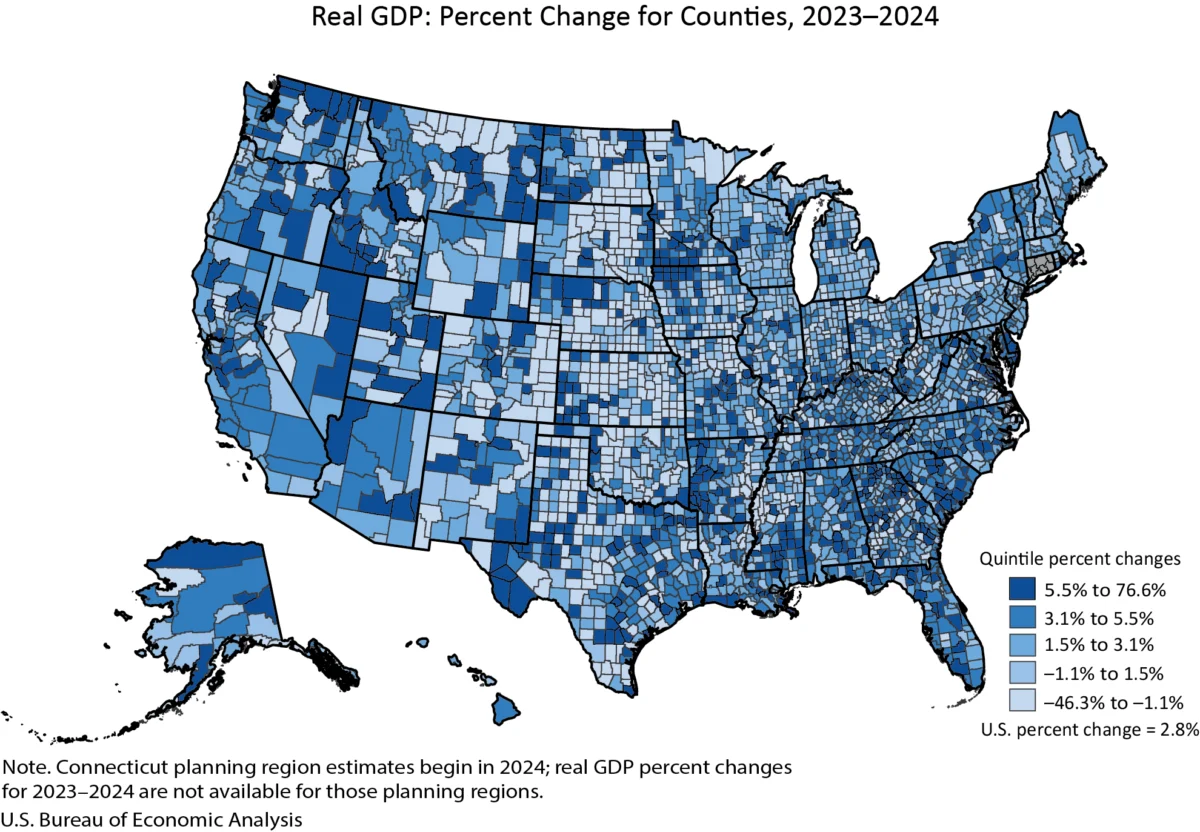
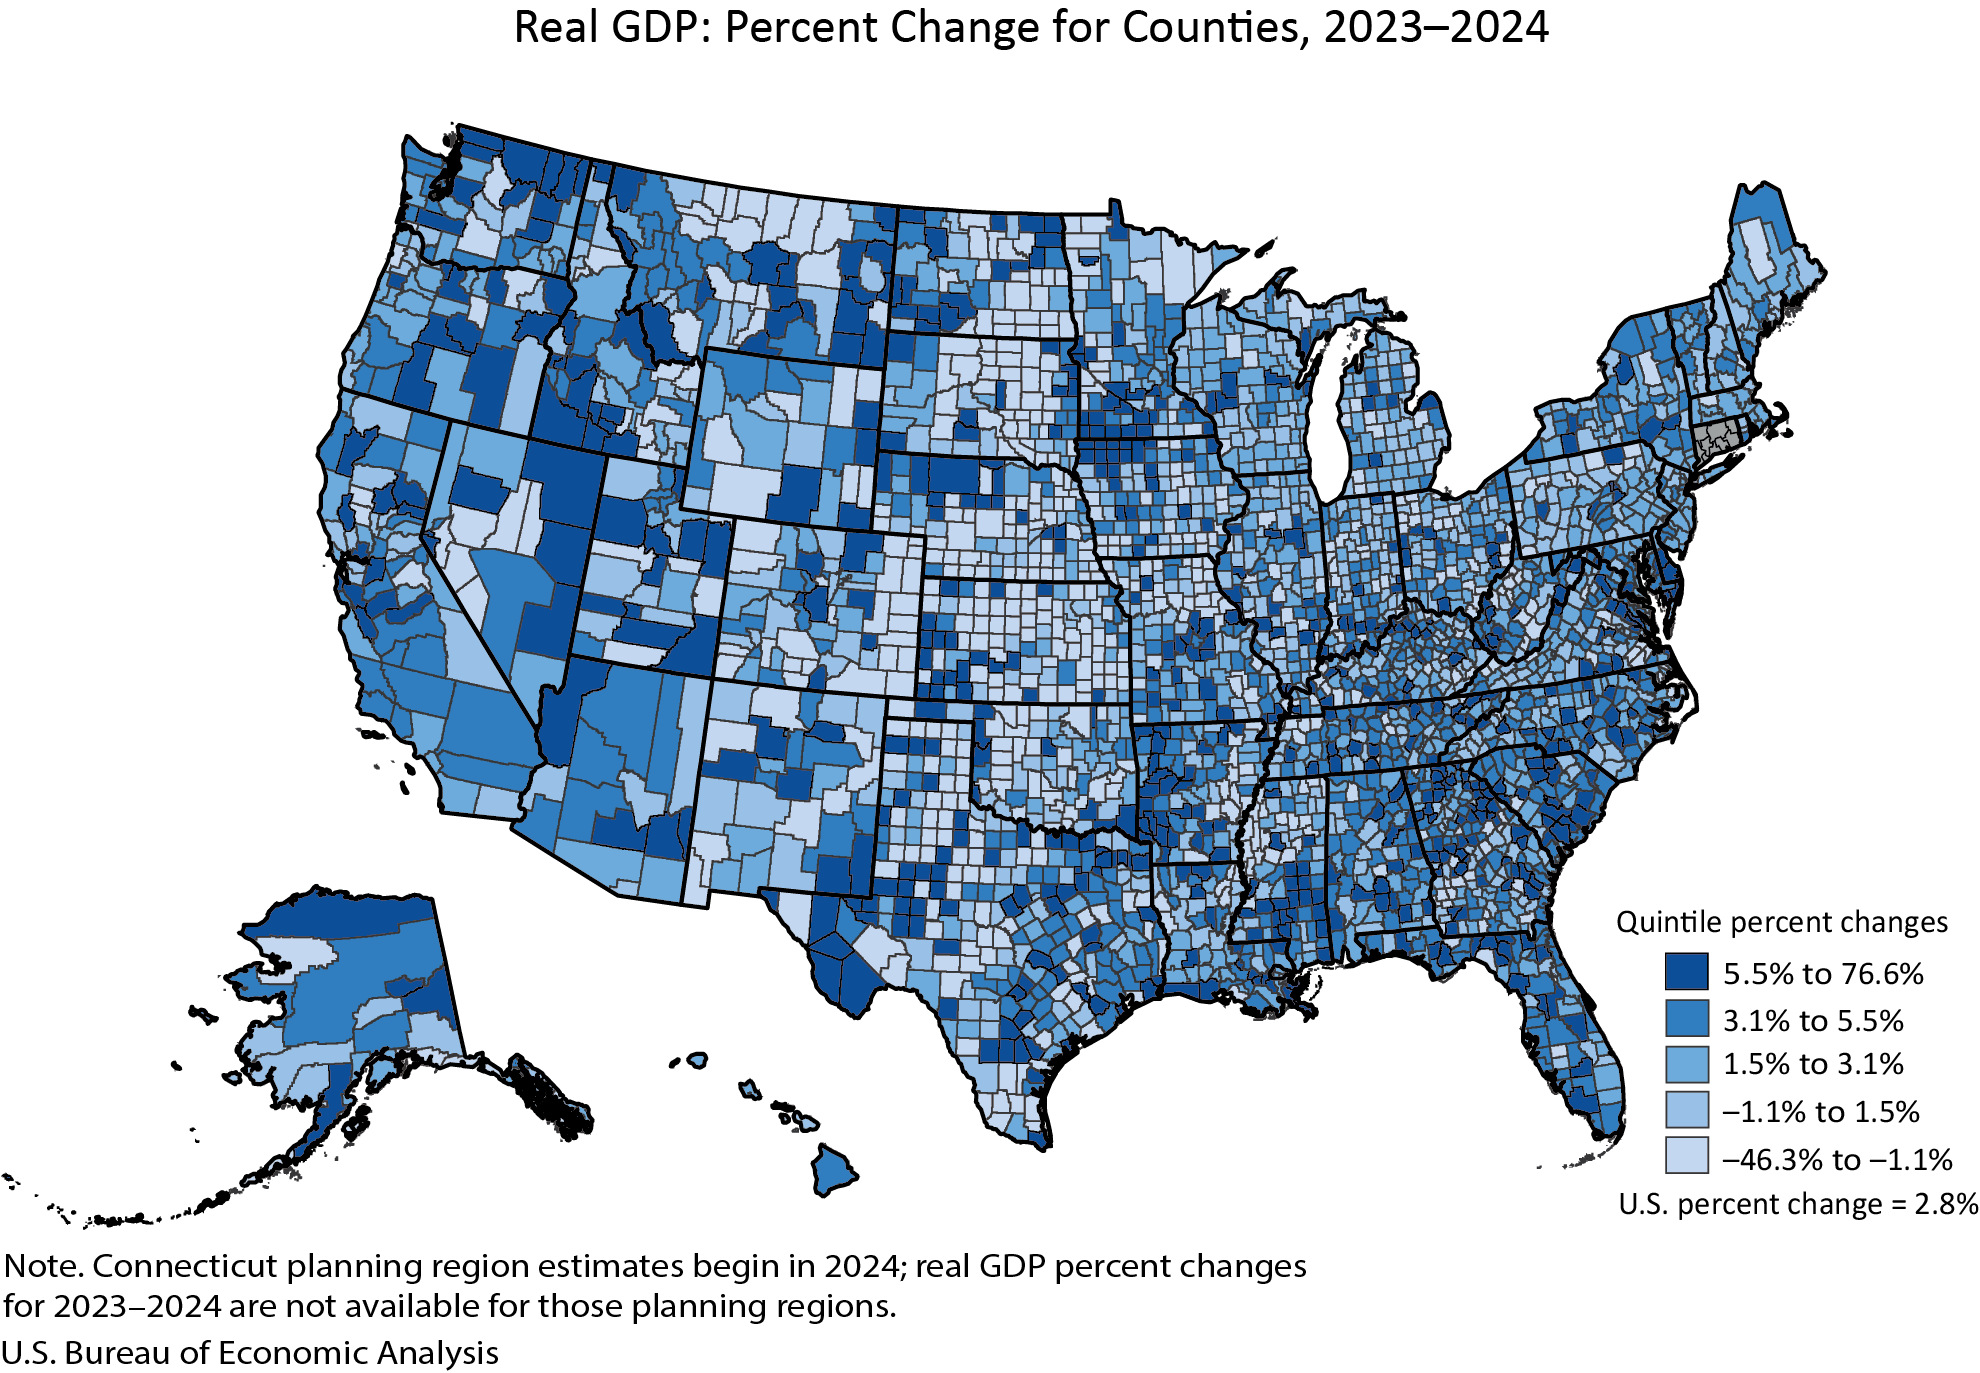
In 2024, the BEA’s comprehensive county-level data indicated that real GDP increased in 2,273 counties, representing a substantial portion of the nation’s economic geography. Conversely, 809 counties experienced a decrease in their real GDP, while a small fraction, 24 counties, remained unchanged. This overall trend of growth across the majority of counties suggests a broad-based economic expansion, albeit with notable regional disparities.
The percentage change in real GDP presented a wide spectrum of outcomes. At the upper end of growth, Carter County, Montana, reported a remarkable 76.6 percent increase, signaling a significant boom in its economic output. On the other end of the spectrum, Baca County, Colorado, faced a considerable downturn, with its real GDP declining by 46.3 percent. These extreme cases underscore the vast differences in economic performance that can occur even within a single year.
Simultaneously, personal income, a crucial indicator of household financial well-being, showed an even more positive trend. Personal income, measured in current dollars, rose in a commanding 2,768 counties. This broad increase suggests that, for a vast majority of Americans, their earnings and other income sources saw an uptick in 2024. In contrast, only 331 counties saw a decrease in personal income, and a mere 7 counties reported no change. The percent change in personal income ranged from a robust 22.6 percent increase in Harding County, South Dakota, to a significant 23.3 percent decline in Issaquena County, Mississippi.
This divergence between GDP and personal income trends is noteworthy. While GDP measures the total value of goods and services produced within a county, personal income reflects the income received by households and individuals. A broad increase in personal income might suggest robust consumer spending and a healthy labor market, even if the underlying production metrics (GDP) in some areas are not keeping pace or are experiencing localized declines due to factors like industry-specific challenges or resource depletion.
Economic Scale and Distribution: Vast Disparities Persist
The sheer scale of economic activity, as measured by real GDP, varies dramatically across U.S. counties. In 2024, New York County, New York (Manhattan), stood as the economic powerhouse, with a total real GDP of $813.7 billion. This figure dwarfs the economic output of many smaller counties, illustrating the concentration of economic activity in major metropolitan centers. At the other end of the spectrum, Issaquena County, Mississippi, registered a mere $15.7 million in real GDP, highlighting the significant economic disparities that exist between urban and rural areas, and even between different types of rural economies.
The BEA’s analysis also broke down economic performance by county population size, offering further insights into the trends.
Large Counties (Population > 500,000)
In the category of large counties, 145 experienced GDP growth, while none saw a decline, and one remained unchanged. The range of GDP growth in these large economic centers was generally more moderate than in smaller counties, with Pinal County, Arizona, leading the pack with a 10.7 percent increase. Johnson County, Kansas, reported no appreciable change at 0.0 percent. The economic titans in this category, such as New York County, NY, can boast GDPs reaching hundreds of billions of dollars. For instance, New York County’s GDP stood at $813.7 billion, while Pinal County, AZ, a rapidly growing area, had a GDP of $12.7 billion.
For personal income in large counties, 146 showed growth, with San Joaquin County, California, and Philadelphia County, Pennsylvania, exhibiting increases of 9.7% and 2.7% respectively. These figures indicate a steady upward trend in household earnings within major population centers.
Medium Counties (Population 100,000 to 500,000)
Medium-sized counties displayed a healthy economic trajectory, with 451 reporting GDP growth, 20 experiencing declines, and 3 remaining unchanged. Jefferson County, Texas, led the growth with a 12.4 percent increase in real GDP. In contrast, Black Hawk County, Iowa, saw a decline of 2.6 percent. The economic scale here is substantial but less immense than in the largest counties. Mercer County, New Jersey, for example, had a real GDP of $46.6 billion, while Liberty County, Texas, a smaller but growing economic entity, registered $2.6 billion.
In terms of personal income, 474 medium counties experienced growth. Merced County, California, saw a notable 10.9% increase, and Genesee County, Michigan, reported a 1.6% rise.
Small Counties (Population < 100,000)
The category of small counties presented the most dramatic swings in economic fortunes, reflecting their often specialized economies, which can be more susceptible to external shocks or localized booms. A substantial 1,677 small counties saw their real GDP increase, while a significant 789 experienced declines, and 20 remained unchanged. The extreme range of GDP changes was most pronounced here, with Carter County, Montana’s impressive 76.6 percent growth and Baca County, Colorado’s steep 46.3 percent decline. The economic output in these counties can range from billions to mere millions of dollars, with Martin County, Texas, reporting $15.1 billion and Issaquena County, Mississippi, at the lower end with $15.7 million.
For personal income in small counties, 2,148 reported growth. Harding County, South Dakota, led with a 22.6 percent increase, while Issaquena County, Mississippi, experienced a significant 23.3 percent decline. These figures highlight the volatility and potential for rapid change in smaller economic units.
Updates and Methodological Shifts by the BEA
The release of these 2024 county-level statistics marks a significant update to the BEA’s economic data. These estimates incorporate the results of BEA’s annual updates to GDP and personal income by county, including revised data from 2020 to 2023. This comprehensive revision aims to improve accuracy and reflect the most complete source data available, aligning county-level figures with broader national and state-level economic accounts. The updates are particularly informed by the annual revisions to the National Income and Product Accounts (NIPA) and state-level GDP and personal income statistics released in late September 2025.
A notable methodological change for 2024 is the incorporation of Connecticut’s planning region geographic definitions, replacing its previous county-based definitions for GDP and personal income estimates. This shift means that Connecticut’s data will now be presented in a new format, and as such, it was not included in the percent change ranges for counties in this release, as these new regional definitions only became available for 2024.
Furthermore, the BEA also released new estimates of per capita personal income for 2024, calculated using U.S. Census Bureau population figures for the period of 2020 through 2024. This metric provides an average income per person within each county, offering another layer of economic insight.
Consolidation and Discontinuation of Statistical Products
In a move to streamline its reporting and provide a more integrated view of regional economies, the BEA has introduced a combined county news release for annual GDP and personal income. For the first time, these two critical economic indicators for counties are presented together, replacing two separate releases that were previously published on different days. This consolidation is intended to offer a more holistic understanding of county-level economic dynamics and reduce redundancy.
However, this consolidation comes alongside a significant discontinuation. With the release of the 2024 county statistics, the BEA has ceased the publication of statistics for metropolitan statistical areas (MSAs), micropolitan statistical areas, metropolitan divisions, combined statistical areas, and their metropolitan and nonmetropolitan components. While GDP and personal income estimates will continue to be available at the county level, this marks the end of a long-standing data series for these commonly referenced sub-state geographic entities. The BEA cites a focus on the county-level data as the primary driver for this decision, suggesting that counties provide a more granular and potentially more accurate unit of economic analysis for certain purposes. Interested parties can find further information regarding this change in the BEA’s frequently asked questions (FAQ) section.
Enhanced Data Accessibility and Presentation
In line with modern data dissemination practices, the BEA has also updated the presentation of its tables. Data previously embedded within the county news releases are now exclusively available through BEA’s Interactive Data Application. This move aims to reduce duplication and enhance efficiency by directing users to a more dynamic and flexible platform. The Interactive Data Application allows for customization of tables, access to full time series, and download options in various formats, including PDF, Excel, and CSV. While tables are no longer physically part of the news release, direct links are provided within the release to facilitate easy access to the relevant data sets, including GDP and personal income summaries with percent changes and absolute levels.
Looking Ahead: Future Releases and Data Archiving
The BEA has outlined its schedule for future releases, indicating that the 2025 GDP and personal income by county statistics will be released on December 2, 2026, at 8:30 a.m. Eastern Standard Time. Following this release, the 2024 data will be superseded. The BEA also maintains a Data Archive where historical data, including the original datasets from this release, can be accessed. This ensures that researchers and the public can refer back to specific historical estimates as needed.
The ongoing release of detailed county-level economic data by the BEA remains a critical resource for policymakers, researchers, businesses, and individuals seeking to understand the nuanced economic performance and disparities across the United States. The trends observed in 2024, with a broad increase in personal income alongside varied GDP growth, underscore the complex interplay of factors shaping local economies and the ongoing need for granular data to inform economic strategies and policies.