
 Lana Rhoades
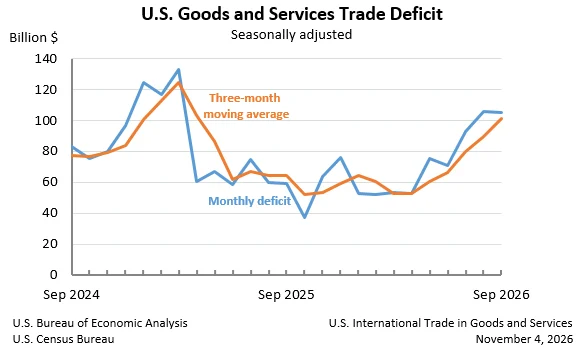
The United States recorded a goods and services deficit of $105.0 billion in September, a marginal decrease of $0.7 billion from the revised August figure of $105.7 billion, according to a joint announcement today by the U.S. Census Bureau and the U.S. Bureau of Economic Analysis. This slight contraction in the trade gap reflects a complex interplay of rising exports and imports across both goods and services sectors.
September Trade Figures Detail Shifting Global Exchange
In September, U.S. exports of goods and services totaled $321.5 billion, marking a notable increase of $5.8 billion from the previous month. This growth was driven by a $5.1 billion rise in goods exports, reaching $211.0 billion, and a $0.7 billion uptick in services exports, which climbed to $110.5 billion. The expansion in goods exports, on a Census basis, was $5.0 billion, supplemented by a $0.1 billion increase in net balance of payments adjustments.
Concurrently, U.S. imports of goods and services also saw an increase, reaching $426.6 billion in September, an advance of $5.2 billion from August. Goods imports rose by $4.4 billion to $346.9 billion. However, imports of goods on a Census basis experienced a more substantial increase of $8.0 billion, partially offset by a $3.6 billion decrease in net balance of payments adjustments. Services imports edged up by $0.8 billion to $79.7 billion.
The net effect of these movements resulted in a $0.7 billion decrease in the goods deficit, bringing it to $135.9 billion. The services surplus, meanwhile, saw a modest reduction of less than $0.1 billion, settling at $30.9 billion.
Year-to-Date Trends Indicate Robust Trade Activity
Looking at the broader picture, the cumulative goods and services deficit for the year-to-date period showed a significant decrease of $92.4 billion, or 12.2 percent, compared to the same period in 2025. This positive trend is underpinned by substantial growth in both exports and imports. Year-to-date exports surged by $297.3 billion, an 11.6 percent increase, while imports climbed by $204.9 billion, a 6.2 percent rise. This indicates a dynamic and expanding global trade environment for the United States.
Moving Averages Suggest Short-Term Volatility
Despite the year-to-date improvement, three-month moving averages paint a slightly different picture, suggesting some short-term volatility. The average goods and services deficit for the three months ending in September increased by $11.3 billion to $101.2 billion. On a year-over-year basis, this average deficit also saw an increase of $36.5 billion from the three months ending in September 2025. This divergence between monthly figures and moving averages could point to seasonal factors or temporary fluctuations influencing trade flows.
Deep Dive into Goods and Services Components
Goods Trade: The September data reveals a complex dynamic within the goods sector. While the overall goods deficit narrowed by $0.7 billion, the nominal goods deficit on a Census basis actually increased. This apparent contradiction is attributed to a balance of payments adjustment for nonmonetary gold imports. The report clarifies this by referencing a detailed explanation on how gold imports and exports are recorded in the Bureau of Economic Analysis’ International Economic Accounts.
Specifically, the real goods deficit, adjusted for price changes and expressed in 2017 dollars, saw a more pronounced increase of $3.5 billion, or 3.0 percent, in September. This compares to a smaller 2.2 percent increase in the nominal deficit, highlighting the impact of inflation or deflation on the valuation of traded goods.
Services Trade: The services sector continued its positive trajectory, with the surplus narrowing only marginally. Exports of services, including categories like travel, transport, financial services, and intellectual property, showed consistent growth. This sustained strength in services exports is a key contributor to moderating the overall trade deficit.
Country-Specific Trade Balances Reveal Key Partnerships and Challenges
The detailed breakdown of goods trade by selected countries and areas provides crucial insights into the United States’ global trade relationships. In September, the U.S. recorded trade surpluses with several key partners, including the Netherlands ($7.7 billion), South and Central America ($6.2 billion), the United Kingdom ($3.0 billion), Hong Kong ($2.5 billion), Australia ($2.1 billion), Brazil ($1.1 billion), Singapore ($0.7 billion), Saudi Arabia ($0.5 billion), and Belgium ($0.2 billion).
Conversely, significant trade deficits persisted with major economies. The largest deficit was recorded with Mexico ($28.7 billion), followed by Vietnam ($25.3 billion), Taiwan ($21.9 billion), and China ($17.9 billion). Other notable deficits include those with the European Union ($14.2 billion), South Korea ($12.2 billion), Germany ($7.9 billion), Italy ($6.3 billion), Malaysia ($5.3 billion), Japan ($4.8 billion), and India ($4.5 billion). Smaller deficits were also observed with Canada ($4.4 billion), Ireland ($3.0 billion), Switzerland ($1.3 billion), France ($1.3 billion), and Israel ($0.7 billion).
These figures underscore the ongoing importance of trade dynamics with East Asian economies and the persistent challenges in balancing trade with certain major manufacturing hubs. The trade relationships with countries like Mexico and Canada, while exhibiting deficits, are also indicative of deep integration within North American supply chains.
Contextualizing the U.S. Trade Deficit
The U.S. international trade deficit is a persistent feature of the nation’s economic landscape, reflecting a complex interplay of domestic consumption, global demand for U.S. products, and the cost of imported goods and services. Historically, the U.S. has often imported more goods than it exports, a trend influenced by factors such as a strong dollar, which makes imports cheaper for U.S. consumers and exports more expensive for foreign buyers, and higher domestic demand for a wide range of manufactured goods.
The goods deficit, in particular, has been a long-standing concern for policymakers, often linked to concerns about manufacturing job losses and the competitiveness of U.S. industries. However, the growth in services exports has increasingly offset some of this deficit, highlighting the U.S.’s competitive advantage in sectors like finance, technology, and education.
The data released today provides a snapshot of these ongoing trends. While the overall deficit saw a slight reduction in September, the underlying movements in exports and imports indicate continued global economic engagement. The year-to-date improvement suggests a potential resilience in U.S. export markets or a moderation in import growth relative to previous periods.
Implications and Expert Analysis
The September trade figures offer several points for analysis. The slight decrease in the overall deficit is a positive signal, particularly given the robust growth in both exports and imports. This suggests that U.S. businesses are finding increasing opportunities in global markets, while domestic demand for foreign goods remains strong.
The divergence between the nominal and real goods deficit, influenced by factors like gold imports, underscores the importance of looking beyond headline figures. The increase in the real goods deficit suggests that while the value of goods traded may have increased nominally, the volume or underlying price dynamics might be contributing to a wider gap in terms of real economic activity.
The persistent trade deficits with certain countries, notably China and Mexico, continue to be a focal point for trade policy discussions. These imbalances often reflect differing economic structures, trade policies, and global supply chain configurations.
Economists often view the trade deficit not in isolation but as part of a broader economic picture that includes capital flows. A trade deficit is typically financed by capital inflows, meaning that foreign investors are investing in U.S. assets. This can be seen as a sign of confidence in the U.S. economy, but persistent large deficits can also raise concerns about long-term debt accumulation and currency valuation.
"The slight narrowing of the September deficit is a welcome sign, but it’s crucial to monitor the trends in both goods and services," commented Dr. Eleanor Vance, a senior economist specializing in international trade. "The continued strength in services exports is a testament to the U.S.’s competitive edge in that sector. However, the ongoing significant deficit in goods, particularly with certain trading partners, warrants continued attention and strategic policy considerations."
The U.S. Census Bureau and the Bureau of Economic Analysis regularly provide detailed data and analysis on international trade. These reports are critical for businesses, policymakers, and researchers seeking to understand the dynamics of global commerce and their impact on the U.S. economy.
The next release of U.S. International Trade in Goods and Services data, covering October 2026, is scheduled for December 8, 2026, providing further insights into the evolving landscape of American trade.