
 Lana Rhoades
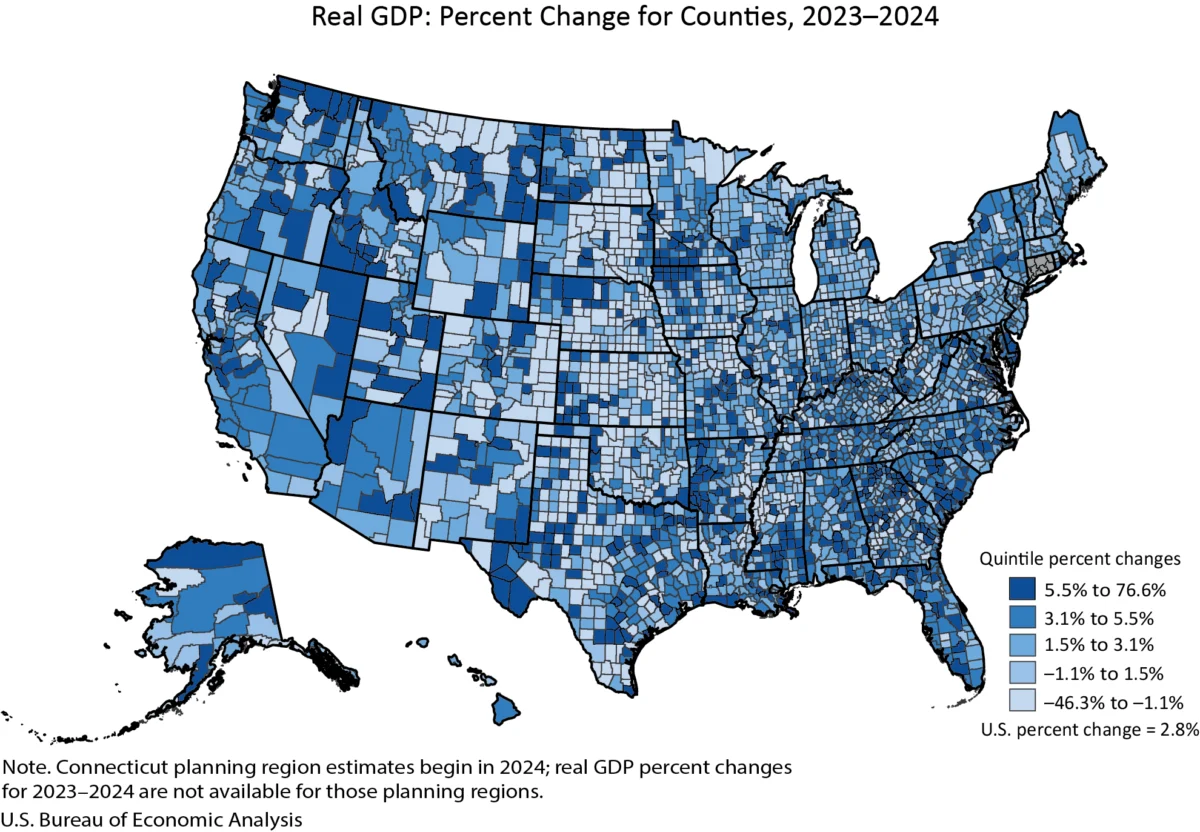
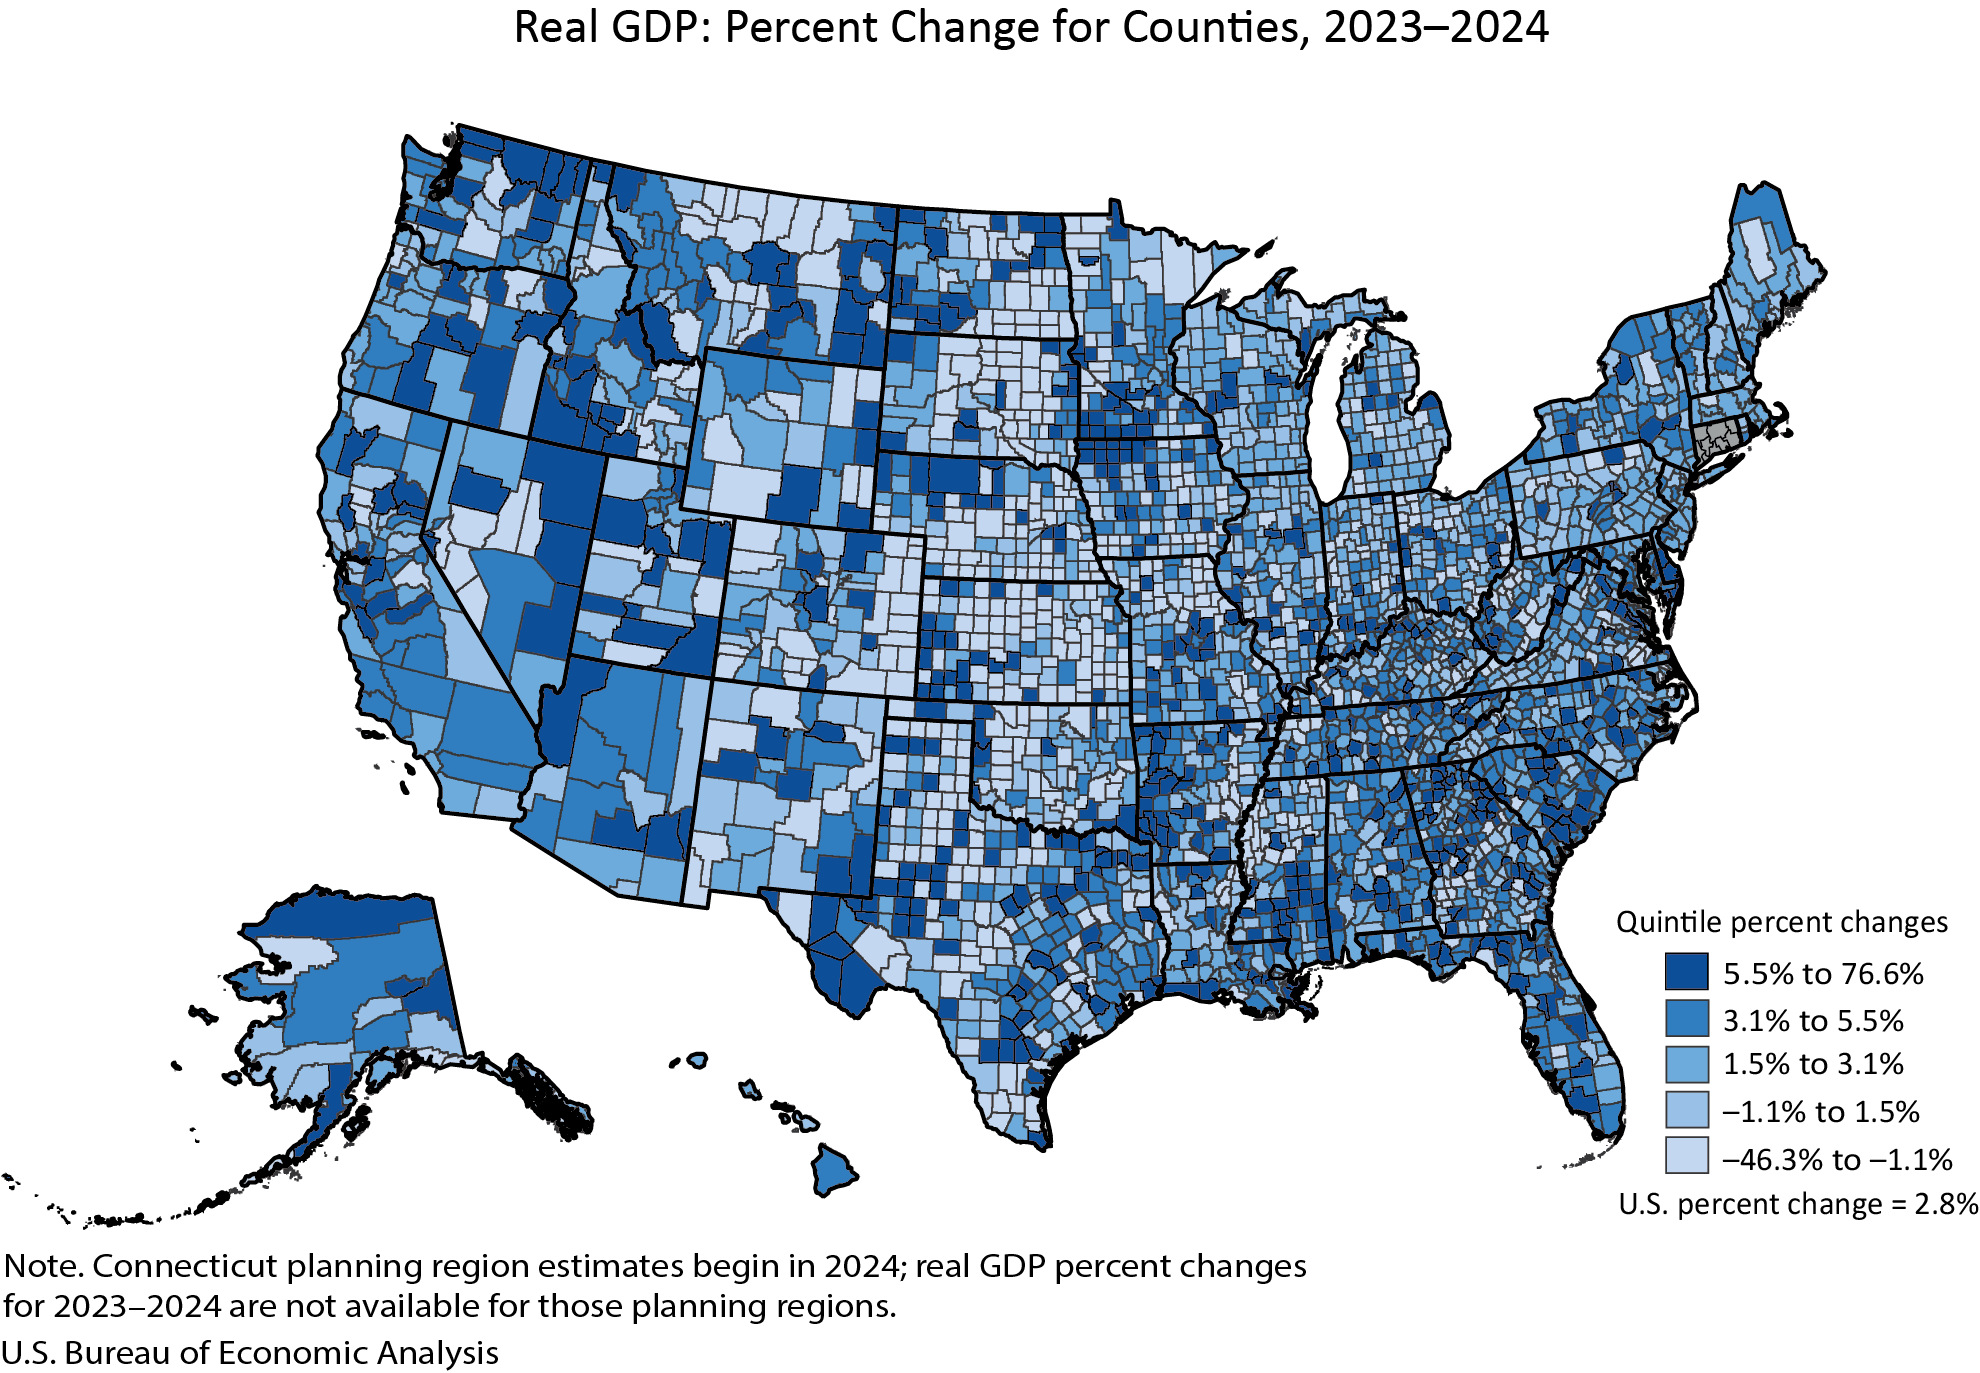
The U.S. Bureau of Economic Analysis (BEA) today released its latest estimates for real gross domestic product (GDP) and personal income at the county level, revealing a dynamic economic landscape across the nation in 2024. The data indicates that while a significant majority of counties experienced economic growth, a notable portion faced declines, highlighting regional disparities in economic performance. In total, real GDP saw an increase in 2,273 counties, a decrease in 809 counties, and remained unchanged in 24 counties. This mixed performance underscores the diverse economic conditions that characterize the American economy at its most granular level.
The magnitude of these economic shifts varied considerably. Carter County, Montana, stood out with an impressive 76.6 percent surge in real GDP, signaling robust expansion. Conversely, Baca County, Colorado, experienced a substantial downturn, with its real GDP declining by 46.3 percent. These extreme examples illustrate the wide spectrum of economic activity, from burgeoning rural areas to those facing significant challenges. The BEA’s comprehensive dataset, available through its Interactive Data Application, allows for detailed analysis of these trends, providing insights into the specific economic drivers and headwinds affecting each county.
Beyond the percentage changes, the sheer scale of county economies also presents a stark contrast. In 2024, New York County, New York, boasted the largest real GDP at an astounding $813.7 billion, underscoring its role as a global economic powerhouse. In sharp contrast, Issaquena County, Mississippi, registered the smallest real GDP at $15.7 million, reflecting its much smaller economic footprint. This vast disparity in economic size underscores the challenges and opportunities inherent in localized economic development strategies.
Key Trends in County Economic Performance
The BEA’s analysis categorizes counties by population size to provide further context for these economic trends. This segmentation reveals distinct patterns in growth and decline across large, medium, and small counties.
Large Counties (Population > 500,000)
In the category of large counties, defined as those with a population exceeding 500,000, the economic picture in 2024 was largely positive. Of the 145 large counties reporting, all experienced growth in real GDP, with none showing a decline or remaining unchanged. Pinal County, Arizona, recorded the highest growth rate within this group at 10.7 percent. The economic might of these large counties is further illustrated by their substantial GDP figures. New York County, New York, leads this category with its $813.7 billion GDP, while Pinal County, Arizona, registered a significant $12.7 billion in real GDP. These figures highlight the concentrated economic activity within major metropolitan areas and their surrounding regions.
Medium Counties (Population 100,000 to 500,000)
Medium-sized counties, with populations ranging from 100,000 to 500,000, presented a more mixed, though still predominantly positive, economic outlook. Out of 474 such counties, 451 reported growth in real GDP, while 20 experienced a decline, and 3 remained unchanged. Jefferson County, Texas, led the growth among these counties with a 12.4 percent increase in real GDP. On the downside, Black Hawk County, Iowa, saw a decline of 2.6 percent. The economic scale in this group also varies significantly, with Mercer County, New Jersey, reporting $46.6 billion in real GDP, and Liberty County, Texas, at $2.6 billion, showcasing the diversity within this population bracket.
Small Counties (Population < 100,000)
The smallest counties, those with populations under 100,000, exhibited the widest range of economic performance, both in terms of growth rates and the sheer number of counties experiencing decline. Of the 2,479 small counties analyzed, 1,677 reported GDP growth. However, a substantial 789 small counties experienced a decline in real GDP, and 20 remained unchanged. This segment of the economy is where the most extreme growth and contraction were observed, with Carter County, Montana, leading with a remarkable 76.6 percent increase, and Baca County, Colorado, facing a significant 46.3 percent decrease. The economic size within this category also spans a vast range, from Martin County, Texas, with $15.1 billion in real GDP, down to Issaquena County, Mississippi, at $15.7 million. This highlights that while many small counties are thriving, a significant number are grappling with severe economic challenges.
Personal Income Trends Mirror Economic Activity
Parallel to GDP trends, personal income at the county level also showed a predominantly positive, yet varied, picture in 2024. Personal income, a measure of income received by persons from all sources, increased in 2,768 counties, decreased in 331 counties, and remained unchanged in 7 counties. This indicates that while overall economic output (GDP) might be experiencing fluctuations, the income flowing to individuals across most counties saw an upward trend.
The range of personal income growth was also considerable. Harding County, South Dakota, recorded the highest percentage increase in personal income at 22.6 percent, suggesting strong income gains for its residents. Conversely, Issaquena County, Mississippi, faced a decline of 23.3 percent in personal income, mirroring its GDP contraction.
The total levels of personal income also reflect the economic stratification across the United States. Los Angeles County, California, reported the highest personal income at $818.5 billion, underscoring its status as a major economic hub. In stark contrast, Loving County, Texas, had the lowest personal income at $10.6 million, illustrating the vast differences in individual economic well-being across the country.
Analysis of Personal Income by Population Size
Similar to GDP, personal income trends were analyzed across different county population sizes.
Large Counties (Personal Income)
In large counties, personal income growth was robust, with 146 counties reporting increases and none reporting decreases or no change. San Joaquin County, California, experienced the highest personal income growth at 9.7 percent, while Philadelphia County, Pennsylvania, saw a growth of 2.7 percent. The total personal income in this group is substantial, with Los Angeles County, California, leading at $818.5 billion and Pinal County, Arizona, at $26.1 billion.
Medium Counties (Personal Income)
Medium-sized counties also demonstrated positive personal income trends. Out of the 474 counties in this category, 474 reported increases, indicating widespread income growth. Merced County, California, recorded the highest growth at 10.9 percent, followed by Genesee County, Michigan, at 1.6 percent. The total personal income in this segment is also significant, with Collier County, Florida, at $62.5 billion, and Floyd County, Georgia, at $4.9 billion.
Small Counties (Personal Income)
Small counties showed a mix of personal income trends. Out of 2,479 small counties, 2,148 reported income growth, 331 experienced a decline, and 7 remained unchanged. Harding County, South Dakota, led with a 22.6 percent increase, while Issaquena County, Mississippi, saw the largest decline at 23.3 percent. The economic scale varies widely, with Teton County, Wyoming, reporting $12.4 billion in personal income, and Loving County, Texas, at $10.6 million.
Methodological Updates and Changes in BEA Reporting
The BEA’s release of these 2024 estimates incorporates significant updates and methodological changes, aiming to provide more accurate and comprehensive economic data. The revisions to county-level GDP and personal income data from 2020 to 2023 reflect the integration of new and more complete source data. This aligns the county statistics with the latest national and state-level economic accounts, ensuring greater consistency across BEA’s reporting.
A notable change is the incorporation of Connecticut’s planning region geographic definitions, replacing county-level data for that state starting with the 2024 estimates. While this allows for a more localized view within Connecticut, it means these specific region-based estimates are not included in the national percent change ranges presented in the release.
Furthermore, the BEA has introduced a new combined county news release format, merging previously separate releases for GDP and personal income by county. This initiative aims to provide a more holistic view of county economies in a single, more efficient publication.
In a significant shift, the BEA has discontinued the publication of statistics for metropolitan statistical areas, micropolitan statistical areas, and related designations. While GDP and personal income will continue to be available by county, this change marks the end of an era for metropolitan area economic data from the BEA. The agency cites a focus on county-level data for its comprehensiveness and flexibility.
The presentation of data tables has also been updated. Instead of embedding tables directly within the news release, the BEA now directs users to its Interactive Data Application for more comprehensive and customizable data. This approach aims to reduce duplication and provide users with direct access to the most up-to-date and flexible data formats, including downloadable options in PDF, Excel, and CSV.
Historical Context and Future Outlook
The release of county-level economic data by the BEA has long served as a crucial tool for policymakers, researchers, and local economic developers. These statistics provide a granular understanding of economic trends, allowing for targeted interventions and strategic planning. The fluctuations observed in 2024 can be viewed against the backdrop of broader national economic conditions, including inflation rates, labor market dynamics, and global economic influences.
The significant number of counties experiencing GDP declines, particularly among smaller counties, may signal underlying vulnerabilities in certain rural and less diversified economies. Factors such as industry concentration, out-migration, and limited access to capital could be contributing to these downturns. Conversely, the widespread growth in personal income suggests that despite localized economic challenges, many individuals are experiencing improved financial well-being, possibly driven by a tight labor market or increased transfer payments.
The BEA’s commitment to updating its data and methodologies reflects the evolving nature of economic measurement. The discontinuation of metropolitan area statistics, while a significant change, highlights a strategic focus on the county as the primary unit of analysis for these specific economic indicators. This decision will likely prompt a greater reliance on other data sources for metropolitan-level economic insights.
The next release of GDP and personal income by county statistics is scheduled for December 2, 2026, covering the 2025 data. This upcoming release will supersede the 2024 data, and the historical figures will be accessible through the BEA’s Data Archive. This ongoing cycle of data collection, revision, and release is essential for tracking the long-term economic trajectory of the United States at its most fundamental geographic level. The BEA’s continuous efforts to refine its reporting and data presentation ensure that stakeholders have access to the most accurate and relevant economic intelligence to navigate the complexities of the American economy.