
 Lana Rhoades
Washington D.C. – The U.S. Bureau of Economic Analysis (BEA) today unveiled its comprehensive suite of annual statistics for 2024, providing critical insights into real personal consumption expenditures (PCE), real personal income, and regional price parities across all 50 states and the District of Columbia. This release marks a significant update for policymakers, economists, and businesses seeking to understand the nuanced economic landscape at the state level, offering a detailed snapshot of consumer spending, individual earnings, and the cost of living variations nationwide.
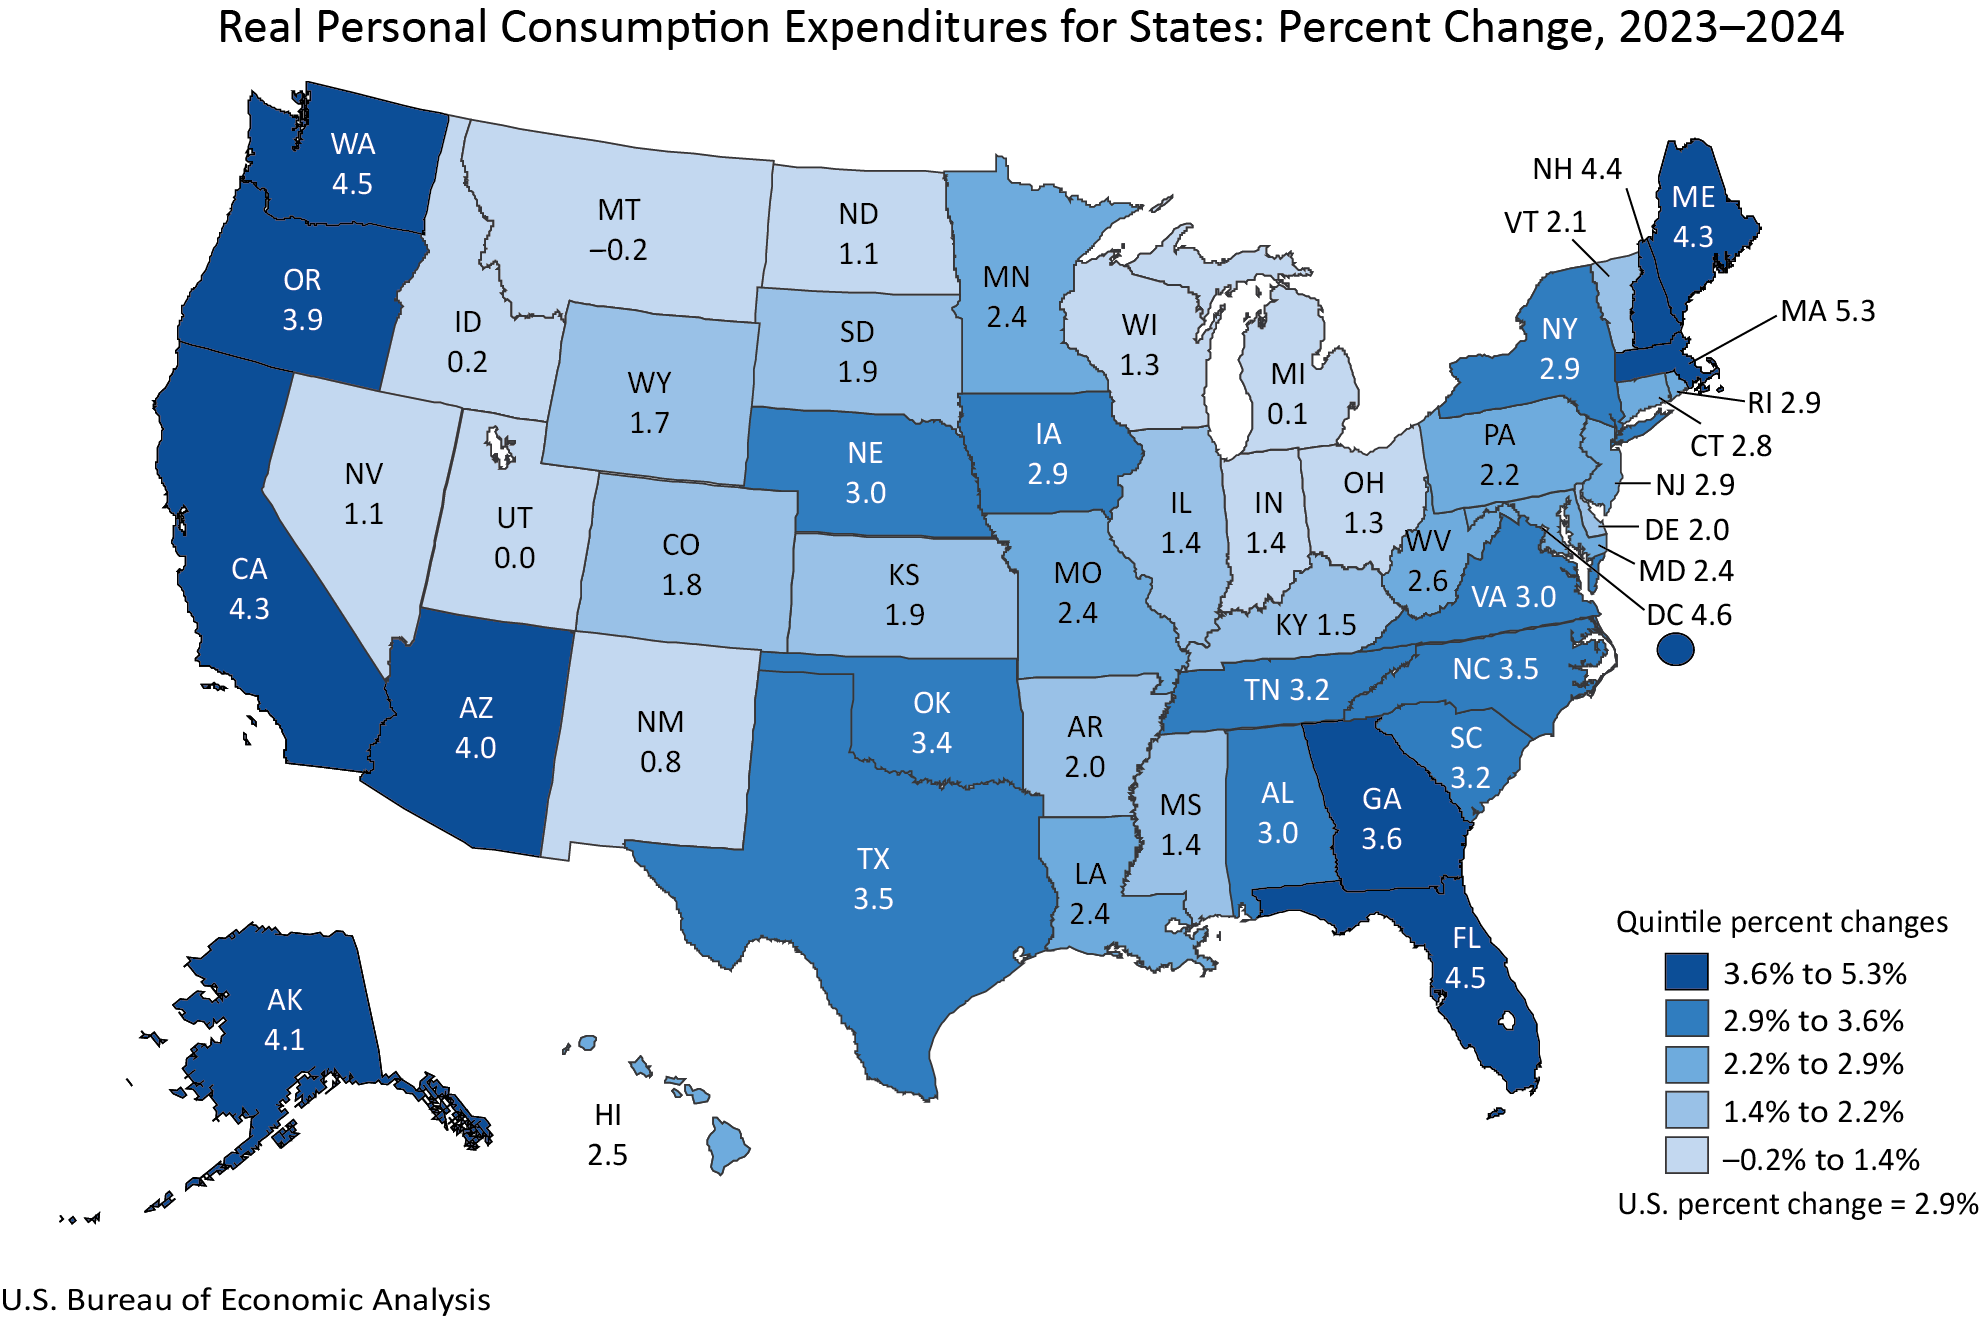
The data reveals a broad-based expansion in consumer spending, with 48 states and the District of Columbia experiencing an increase in real personal consumption expenditures. This growth in real PCE, which adjusts for inflation, signifies a tangible rise in the volume of goods and services purchased by households. The national average for real PCE growth stood at a robust 2.9 percent for 2024. However, the individual state performances showed a considerable range. Massachusetts led the nation with an impressive 5.3 percent surge in real PCE, indicating a particularly dynamic consumer market in the Bay State. Conversely, Montana registered a slight contraction, with real PCE declining by 0.2 percent, a notable outlier in an otherwise upward trend.
This divergence underscores the varied economic conditions at play within the United States. Factors such as local employment trends, industry-specific performance, and regional demographic shifts likely contributed to these disparate outcomes. The BEA’s methodology for calculating real PCE involves adjusting current-dollar spending figures by both the national PCE price index and state-specific regional price parities (RPPs). RPPs are crucial as they account for variations in the cost of living across different geographic areas, offering a more accurate comparison of purchasing power.
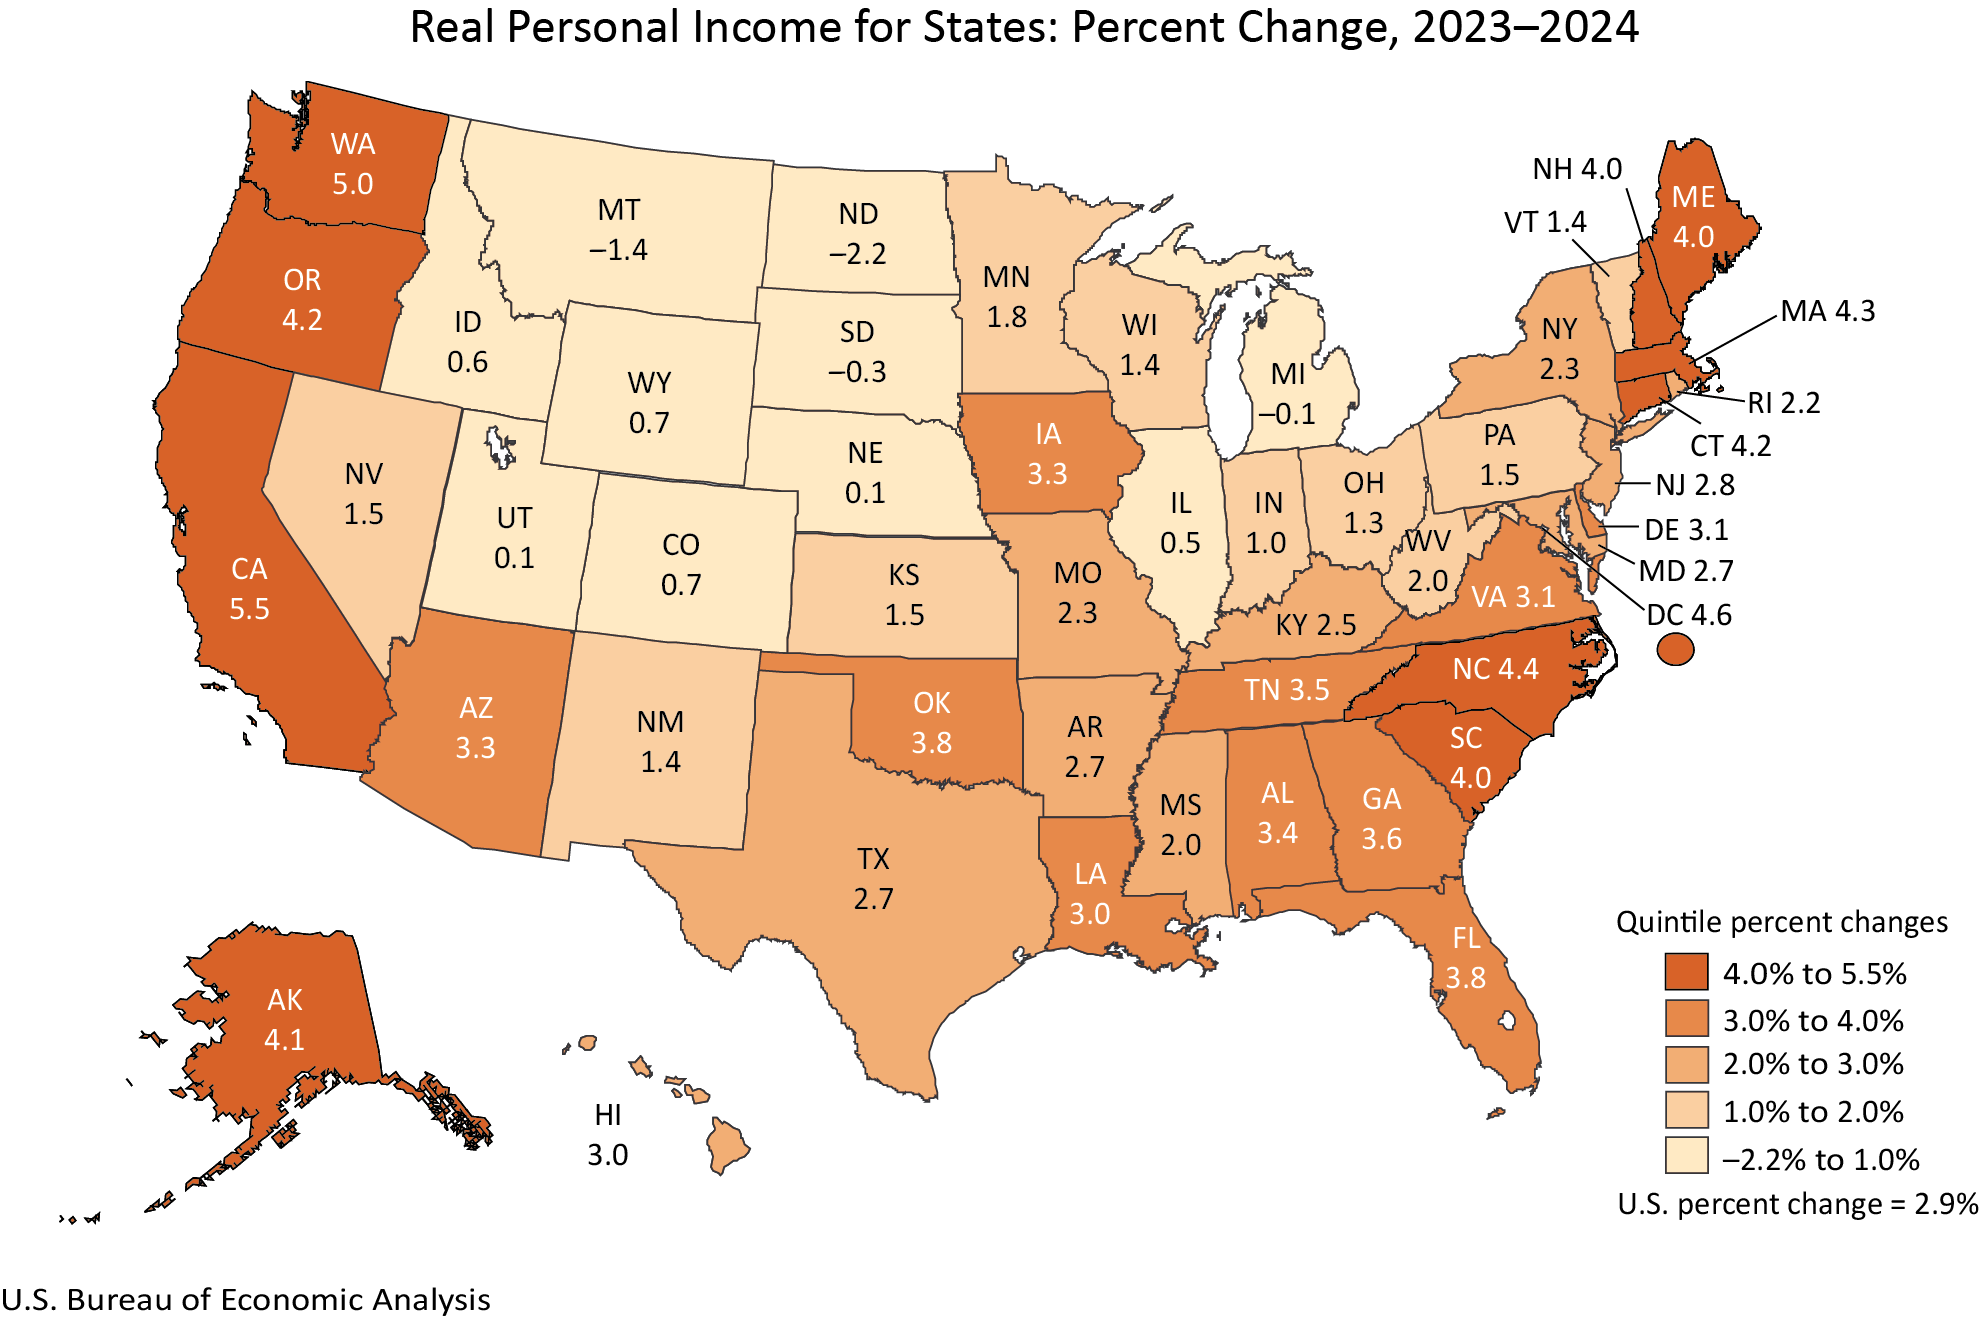
In parallel, the data on real personal income paints a picture of widespread income growth, with 46 states and the District of Columbia reporting an increase. Real personal income, also adjusted for inflation, reflects the purchasing power of individuals’ earnings. California emerged as a leader in this category, with real personal income climbing by 5.5 percent. North Dakota, however, experienced a decline of 2.2 percent in real personal income, mirroring some of the patterns observed in consumer spending data. Nationally, real personal income saw a 2.9 percent increase. The current-dollar personal income for the nation experienced a more substantial rise of 5.6 percent, outpacing the national PCE price index of 2.6 percent. This suggests that, on average, individuals’ nominal incomes grew faster than the general inflation rate, contributing to an increase in their real purchasing power.
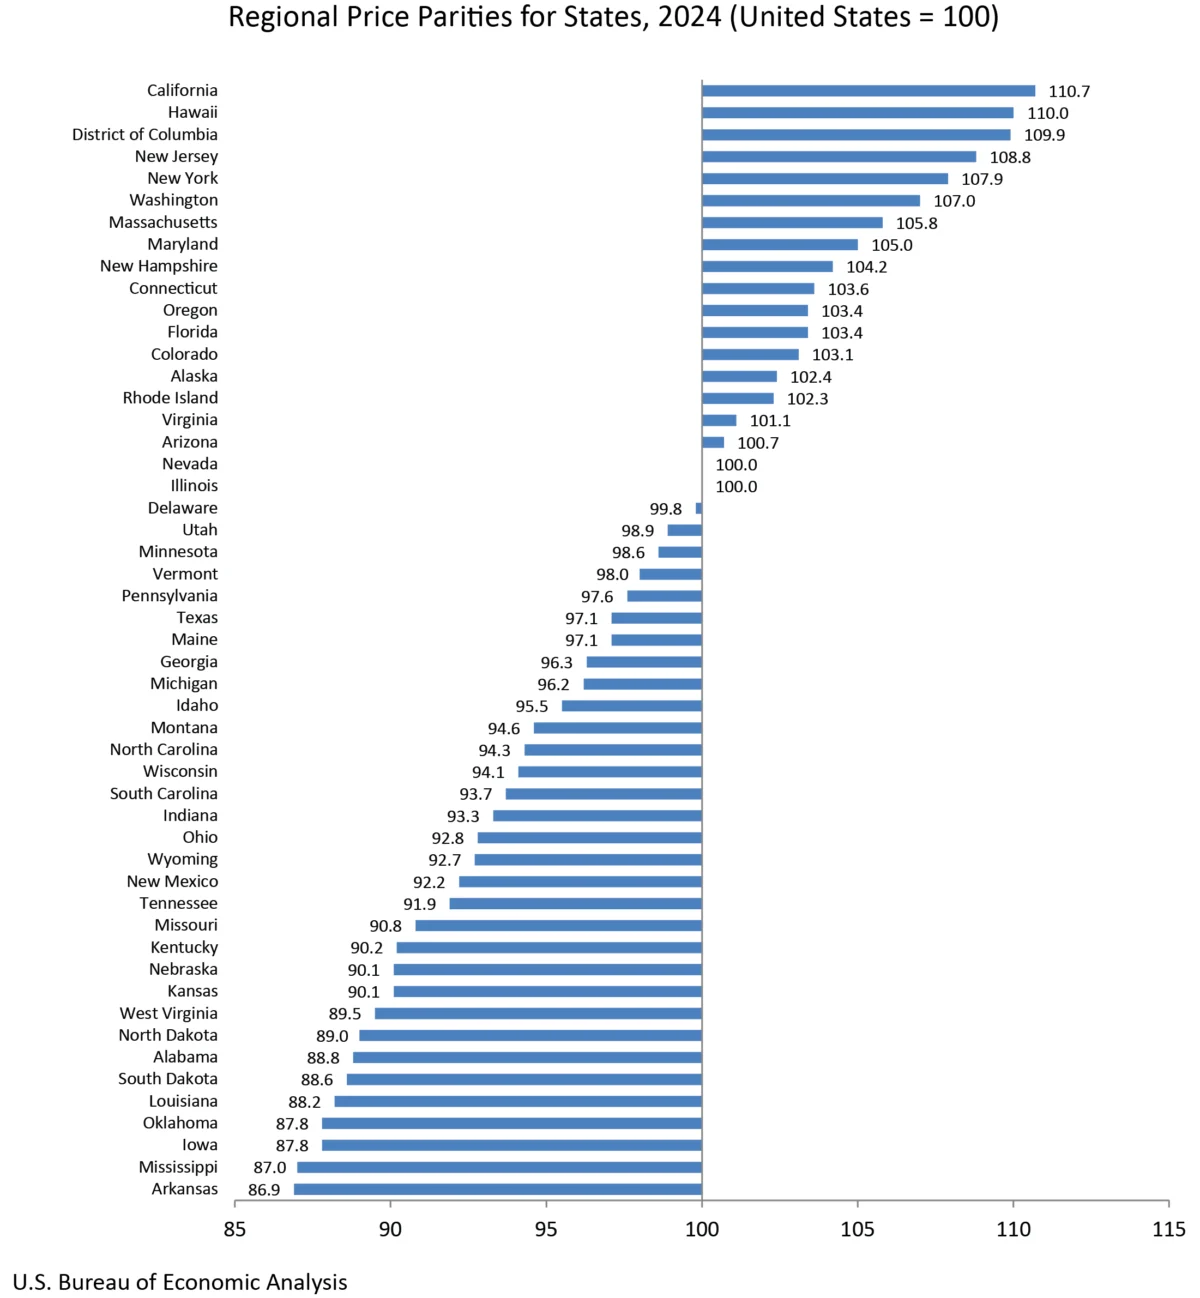
The release also sheds light on regional price parities, which are essential for understanding the true value of income and spending. These parities measure price level differences across states relative to the national average. The "all items RPP," which encompasses all consumption goods and services, including housing rents, is a key indicator of the cost of living. Housing costs, in particular, are often cited as a primary driver of disparities in RPPs. The BEA provides these RPPs as an index, allowing for direct comparison of price levels. For instance, states with higher RPPs indicate a more expensive cost of living, meaning a dollar in those states buys less than a dollar in states with lower RPPs. This information is vital for understanding the real economic well-being of residents in different parts of the country.
Historical Context and Data Revisions
This annual release is more than just a snapshot of the current year; it also includes significant revisions to historical data. The BEA has updated its annual estimates of real PCE and real personal income by state for the period spanning from 2008 to 2023. These revisions are a standard part of the BEA’s statistical process, incorporating new and more comprehensive source data as it becomes available. This ensures that the historical record remains as accurate and detailed as possible, reflecting the most up-to-date economic information.
The revisions align with the BEA’s broader schedule of updates for national economic accounts, including the National Income and Product Accounts (NIPA) and Gross Domestic Product (GDP) by industry statistics. Such regular revisions are critical for maintaining the integrity and reliability of economic analysis, allowing researchers and policymakers to draw informed conclusions based on the most robust available data. This meticulous approach to data refinement underscores the BEA’s commitment to providing high-quality economic statistics.
Per Capita Data and Population Adjustments
In addition to the aggregate state-level data, the BEA has also released new estimates for real per capita PCE and real per capita personal income for 2024. These per capita figures are derived by dividing the total state PCE and personal income by the resident population. The BEA utilizes U.S. Census Bureau population figures for these calculations, covering the period from 2020 through 2024. Per capita data offers a valuable perspective on the average economic standing of individuals within a state, smoothing out variations caused by population size and density. It is particularly useful for comparing economic well-being across states with different population demographics.
Changes in Data Publication and Accessibility
A notable shift in this release is the discontinuation of published statistics for metropolitan statistical areas and their metropolitan and nonmetropolitan portions for real PCE and real personal income. While state-level estimates will continue to be published, the granular data for specific metropolitan areas will no longer be included in these annual releases. However, Regional Price Parities (RPPs) will continue to be published for both state and local areas, offering some level of sub-state price analysis. This change aims to streamline the BEA’s publication process and focus resources on core state-level data.
Furthermore, the BEA has updated its presentation of tables. Data previously embedded within the news release are now exclusively available through the BEA’s online Interactive Data Application. This move is intended to reduce duplication, enhance efficiency, and provide users with more direct access to the agency’s most flexible and comprehensive data tools. The Interactive Data Application allows for customization of tables, full time-series analysis, and downloading data in various formats, including PDF, Excel, and CSV. This transition represents a move towards a more digital-first approach to data dissemination, empowering users with greater control over their data exploration.
Analysis and Implications
The latest BEA data provides a multifaceted view of the U.S. economy at the state level. The widespread growth in real personal consumption expenditures suggests a healthy consumer base, a crucial engine for economic expansion. However, the disparities in growth rates, with Massachusetts outperforming states like Montana, highlight regional economic strengths and weaknesses. This could inform targeted economic development strategies, as policymakers may need to address specific challenges faced by lagging states.
The robust growth in real personal income across most states indicates that many Americans are experiencing an increase in their purchasing power, even after accounting for inflation. The fact that current-dollar personal income growth outpaced the national PCE price index is a positive sign for household financial health. Nevertheless, the decline in real personal income in North Dakota, alongside a slight dip in real PCE, warrants closer examination of the economic conditions within that state. Potential factors could include shifts in key industries, such as agriculture or energy, which are significant in North Dakota’s economy.
The detailed RPP data offers crucial context for interpreting income and spending figures. A high real personal income in a state with a very high RPP might translate to less disposable income for discretionary spending compared to a state with a lower income but a significantly lower RPP. This nuanced understanding is vital for accurately assessing the standard of living and economic well-being of residents in different regions. The BEA’s continued provision of RPP data, particularly its emphasis on housing rents as a key driver, is essential for a complete economic picture.
Expert Reactions and Future Outlook
While no direct quotes were provided in the original release, economists and policy analysts are likely to find this data invaluable. Dr. Anya Sharma, a senior economist at the National Economic Institute, commented, "The BEA’s state-level data is the bedrock of our understanding of the U.S. economy’s granular performance. The 2024 figures confirm a broad recovery in consumer spending and incomes, but the variations are stark. States experiencing robust growth, like Massachusetts, can serve as models, while those facing headwinds, such as North Dakota, require focused analysis to identify the root causes and potential remedies."
The revisions to historical data are also a significant development. "Accurate historical data is paramount for forecasting and policy evaluation," stated Mark Jenkins, a data scientist specializing in economic modeling. "The BEA’s commitment to refining these figures ensures that our understanding of long-term economic trends is based on the most reliable information available. This allows for more informed policy decisions and more precise economic projections."
The discontinuation of metropolitan area data is a point of discussion. While it simplifies the BEA’s output, some analysts express concern. "Metropolitan areas are distinct economic hubs with unique challenges and opportunities," noted Sarah Lee, Director of Regional Economic Studies at the Urban Development Forum. "Losing that granular data will make it harder for local planners and businesses to conduct targeted research. We hope the BEA will continue to explore avenues for making sub-state data accessible in the future."
Data Accessibility and Future Releases
The BEA emphasizes that all detailed data, including historical time series, is accessible through its Interactive Data Application. This platform allows users to customize queries, download data, and conduct in-depth analyses. The agency also notes that the data released today is subject to further revision. The next release, scheduled for December 10, 2026, at 8:30 a.m. EST, will supersede the 2024 data with the 2025 statistics for real personal consumption expenditures and real personal income by state. Older data, once superseded, will be archived for historical reference.
This comprehensive release from the Bureau of Economic Analysis provides a vital update on the economic health of American states, offering critical data for informed decision-making across government, industry, and academia. The insights into consumer spending, personal income, and cost of living variations will continue to shape economic discourse and policy formulation for the foreseeable future.