
 Lana Rhoades
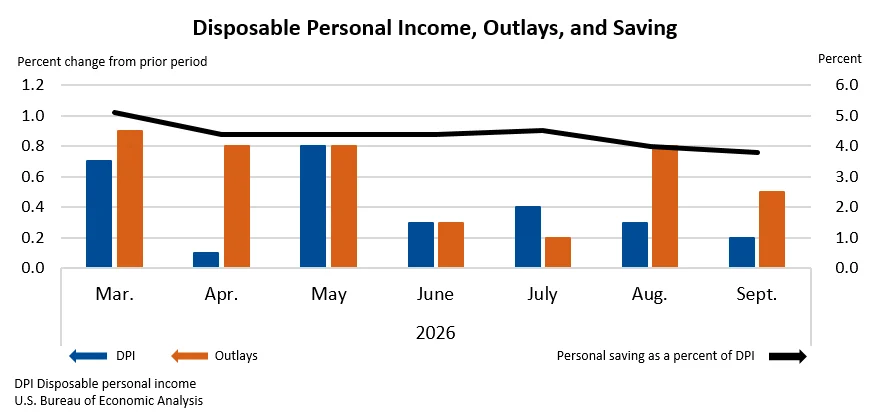
In September, the United States witnessed a notable uptick in personal income, a key indicator of economic health, with a $54.5 billion increase, representing a 0.2 percent rise on a monthly basis. This growth, as reported by the U.S. Bureau of Economic Analysis (BEA), signals a continued, albeit measured, expansion in the nation’s economic activity. Simultaneously, disposable personal income (DPI), the amount of income remaining after taxes, also experienced a similar incremental boost of $52.7 billion, or 0.2 percent. This suggests that households have a slightly larger pool of funds available for spending and saving.
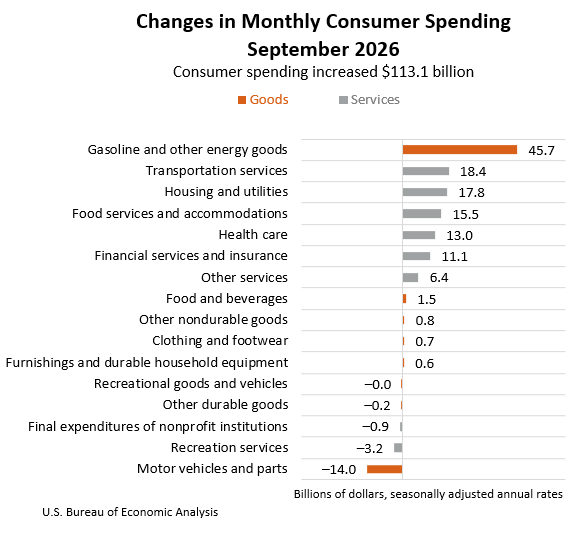
The surge in income translated directly into increased consumer activity, with personal consumption expenditures (PCE) climbing by a more substantial $113.1 billion, a 0.5 percent increase. This divergence between income growth and spending acceleration indicates a slight dip in the personal saving rate, as consumers tapped into their available funds to purchase goods and services. Personal outlays, which encompass PCE along with personal interest payments and personal current transfer payments, mirrored this trend, rising by $113.0 billion. Consequently, personal saving stood at $911.1 billion, with the personal saving rate declining to 3.8 percent of disposable personal income. This figure represents a decrease from previous months, suggesting a greater propensity for consumers to spend rather than save during this period.
The BEA’s findings also highlighted the underlying drivers of this income growth. The increase in current-dollar personal income was primarily fueled by gains in compensation, likely reflecting a combination of wage increases and potentially higher employment levels, alongside an increase in government social benefits. This dual contribution suggests a broadening of income sources supporting the overall rise.
Delving deeper into consumer spending, the $113.1 billion increase in current-dollar PCE was bifurcated between goods and services. Spending on goods saw a significant increase of $35.1 billion, while spending on services experienced a more pronounced jump of $78.1 billion. This indicates a stronger demand for services during September, a trend that could be influenced by various factors including seasonal activities, travel, and entertainment.
While nominal spending on goods and services rose, the picture for real PCE, which adjusts for inflation, presented a more tempered outlook. Real PCE increased by a mere $2.6 billion, translating to less than a 0.1 percent monthly increase. This suggests that a portion of the nominal spending growth was offset by rising prices. The inflation data further corroborates this, with the PCE price index climbing by 0.5 percent in September compared to the previous month. A more closely watched metric, the PCE price index excluding the volatile categories of food and energy, also saw an increase of 0.3 percent. This "core" inflation figure provides insight into underlying price pressures in the economy.
On an annual basis, the PCE price index showed a more significant increase of 3.6 percent year-over-year. The core PCE price index, excluding food and energy, rose by 3.1 percent from the same month in the previous year. These figures indicate that while monthly inflation moderated somewhat, broader inflationary pressures persist when viewed over a longer time horizon. This persistent inflation could pose a challenge for consumers, potentially eroding the purchasing power of their income gains if wage growth does not keep pace.
Economic Context and Historical Trends
The September data arrives amidst a complex economic landscape characterized by ongoing efforts to manage inflation, a dynamic labor market, and evolving consumer behavior. Following a period of robust post-pandemic recovery, the U.S. economy has entered a phase of adjustment, with policymakers focusing on achieving a "soft landing" – curbing inflation without triggering a significant recession. The BEA’s report on personal income and outlays provides a crucial snapshot of household financial health and spending patterns, which are fundamental drivers of economic growth.
Historically, personal income growth has been a reliable predictor of consumer spending, which accounts for a significant portion of the U.S. Gross Domestic Product (GDP). Modest increases in income, as seen in September, typically translate into sustained, though not explosive, consumer demand. However, the widening gap between nominal and real PCE growth underscores the persistent impact of inflation on household budgets. The Federal Reserve has been actively raising interest rates to combat inflation, a policy that aims to cool demand and, consequently, temper price increases. The September data will undoubtedly be scrutinized by policymakers for its implications on the effectiveness of these monetary policy measures.
The trend of increasing spending on services over goods is also a noteworthy development. This shift has been observed in various economic reports and could be attributed to several factors. As pandemic-related restrictions eased, consumers have shown a greater willingness to engage in activities such as dining out, traveling, and attending events. Furthermore, the ongoing transition towards a service-based economy means that a larger share of consumer expenditure is naturally directed towards this sector.
Revisions and Data Integrity
The BEA’s release also included revisions to estimates for July and August, reflecting updated data from the Bureau of Labor Statistics (BLS) concerning employment and wages. These revisions are a standard part of the BEA’s statistical process, ensuring that the reported figures are as accurate and comprehensive as possible. Specifically, revisions to personal interest income were influenced by newly available data from the U.S. Bureau of the Fiscal Service, indicating a meticulous approach to data collection and incorporation. Such refinements are crucial for providing a reliable foundation for economic analysis and policymaking.
Analysis of Implications
The September report offers a mixed but generally positive outlook for the U.S. economy. The increase in personal income, driven by compensation and social benefits, suggests that many households are maintaining or improving their financial standing. This provides a degree of resilience against economic headwinds. The acceleration in personal consumption expenditures, particularly in services, indicates continued consumer confidence and a willingness to spend.
However, the persistent inflation, as evidenced by the PCE price index, remains a significant concern. While real PCE growth was modest, the fact that it grew at all in the face of inflation is a testament to the underlying demand. If inflation continues to outpace income growth, consumers may be forced to curtail spending in the future, potentially slowing economic expansion. The personal saving rate, now at 3.8 percent, is a relatively low figure historically, suggesting that consumers are not building substantial savings buffers, which could limit their ability to weather future economic downturns.
From a policy perspective, the BEA’s data will inform the Federal Reserve’s decisions regarding future interest rate adjustments. The combination of moderate income growth, robust spending, and persistent inflation presents a complex scenario for monetary policymakers. They will need to carefully balance the need to control inflation with the risk of stifling economic growth.
Broader Economic Landscape and Consumer Behavior
The September personal income and outlays report is a critical piece of a larger economic puzzle. It provides insights into how households are navigating the current economic environment, characterized by a tight labor market, elevated inflation, and rising interest rates. The data suggests that consumers, while facing price pressures, are still actively participating in the economy, particularly in the services sector.
The increase in compensation as a primary driver of income growth is a positive sign for the labor market, indicating that businesses are continuing to invest in their workforce. However, the extent to which wage increases are keeping pace with inflation is a key determinant of real income growth and purchasing power. The BEA’s data on real DPI and real PCE will be crucial for assessing this balance.
The slight decline in the personal saving rate also warrants attention. While a lower saving rate can stimulate immediate economic activity, a sustained trend of low savings could have long-term implications for household financial security and the economy’s ability to absorb shocks. Experts often point to a healthy personal saving rate as a buffer against unexpected expenses and a contributor to long-term financial stability. The current rate suggests a focus on immediate consumption over future financial preparedness.
Expert Reactions and Inferences
While specific statements from related parties are not provided in the source material, economists and financial analysts closely monitor these BEA releases for insights into consumer sentiment and economic trajectory. A common inference drawn from such data is the ongoing tension between inflationary pressures and consumer demand. Analysts would likely be looking for trends that might suggest a slowdown in consumer spending due to inflation eroding purchasing power, or conversely, signs of resilience driven by a strong labor market and accumulated savings from earlier periods.
The BEA’s data on real PCE, particularly its slight increase, might be interpreted by some as a sign of underlying economic strength, indicating that consumers are still able to purchase goods and services despite rising prices. Others might focus on the decelerating rate of real PCE growth compared to nominal PCE growth as evidence of inflation’s dampening effect on the economy.
The BEA’s commitment to providing detailed data tables, such as those related to "Personal Income and Its Disposition" and "PCE by Major Type of Product," allows for in-depth analysis by researchers and policymakers. These tables provide the granular detail necessary to understand the composition of income and spending, and how different sectors of the economy are performing.
Looking Ahead
The next release of Personal Income and Outlays data, scheduled for November 25, 2026, at 8:30 a.m. EST, will cover October 2026. This subsequent report will offer further insights into whether the trends observed in September persist or evolve. Investors, policymakers, and the public will be keenly observing these releases for any indications of shifts in economic momentum, inflation dynamics, and consumer behavior. The BEA’s consistent reporting and its provision of historical data are essential for understanding the long-term economic narrative and for making informed decisions in a constantly evolving global economy. The ongoing updates and revisions to these figures underscore the dynamic nature of economic data and the BEA’s dedication to providing the most accurate picture of the U.S. economy.