
 Lana Rhoades
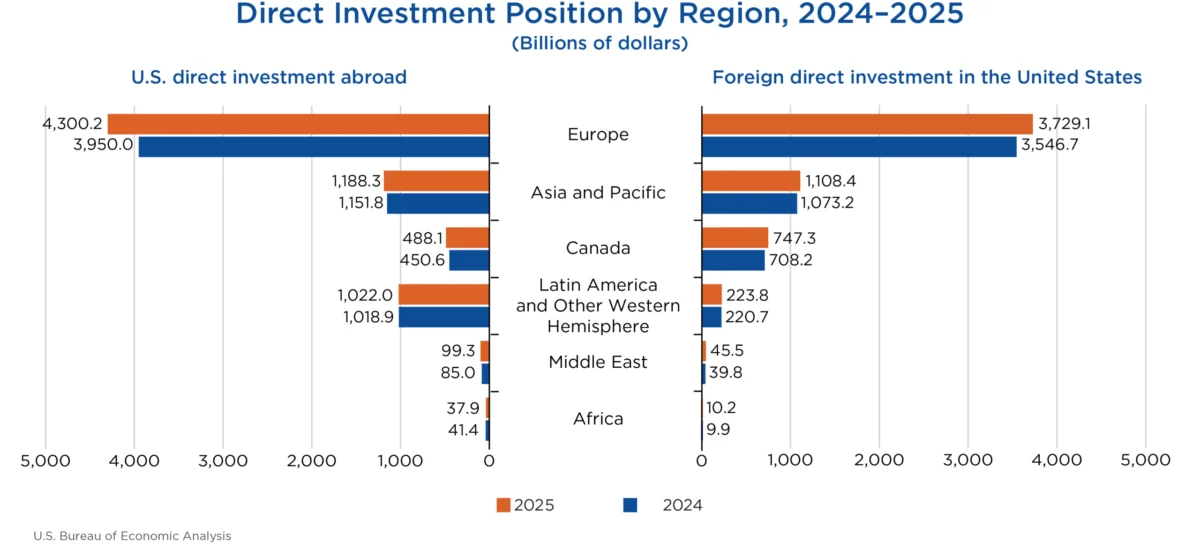
The cumulative level of U.S. direct investment abroad surged by $438.1 billion to reach a new zenith of $7.14 trillion by the close of 2025, according to the latest statistics unveiled today by the U.S. Bureau of Economic Analysis (BEA). This significant expansion was predominantly fueled by a substantial $350.2 billion increase in investments within Europe, with the United Kingdom and Luxembourg emerging as primary destinations. Concurrently, foreign direct investment (FDI) into the United States also experienced robust growth, climbing $266.0 billion to $5.86 trillion by year-end 2025, with Europe again leading the influx, followed by notable contributions from German and Canadian multinational enterprises.
These figures, released as part of the BEA’s annual review of international direct investment positions, underscore the dynamic and interconnected nature of the global economy and highlight the ongoing importance of cross-border capital flows for both U.S. and foreign economies. The data provides a critical snapshot of the economic landscape, reflecting investment strategies, industry trends, and geopolitical influences that shape international business activity.
Surge in U.S. Outward Investment Fueled by European Expansion and Manufacturing Strength
The upward trajectory of U.S. direct investment abroad in 2025 was largely propelled by a robust performance in Europe. The $350.2 billion expansion in this region signifies a renewed confidence in European markets and a strategic reallocation of capital by U.S. multinational enterprises (MNEs). While specific motivations for this surge are multifaceted, potential drivers include favorable economic conditions, strategic acquisitions, and the expansion of existing operations to meet growing consumer demand or leverage competitive advantages.
Breaking down the sectoral performance, the manufacturing industry recorded the most substantial increase in U.S. direct investment abroad. Within manufacturing, chemical manufacturing stood out as a key contributor to this growth. This suggests that U.S. chemical companies are actively expanding their global footprint, potentially through the establishment of new production facilities, the acquisition of foreign competitors, or increased investment in research and development and market penetration in overseas territories. This trend could be driven by factors such as access to raw materials, proximity to growing consumer bases, or the pursuit of specialized manufacturing expertise abroad.
The BEA’s detailed data further illuminates the concentration of U.S. direct investment abroad. In 2025, the bulk of this investment was channeled into a select group of countries. The United Kingdom remained the leading destination, with a substantial position of $1,114.7 billion. This reflects the long-standing economic ties and the U.K.’s status as a major global financial and business hub. Following closely were the Netherlands ($1,044.0 billion), Luxembourg ($645.3 billion), Ireland ($511.9 billion), and Canada ($488.1 billion). The significant investments in these jurisdictions underscore their roles as key gateways for U.S. companies operating within Europe and North America, offering strategic advantages in terms of market access, regulatory environments, and established business infrastructure.
Examining the investment by the industry of the directly owned foreign affiliate, holding companies accounted for the largest share of the overall U.S. direct investment position abroad in 2025, representing 45.8 percent. Holding companies often serve as central entities for managing a diverse portfolio of international subsidiaries, facilitating financial transactions, and optimizing tax structures. Manufacturing affiliates secured the second-largest share at 15.9 percent, reinforcing the earlier observation of robust activity in this sector. Finance and insurance affiliates followed, comprising 13.5 percent of the total investment, indicating the continued importance of financial services in supporting global business operations.
When viewed from the perspective of the U.S. parent company’s industry, manufacturing MNEs were the primary drivers of outward investment, accounting for 50.2 percent of the total position. This further solidifies the manufacturing sector’s pivotal role in the expansion of U.S. global economic engagement. MNEs in finance and insurance represented the second-largest investing group, with 15.8 percent, highlighting the critical role of financial services in facilitating and supporting international trade and investment.
Robust Inflow of Foreign Direct Investment into the U.S., Driven by European and North American Sources
The United States continues to be a highly attractive destination for foreign capital, as evidenced by the $266.0 billion increase in foreign direct investment in the U.S. in 2025, bringing the total position to $5.86 trillion. This growth underscores the enduring appeal of the U.S. market, characterized by its large consumer base, innovative ecosystem, and stable economic environment.
Europe was once again the primary source of this increased investment, contributing $182.4 billion to the overall growth. This highlights the strong transatlantic economic ties and the strategic importance of the U.S. market for European corporations. The BEA data identifies German multinationals as the largest contributors to this inflow, with an impressive $49.0 billion increase in their U.S. investment position. This surge reflects Germany’s robust industrial base and its global manufacturing prowess, with German companies likely seeking to expand their presence in the U.S. to access its vast market and advanced technological capabilities. Canadian multinationals followed as the second-largest source of new investment, with a $39.2 billion increase, underscoring the deep and integrated economic relationship between the two neighboring countries.
The manufacturing sector in the United States was the primary beneficiary of this foreign investment, experiencing the largest increase in FDI. Within manufacturing, electrical equipment and components manufacturing stood out as a particularly strong area of investment. This suggests that foreign companies are actively seeking to capitalize on the demand for advanced electronics and components within the U.S., potentially driven by the burgeoning technology sector, defense industries, or the automotive sector’s increasing reliance on sophisticated electrical systems.
Looking at the country of the foreign parent, four nations accounted for over half of the total FDI in the United States in 2025. Japan led the pack with a significant investment position of $776.3 billion, reflecting its long-standing economic partnership with the U.S. and its expertise in industries such as automotive and electronics. The Netherlands followed with $751.8 billion, underscoring its role as a key conduit for international investment into the U.S. Canada maintained its strong position with $747.3 billion, a testament to the deep economic integration between the two nations. The United Kingdom also remained a major investor, with a position of $738.3 billion.
A deeper dive into the data, considering the country of the ultimate beneficial owner (UBO), provides a more nuanced picture of global investment flows. On a UBO basis, Japan remained the top investing country with $827.1 billion, followed by Canada ($819.8 billion) and Germany ($706.2 billion). The disparity between the "country of foreign parent" and "country of UBO" for nations like the Netherlands and Luxembourg indicates that a substantial portion of investment originating from these countries is ultimately owned by entities based elsewhere. This highlights the complex structures of multinational corporations and the role of financial centers in channeling global capital.
The U.S. manufacturing sector attracted the largest share of FDI, accounting for 42.8 percent of the total position, or $2.51 trillion. Within this sector, chemical manufacturing was a significant recipient, drawing one-third of the total manufacturing FDI, amounting to $835.9 billion. This mirrors the trend observed in U.S. outward investment, suggesting a global dynamism within the chemical industry. Substantial investments were also made in the finance and insurance sector ($629.7 billion) and wholesale trade ($534.0 billion), reflecting the diverse strengths and opportunities within the U.S. economy.
Income Generation and Revisiting Historical Data
The BEA’s report also provides insights into the income generated from these direct investments. In 2025, U.S. MNEs earned $660.1 billion on their cumulative investment abroad, marking an 11.1 percent increase from the previous year. Income growth was particularly strong in holding companies, which saw an increase of $40.0 billion. Conversely, income in the finance and insurance sector experienced a decline of $6.3 billion compared to 2024, suggesting potential shifts in market conditions or investment strategies within that industry.
On the other side of the ledger, foreign MNEs earned $310.1 billion on their cumulative investments in the United States in 2025. This represents a modest 1.9 percent decrease from 2024, indicating a slight moderation in the profitability of foreign-owned assets within the U.S.
The BEA also released revised statistics for previous years, reflecting its commitment to data accuracy and incorporating newly available source data. The table indicates revisions to U.S. direct investment abroad for 2023 and 2024, as well as foreign direct investment in the United States for 2022 through 2024. These revisions are crucial for maintaining the integrity of economic analysis and providing policymakers and businesses with the most up-to-date information for strategic decision-making.
Broader Implications and Future Outlook
The robust growth in both outward and inward direct investment underscores the continued globalization of business and the interconnectedness of national economies. For the United States, the strong inflow of FDI reinforces its position as a premier destination for global capital, contributing to job creation, technological advancement, and economic growth. The strength in manufacturing FDI, both inward and outward, signals a dynamic and evolving global industrial landscape, with companies strategically positioning themselves to optimize production and market access.
The significant role of Europe as both a source and destination for direct investment highlights the enduring strength of transatlantic economic relations. The detailed country and industry data provided by the BEA is invaluable for businesses seeking to understand global investment trends, identify opportunities, and navigate the complexities of international markets.
Looking ahead, the BEA will release its next comprehensive update on Direct Investment by Country and Industry in July 2027, covering data for 2026. This forthcoming release will provide further insights into the evolving patterns of global investment and their impact on the U.S. and international economies. The BEA’s ongoing efforts to enhance its disclosure avoidance methods, including the use of coarsening techniques, aim to provide more granular data while safeguarding respondent confidentiality, a critical balance for maintaining public trust and facilitating informed economic analysis. These statistics serve as a vital barometer for understanding the health and direction of the global economy, informing policy decisions and guiding strategic investments for years to come.