
 Lana Rhoades
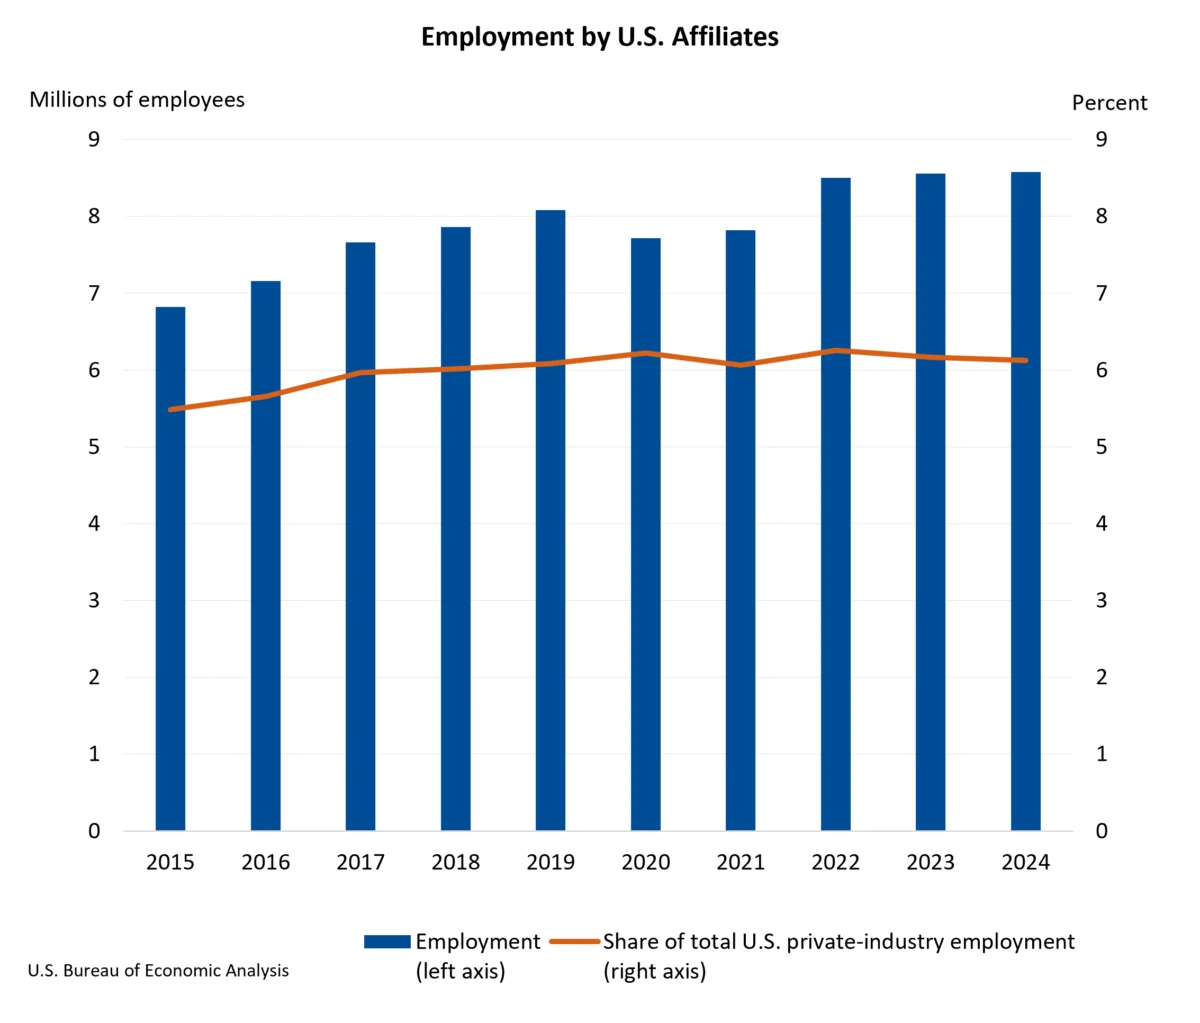
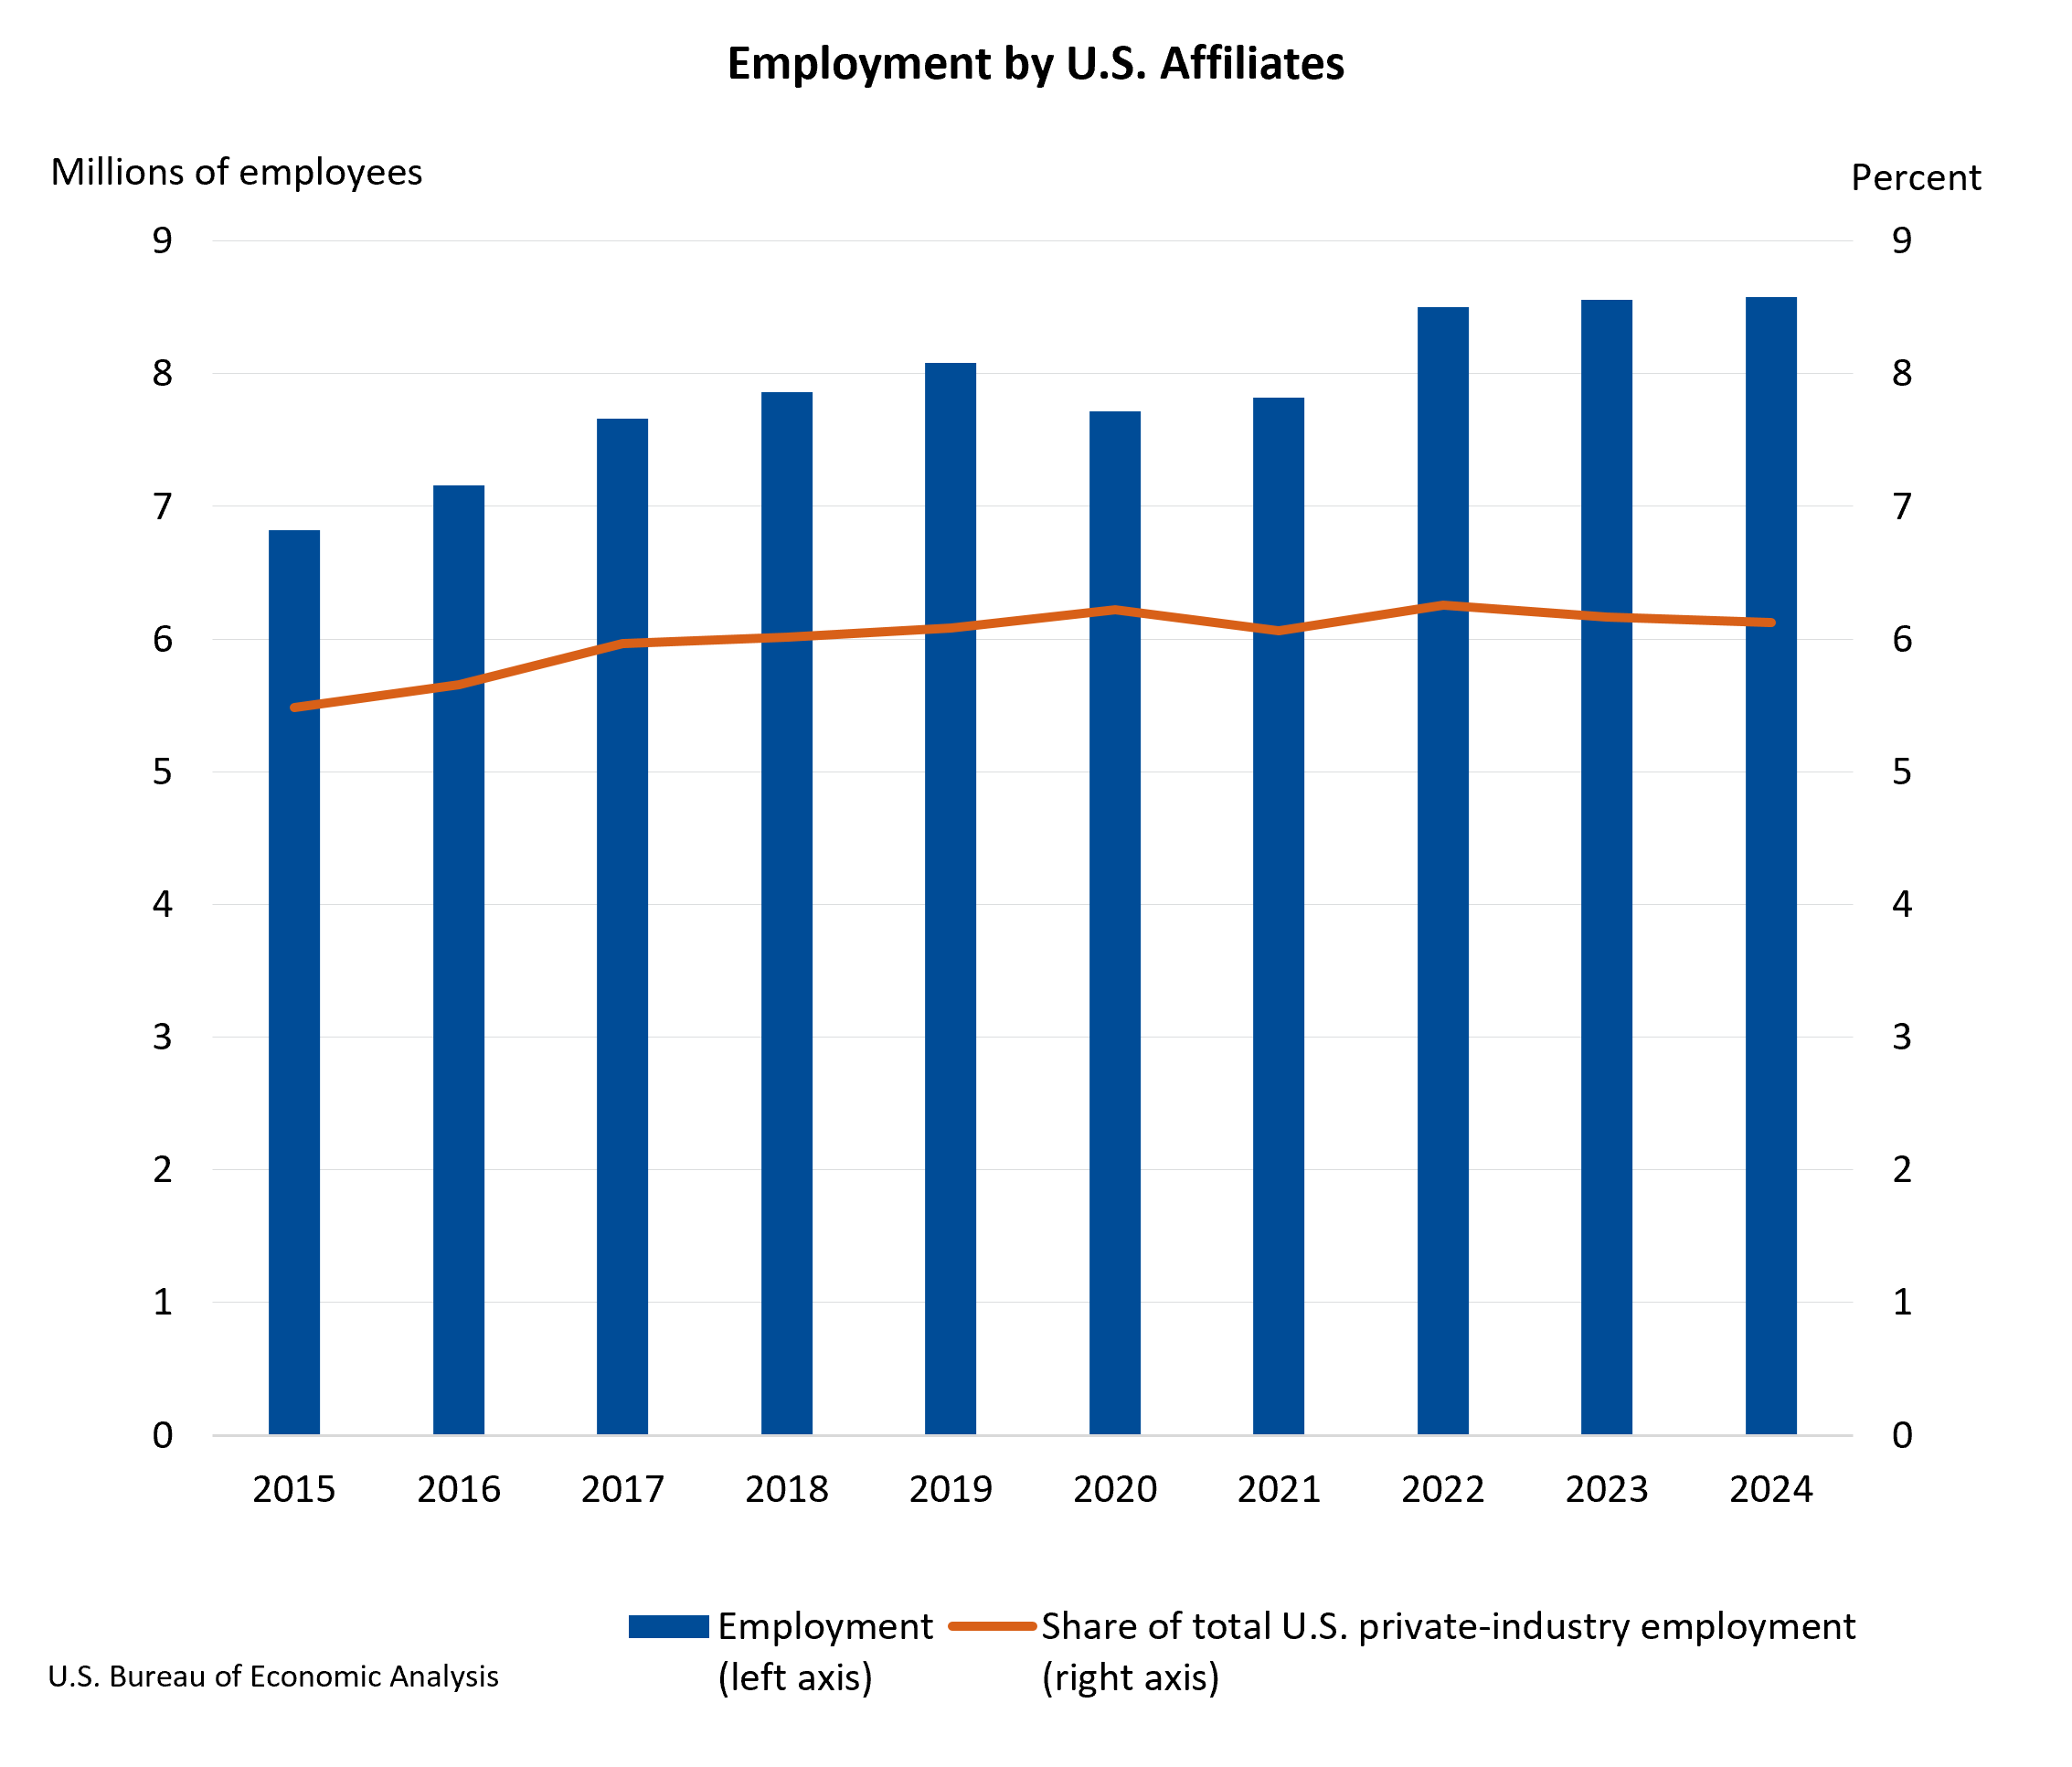
Majority-owned U.S. affiliates of foreign multinational enterprises (MNEs) provided employment for 8.57 million workers across the United States in 2024, marking a slight increase of 0.2 percent from the 8.56 million jobs recorded in 2023. This data, released by the U.S. Bureau of Economic Analysis (BEA), underscores the significant and persistent role of foreign direct investment in the American labor market. While the overall employment figure shows a modest uptick, the BEA’s comprehensive statistics reveal a more nuanced picture of foreign enterprise operations within the U.S. economy, encompassing their contributions to gross domestic product, capital expenditures, and innovation.
In 2024, these foreign-owned entities accounted for 6.1 percent of total private-industry employment in the United States. This proportion represents a slight decrease from 6.2 percent in the preceding year, suggesting that while absolute job numbers grew, the overall expansion of the U.S. private sector may have outpaced the growth of foreign affiliate employment. The manufacturing and retail trade sectors continued to be the largest employers among these U.S. affiliates, reflecting established patterns of foreign investment and operational focus. Geographically, affiliates with ultimate beneficial owners (UBOs) in the United Kingdom, Japan, and Germany were the most substantial contributors to this employment base, reinforcing the long-standing economic ties between these nations and the United States.
The economic impact of these majority-owned U.S. affiliates extends beyond employment figures. Their direct contribution to U.S. gross domestic product (GDP), measured by current-dollar value added, saw a robust increase of 4.3 percent, reaching $1.52 trillion in 2024. Despite this substantial growth in economic output, the affiliates’ share of total U.S. business-sector value added slightly declined from 6.8 percent in 2023 to 6.7 percent in 2024. This divergence between absolute value added growth and its proportion of the overall economy again suggests that the broader U.S. economy is expanding at a comparable or faster rate.
Investment in the nation’s productive capacity also saw an uptick. Expenditures for property, plant, and equipment by these affiliates rose by 3.3 percent to $328.0 billion. This increase in capital investment signals a commitment to expanding or upgrading operational facilities within the United States, which can have positive ripple effects on domestic supply chains, construction, and related industries.
Furthermore, the role of foreign-owned affiliates in driving innovation within the U.S. economy remains significant. Research and development (R&D) performed by these entities experienced a notable increase of 5.3 percent, reaching $95.5 billion. Critically, these affiliates accounted for a substantial 12.4 percent of all R&D activities conducted by U.S. businesses in 2024, highlighting their crucial role in fostering technological advancement and scientific discovery within the nation.
Geographic Distribution of Employment and Economic Activity
The distribution of employment generated by majority-owned U.S. affiliates of foreign MNEs is heavily concentrated in key economic hubs. California led the nation with 885,200 jobs provided by these affiliates, followed by Texas with 717,400 jobs, and New York with 556,700 jobs. In each of these leading states, the manufacturing sector emerged as the primary driver of employment for foreign-owned entities, underscoring the continued importance of industrial production in attracting and sustaining foreign direct investment.
The BEA’s data also provides insights into the sectoral breakdown of employment. While manufacturing and retail trade are the largest sectors, other significant areas of employment include professional, scientific, and technical services; wholesale trade; and finance and insurance. The concentration in these sectors reflects the diverse nature of foreign investment, encompassing not only production but also service-oriented industries and financial operations that support global commerce.
Evolution of U.S. Affiliate Operations: A Chronological Perspective
The statistics released by the BEA are part of an ongoing effort to track and analyze the economic footprint of foreign direct investment in the United States. The Bureau has been collecting and disseminating data on the activities of U.S. affiliates of foreign MNEs for decades, providing a vital historical perspective on the evolution of global economic integration. The current data for 2024 builds upon preliminary estimates and incorporates revised source data from various reporting agencies and surveys.
A crucial aspect of the BEA’s reporting is the regular updating of historical data. The statistics for 2023, for instance, have undergone revisions to incorporate newly available and revised source data. These revisions, which were released in December 2025 as preliminary estimates, provide a more accurate picture of the economic activities of foreign affiliates in the previous year. For example, the number of employees in 2023 was initially estimated at 8,661.8 thousand but was revised to 8,556.9 thousand. Similarly, value added for 2023 was revised from a preliminary $1,469.1 billion to $1,456.3 billion. These adjustments are standard practice in statistical reporting and are essential for maintaining data integrity and comparability over time.
Key Investment Trends and Drivers
The consistent increase in expenditures for property, plant, and equipment by U.S. affiliates of foreign MNEs signals a strategic commitment to long-term growth and operational enhancement. This investment is often driven by a combination of factors, including access to the large and dynamic U.S. consumer market, the availability of a skilled workforce, favorable regulatory environments, and opportunities for technological advancement. For instance, a Japanese automotive manufacturer might invest in expanding its assembly plant in the U.S. to meet rising demand for its vehicles, creating jobs in manufacturing, logistics, and management. Similarly, a European pharmaceutical company might increase its R&D spending in the U.S. to leverage the country’s robust scientific infrastructure and talent pool.
The significant R&D expenditures by these affiliates are particularly noteworthy. In an era of rapid technological change, foreign MNEs often view the U.S. as a prime location for cutting-edge research and development. This can be due to the presence of leading universities, specialized research institutions, a vibrant venture capital ecosystem, and a culture that encourages innovation. The BEA’s data confirms that these affiliates are not merely operational arms but are actively contributing to the intellectual capital and technological frontier of the United States.
Top Contributor Nations and Their Economic Influence
The United Kingdom, Japan, and Germany have historically been, and continue to be, the leading sources of foreign direct investment into the United States. The majority-owned U.S. affiliates of companies from these nations collectively employ millions of Americans and contribute significantly to the nation’s GDP.
- United Kingdom: U.K. companies have a deep-rooted presence in the U.S. economy, with substantial investments across various sectors, including finance, manufacturing, and professional services. Their U.S. affiliates often serve as crucial hubs for their global operations.
- Japan: Japanese investment in the U.S. is particularly prominent in the automotive industry, but also extends to electronics, machinery, and retail. Japanese affiliates have been instrumental in shaping manufacturing landscapes and supply chains in many American states.
- Germany: German MNEs are major players in the U.S., especially in the automotive, chemical, and machinery sectors. Their commitment to advanced manufacturing and engineering has a tangible impact on U.S. industrial output and employment.
The sustained presence and investment from these countries highlight the enduring attractiveness of the U.S. market for global businesses. These relationships are not static; they evolve with global economic trends, trade policies, and technological advancements, necessitating continuous monitoring and analysis by organizations like the BEA.
Broader Economic Implications and Analysis
The performance of majority-owned U.S. affiliates of foreign MNEs offers several key insights into the health and direction of the U.S. economy. The modest employment growth, while positive, suggests that the U.S. economy is in a phase of steady, rather than explosive, expansion. The slight decrease in the share of total private-industry employment indicates that domestic companies are also growing and hiring, maintaining a strong competitive presence.
The consistent growth in value added and capital expenditures points to ongoing productivity gains and a commitment to reinvestment by foreign-owned businesses. This is critical for long-term economic prosperity, as it contributes to a larger economic pie and potentially higher wages and job security. The substantial contribution to R&D underscores the U.S.’s position as a global leader in innovation, a status bolstered by the active participation of foreign entities.
However, the BEA’s data also serves as a reminder of the interconnectedness of the global economy. Fluctuations in international trade, geopolitical stability, and the economic performance of major trading partners can all influence the investment decisions and operational outcomes of these U.S. affiliates. Policymakers and business leaders alike must consider these global dynamics when formulating strategies for economic growth and competitiveness.
Future Outlook and Data Availability
The BEA continues to refine its data collection and reporting methods to provide the most accurate and comprehensive picture of U.S. affiliate operations. Recent updates include modifications to disclosure avoidance methods, employing techniques like rounding and aggregation to protect the confidentiality of survey respondents while allowing for the publication of more detailed data.
Looking ahead, the BEA’s schedule anticipates the next release of statistics on the activities of U.S. affiliates of foreign MNEs in the Spring of 2027, focusing on 2025 data. This forward-looking release will provide further insights into evolving employment trends, investment patterns, and economic contributions. The BEA’s website remains a vital resource for anyone seeking in-depth information, offering access to comprehensive data tables that detail sales, balance sheets, income statements, compensation of employees, trade figures, and much more, broken down by industry, country, and state. This wealth of data allows for granular analysis and a deeper understanding of the multifaceted impact of foreign direct investment on the U.S. economy. The ongoing collection and dissemination of this information are crucial for informed decision-making by businesses, policymakers, and researchers alike, ensuring a clear view of the dynamic relationship between foreign investment and American economic prosperity.