Lana Rhoades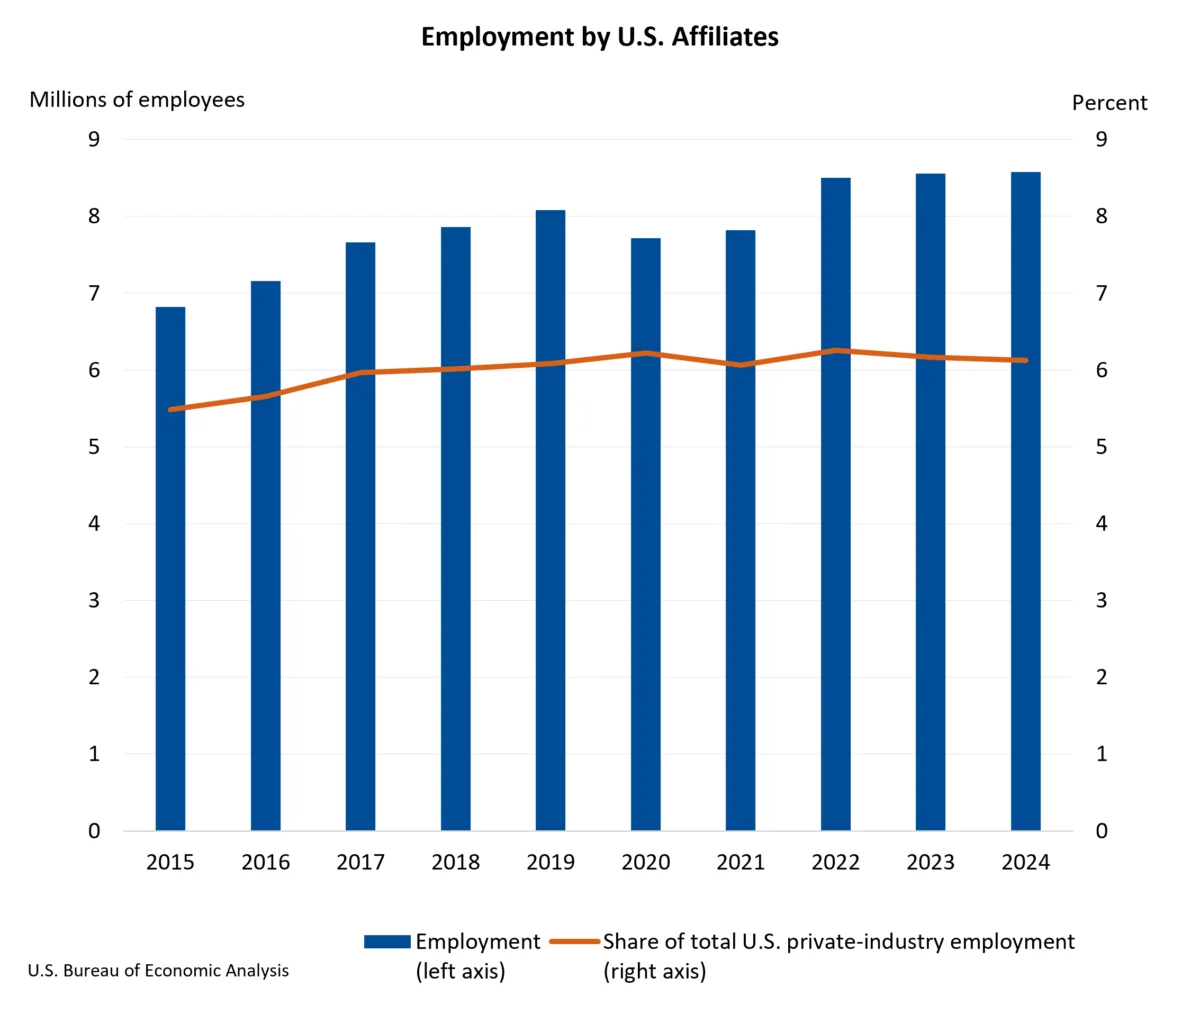
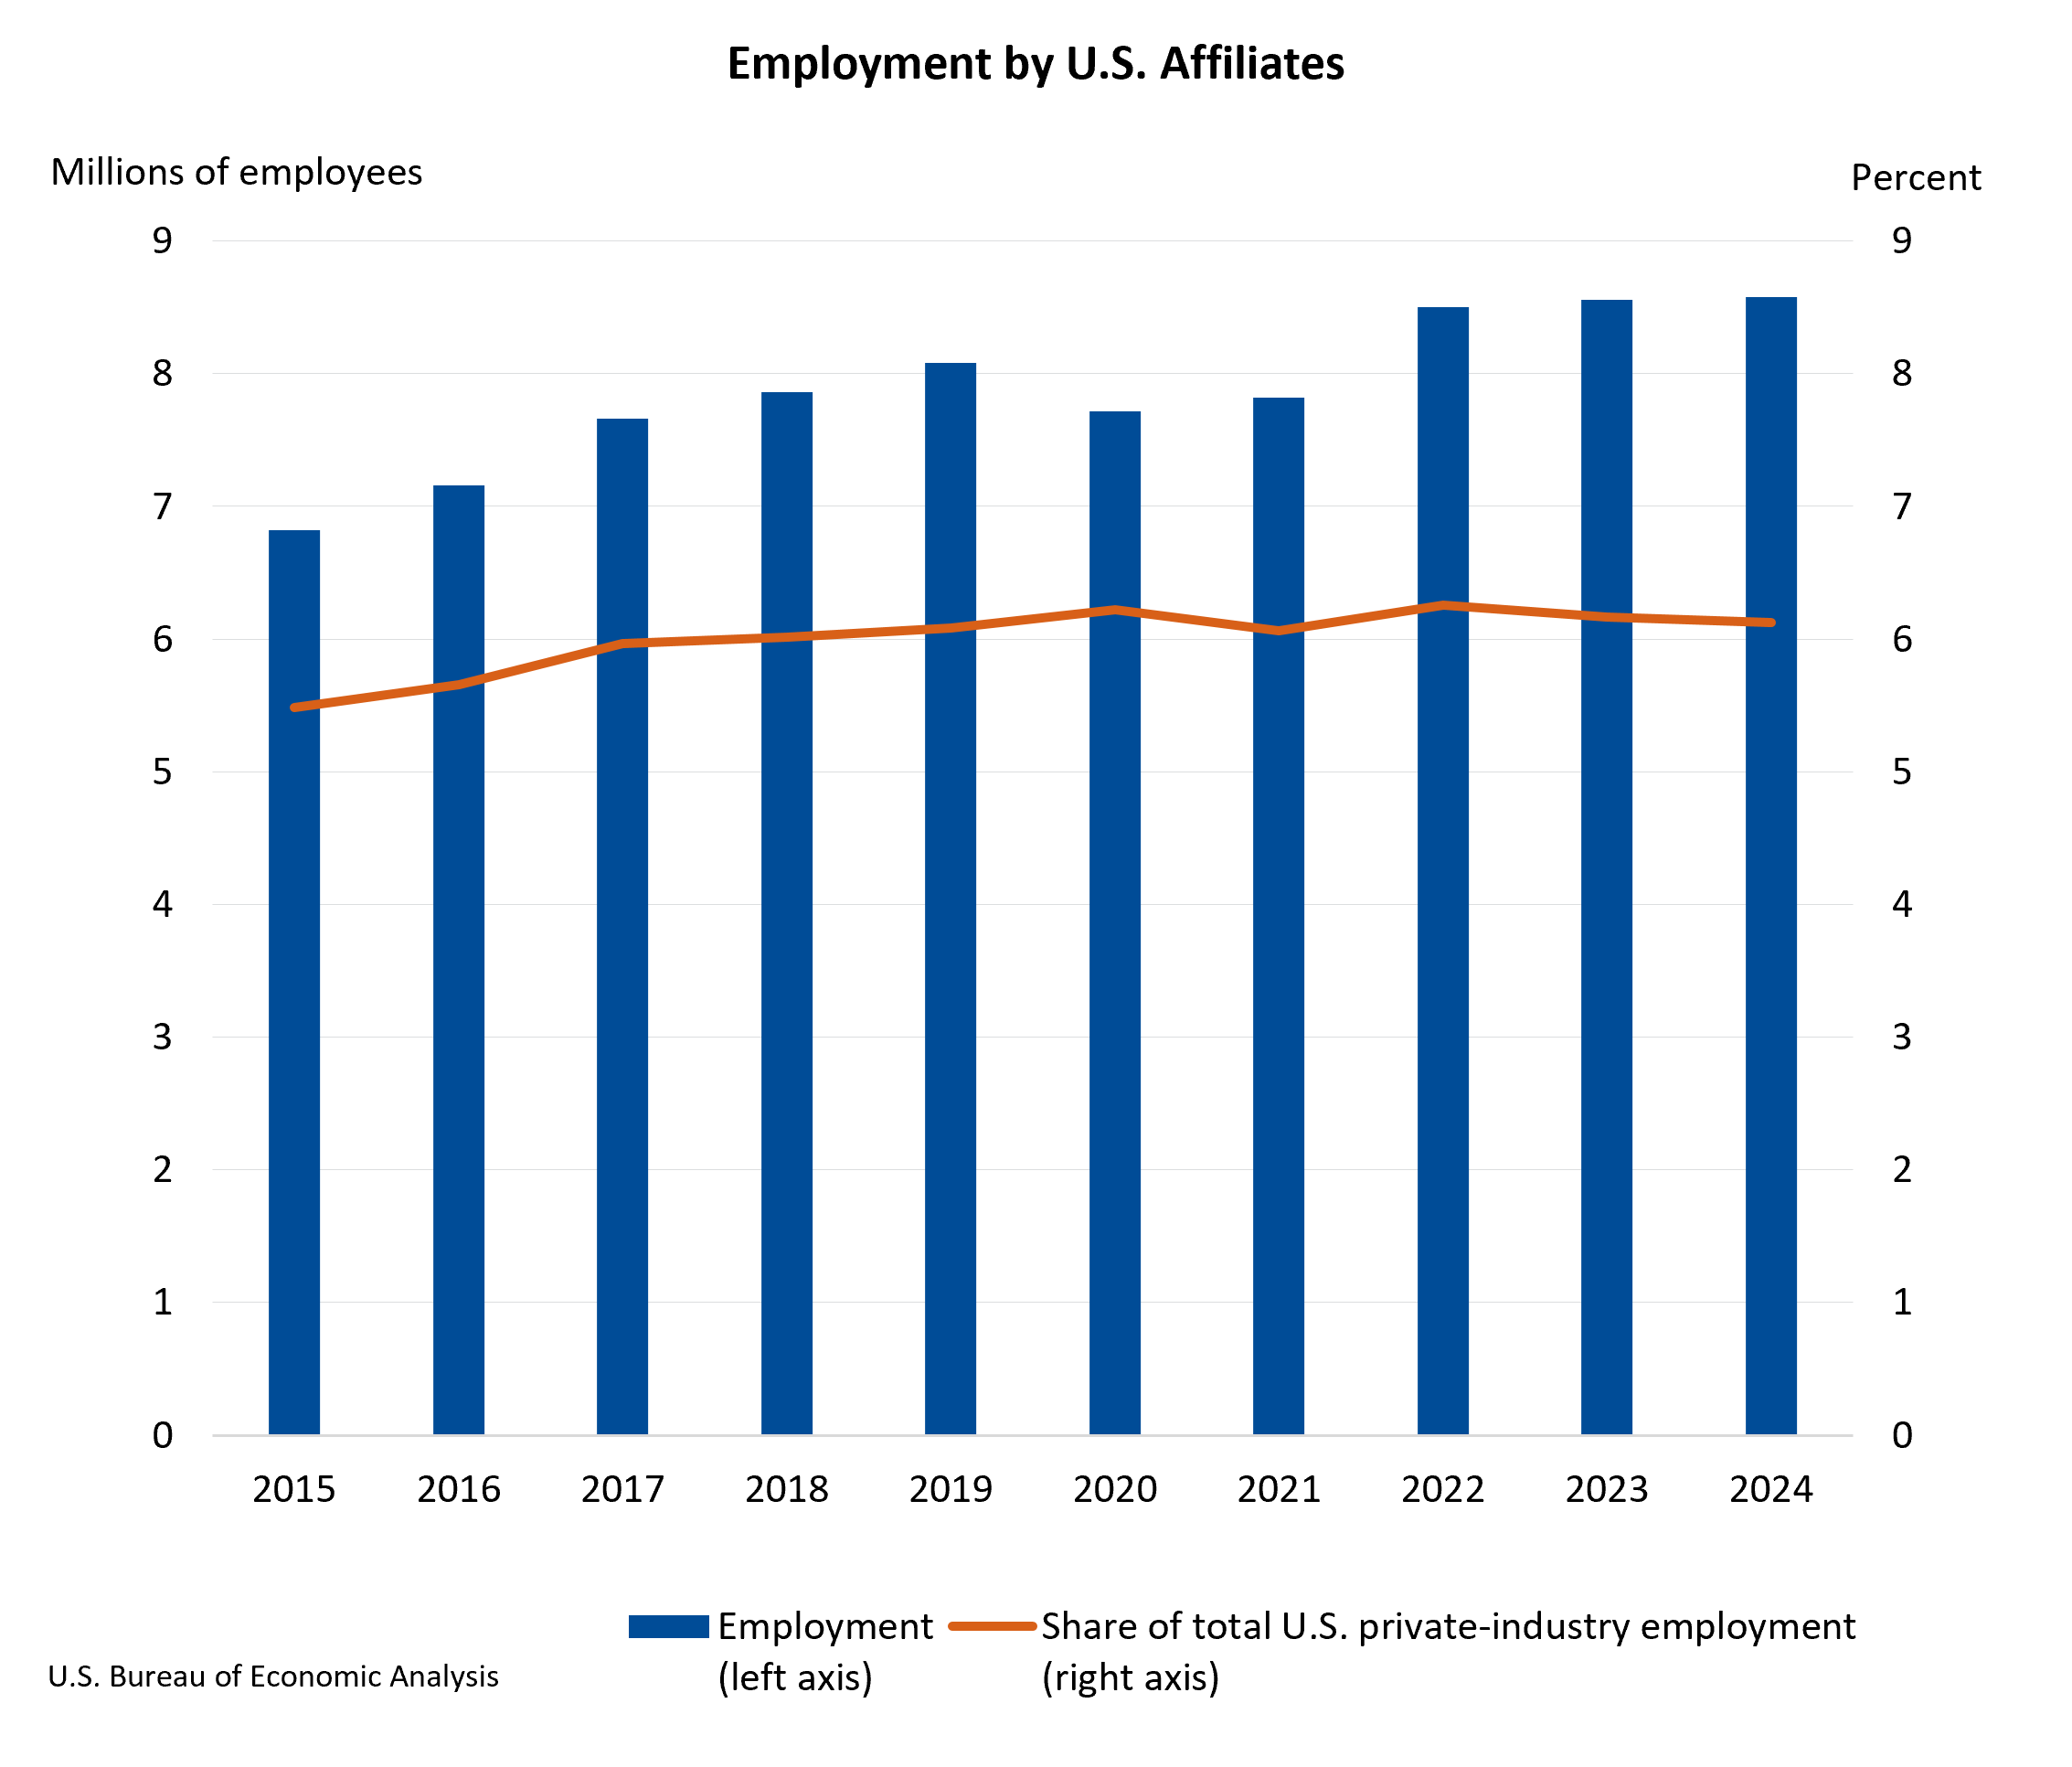
Majority-owned U.S. affiliates of foreign multinational enterprises (MNEs) provided employment for 8.57 million individuals across the United States in 2024, marking a slight increase of 0.2 percent from the 8.56 million workers recorded in the previous year. This data, released by the U.S. Bureau of Economic Analysis (BEA), offers a snapshot of the significant role foreign direct investment plays in the American labor market. While the overall employment figure saw a modest uptick, the share of total private-industry employment attributed to these affiliates slightly dipped to 6.1 percent in 2024, down from 6.2 percent in 2023, indicating a broader expansion within the U.S. economy that outpaced the growth of foreign-owned enterprises’ workforce.
The manufacturing and retail trade sectors continued to be the primary engines of employment for these U.S. affiliates. These sectors have historically been significant recipients of foreign direct investment due to their large consumer bases, established infrastructure, and skilled workforces. The United Kingdom, Japan, and Germany emerged as the leading countries of ultimate beneficial ownership (UBO) for the largest contributing affiliates to U.S. employment. This sustained dominance underscores the long-standing and robust economic ties between the United States and these major global economies.
Beyond employment figures, the BEA’s report highlights the substantial economic contribution of these foreign-owned entities. The current-dollar value added by U.S. affiliates, a key metric reflecting their direct impact on the U.S. gross domestic product (GDP), surged by 4.3 percent to $1.52 trillion in 2024. This growth rate outpaced the increase in employment, suggesting enhanced productivity and value creation within these firms. Collectively, these affiliates accounted for 6.7 percent of the total U.S. business-sector value added, a figure that, similar to employment, saw a marginal decrease from 6.8 percent in 2023. This slight dilution in percentage terms again points to a broader, robust expansion of the overall U.S. economy.
Investment in the future of their U.S. operations also saw an upward trend. Expenditures for property, plant, and equipment by U.S. affiliates rose by 3.3 percent, reaching $328.0 billion. This increase signals continued commitment from foreign MNEs to their physical infrastructure and operational capacity within the United States. Furthermore, investment in innovation and future growth was evident in research and development (R&D) expenditures, which climbed by 5.3 percent to $95.5 billion. This substantial investment means these affiliates are responsible for a significant portion of the nation’s R&D activities, accounting for 12.4 percent of total U.S. business R&D in 2024. This underscores the vital role foreign-owned companies play in driving technological advancement and innovation within the American economy.
Geographically, U.S. affiliate employment was concentrated in key economic hubs. California led the nation with 885,200 jobs provided by these entities, followed by Texas with 717,400, and New York with 556,700. In all three of these leading states, the manufacturing sector was the largest employer among U.S. affiliates, reflecting the sector’s continued importance in job creation, even as the U.S. economy diversifies. The visual representation of this data, often depicted in charts and graphs, typically shows a clear clustering of employment in these major economic centers, with a more diffuse distribution across other states.
A Deeper Dive into the BEA’s Findings
The statistics released by the Bureau of Economic Analysis are the result of a comprehensive survey that tracks the activities of U.S. businesses in which foreign persons or enterprises have a direct or indirect ownership interest of 10 percent or more. The data presented focuses specifically on "majority-owned" affiliates, meaning those where foreign ownership exceeds 50 percent. These figures are crucial for understanding the impact of foreign direct investment (FDI) on various facets of the U.S. economy, including employment, output, trade, and R&D.
The BEA regularly updates these statistics to reflect the most current and accurate data available. For instance, the report notes revisions to the 2023 data, incorporating newly available and revised source data. Preliminary estimates for 2023, initially released in December 2025, have been refined. These revisions show a slight adjustment in the number of employees, with the revised estimate for 2023 now at 8,556.9 thousand, compared to the preliminary estimate of 8,661.8 thousand. Value added also saw a downward revision, from $1,469.1 billion to $1,456.3 billion. Similarly, expenditures for property, plant, and equipment were revised down from $322.7 billion to $317.6 billion. Conversely, R&D expenditures saw an upward revision, from $87.8 billion to $90.6 billion, indicating that initial estimates may have understated the level of innovation investment. These revisions are standard practice in statistical reporting, aiming to provide the most accurate picture of economic activity.
Historical Context and Trends
The presence of foreign multinational enterprises in the U.S. economy is not a new phenomenon. For decades, the U.S. has been a prime destination for FDI due to its large, affluent consumer market, stable legal and political environment, and access to skilled labor and capital. Historically, FDI has played a critical role in bolstering U.S. economic growth, creating jobs, and introducing new technologies and management practices.
The BEA’s data provides a consistent time series that allows for the analysis of trends. While the 2024 figures show modest employment growth, the slight decrease in the percentage of total private-industry employment suggests that domestic companies have also been expanding their workforces, possibly at a faster rate in some instances. The BEA’s comprehensive data tables offer a deeper look into these trends, allowing analysts to examine sector-specific growth, country-of-origin contributions, and regional economic impacts over time. This historical perspective is vital for understanding the dynamic nature of FDI and its evolving role in the U.S. economy.
Economic Implications and Analysis
The continued growth in value added and R&D expenditures by U.S. affiliates of foreign MNEs is a positive indicator for the U.S. economy. It suggests that foreign companies are not only maintaining their presence but are also investing in productivity improvements and future innovation. This can lead to higher wages, the development of new products and services, and increased competitiveness for the U.S. as a global economic player.
The significant R&D investment, in particular, highlights the strategic importance of the U.S. as a hub for innovation. Foreign firms often establish R&D centers in countries that offer access to top talent, cutting-edge research institutions, and a supportive ecosystem for technological development. The BEA’s data reinforces the notion that the U.S. continues to be a highly attractive location for such investments.
However, the slight decline in the percentage of overall private-industry employment and value added warrants attention. While not necessarily indicative of a negative trend, it suggests that the U.S. economy is experiencing broad-based growth, with domestic industries also expanding their operations and workforces. It is crucial to monitor these percentages in future reports to discern whether this is a short-term fluctuation or a longer-term shift in the relative contributions of foreign-owned versus domestically-owned enterprises.
Broader Impact and Future Outlook
The data on U.S. affiliates of foreign MNEs is a critical component of understanding the interconnectedness of the global economy and its impact on domestic markets. These companies are not merely subsidiaries; they are integral parts of the U.S. economic fabric, contributing to innovation, employment, and GDP. Their performance is often influenced by global economic conditions, trade policies, and the investment climate in the United States.
The BEA’s commitment to providing detailed data, including information on sales, balance sheets, income statements, compensation of employees, and trade, allows for a multifaceted analysis of these entities. The availability of industry- and country-level details further enables policymakers and businesses to make informed decisions.
Looking ahead, the next release, scheduled for Spring 2027, will cover the activities of U.S. affiliates of foreign MNEs for 2025. This future data will be crucial for identifying emerging trends, assessing the impact of any new economic policies or global events, and understanding the continued evolution of foreign direct investment in the United States. The BEA’s ongoing efforts to refine its data collection and reporting methods, including the update to its disclosure avoidance method to enhance data publication while maintaining confidentiality, are essential for ensuring the continued reliability and utility of these vital economic statistics. The modifications to certain tables, such as II.A 4, II.A 5, II.A 9, II.C 14, and II.G 16, reflect the BEA’s commitment to providing the most relevant and accessible data to the public. The consistent reporting of these figures allows for a longitudinal view of how foreign investment shapes and is shaped by the American economic landscape.