Julia Chirkova
A comprehensive new analysis of U.S. business activity in the first half of 2026 has revealed a significant and uneven adoption of artificial intelligence (AI) across the nation. The report, titled "America’s Workplace AI Temp Check," compiled by AI resume builder Resume Now using data from the U.S. Census Bureau’s Business Trends and Outlook Survey, has pinpointed distinct geographical clusters where AI integration is either rapidly accelerating or lagging considerably. The findings paint a nuanced picture of the evolving technological landscape, with Washington D.C., Arizona, and Colorado emerging as leading hubs for AI implementation.
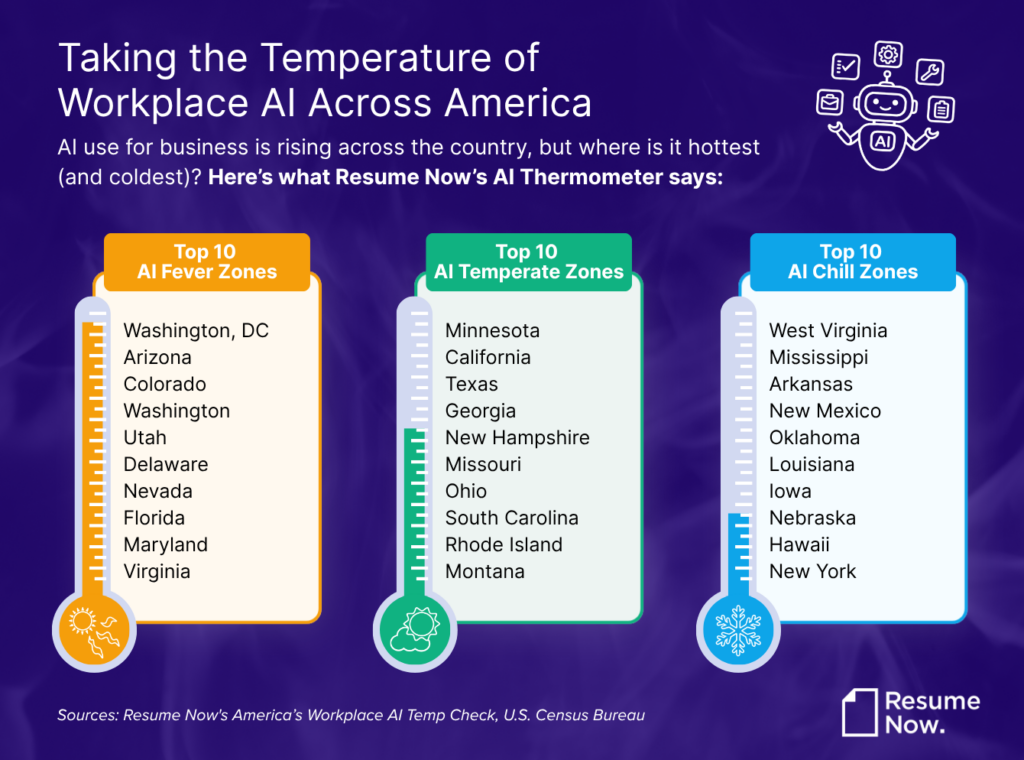
The study’s methodology involved the creation of the "Resume Now AI Thermometer," a proprietary tool designed to quantify and categorize AI adoption rates among businesses. The baseline for this thermometer was established at 18.9%, representing the average percentage of businesses across the 48 contiguous states and Washington D.C. that reported utilizing AI in at least one business function during the specified period. States and jurisdictions were then categorized into three tiers: "AI Fever Zones" (adoption rates at least 2 percentage points above the baseline), "AI Temperate Zones" (adoption rates within 2 percentage points above or below the baseline), and "AI Chill Zones" (adoption rates at least 2 percentage points below the baseline).
AI Fever Zones: The Frontrunners of Artificial Intelligence Integration
The "AI Fever Zones" represent the vanguard of AI adoption in the American workplace. Washington D.C. led this category with an impressive 27.7% of businesses reporting AI usage, a remarkable 8.8 percentage points above the national baseline. This figure highlights a concentration of forward-thinking organizations, likely driven by a combination of factors including a robust technology sector, a highly educated workforce, and potentially government initiatives encouraging innovation.
Among the individual states, Arizona stood out with the highest AI adoption rate at 24.4%, exceeding the baseline by 5.5 percentage points. This strong performance suggests a dynamic business environment in Arizona that is actively embracing technological advancements. Colorado followed closely, reporting a 24.0% AI adoption rate, a 5.1 percentage point increase over the baseline, underscoring its position as a growing center for tech-driven industries.
The top ten "AI Fever Zones" and their respective adoption rates are as follows:
- Washington, D.C.: 27.7% (8.8 points above baseline)
- Arizona: 24.4% (5.5 points above baseline)
- Colorado: 24.0% (5.1 points above baseline)
- Washington: 23.1% (4.2 points above baseline)
- Utah: 22.9% (4.0 points above baseline)
- Delaware: 22.7% (3.8 points above baseline)
- Nevada: 22.6% (3.7 points above baseline)
- Florida: 21.9% (3.0 points above baseline)
- Maryland: 21.4% (2.5 points above baseline)
- Virginia: 21.3% (2.4 points above baseline)
The presence of states like Washington, Utah, Delaware, Nevada, Florida, Maryland, and Virginia in this top tier suggests a broad geographical distribution of AI adoption among high-performing regions. These states often possess characteristics such as strong venture capital investment, a skilled technology workforce, and supportive regulatory environments that foster innovation.
AI Temperate Zones: Steady Adoption and Emerging Trends
The "AI Temperate Zones" encompass a broader spectrum of states where AI adoption is aligning closely with the national average. These regions represent a significant portion of the American business landscape, indicating a steady, if not explosive, integration of AI technologies. Minnesota emerged as the leader within this category, with 20.9% of businesses reporting AI use, just shy of the "AI Fever Zone" threshold.
Notably, California and Texas, two of the nation’s largest economic powerhouses, also found themselves in this category, both reporting an AI adoption rate of 20.8%. This positions them just below the "AI Fever Zone" cutoff, suggesting substantial AI integration that is nevertheless closely mirroring the national average. Their inclusion here, rather than in the "Fever Zones," could be attributed to the sheer size and diversity of their economies, which may dilute the overall percentage of AI-adopting businesses compared to smaller, more specialized tech hubs.
The top ten states within the "AI Temperate Zones" include:
- Minnesota: 20.9% (1.97 points above baseline)
- California: 20.8% (1.9 points above baseline)
- Texas: 20.8% (1.9 points above baseline)
- Georgia: 20.5% (1.6 points above baseline)
- New Hampshire: 20.5% (1.6 points above baseline)
- Missouri: 19.8% (0.9 points above baseline)
- Ohio: 19.6% (0.7 points above baseline)
- South Carolina: 19.4% (0.5 points above baseline)
- Rhode Island: 19.3% (0.4 points above baseline)
- Montana: 19.0% (0.1 points above baseline)
The clustering of states like California and Texas in this zone, alongside other significant economic players like Georgia and Ohio, indicates that AI adoption is a widespread phenomenon, even if it hasn’t reached the highest levels of penetration in these particular regions during the analyzed period. This suggests that while these states are actively engaged with AI, the pace of integration might be more measured, or the impact is spread across a larger and more diverse business ecosystem.
AI Chill Zones: The Lagging Regions in AI Adoption
At the other end of the spectrum are the "AI Chill Zones," comprising states where the reported business use of AI significantly lags behind the national average. West Virginia registered the lowest AI adoption rate among all states, with only 13.5% of businesses utilizing AI, a substantial 5.4 percentage points below the baseline. Mississippi followed closely with 13.7% adoption, and Arkansas reported 14.3%.
These states may face unique challenges contributing to their lower AI adoption rates. These could include economic factors such as a higher concentration of industries less amenable to immediate AI integration, workforce skill gaps, limited access to technological infrastructure, or less robust investment in emerging technologies.
The ten states with the lowest reported AI adoption rates, categorized as "AI Chill Zones," are:
- West Virginia: 13.5% (5.4 points below baseline)
- Mississippi: 13.7% (5.2 points below baseline)
- Arkansas: 14.3% (4.6 points below baseline)
- New Mexico: 14.7% (4.2 points below baseline)
- Oklahoma: 14.9% (4.0 points below baseline)
- Louisiana: 15.3% (3.6 points below baseline)
- Iowa: 15.4% (3.5 points below baseline)
- Nebraska: 15.8% (3.1 points below baseline)
- Hawaii: 16.1% (2.8 points below baseline)
- New York: 16.1% (2.8 points below baseline)
The inclusion of New York in this category, despite its global economic significance and a strong presence in sectors like finance and media where AI is increasingly relevant, is noteworthy. This might indicate that while AI is present in New York’s advanced industries, its overall penetration across all business sectors, including smaller enterprises, is not as high as in the leading "AI Fever Zones." This could be due to the immense scale and diversity of New York’s economy, where adoption rates can vary significantly between different industries and business sizes.

Broader Implications and Expert Commentary
The "America’s Workplace AI Temp Check" report identified 13 states and Washington D.C. as "AI Fever Zones," 21 states as "AI Temperate Zones," and 15 states as "AI Chill Zones." This distribution underscores the uneven nature of technological progress across the United States.
Keith Spencer, a career expert at Resume Now, commented on the findings, stating, "AI is becoming a part of more workplaces, but this data suggests workers may not encounter that shift evenly across the country. For workers, these differences are a reminder that exposure to AI at work may vary considerably depending on where they live and work. The goal is not to become an AI expert overnight. It is to understand how to use these tools responsibly, check their outputs, and know where human judgment still matters."
The implications of these findings are multifaceted. For businesses, understanding regional AI adoption rates can inform strategic decisions regarding talent acquisition, technology investment, and market expansion. Companies operating in "AI Fever Zones" may find a more readily available pool of AI-savvy talent and a more receptive market for AI-driven products and services. Conversely, businesses in "AI Chill Zones" might face greater challenges in recruiting specialized AI talent and may need to invest more heavily in training and infrastructure to remain competitive.
For the workforce, the report highlights potential disparities in job opportunities and skill development related to AI. Workers in regions with higher AI adoption may have greater exposure to AI tools and the associated learning opportunities, potentially leading to a widening skills gap between different parts of the country. This underscores the importance of accessible education and training programs to ensure that all segments of the workforce can adapt to the evolving demands of an AI-integrated economy.
The analysis also raises questions about the underlying factors driving these regional differences. Economic diversification, educational attainment levels, access to capital, state-level innovation policies, and the prevalence of specific industries are all likely contributors to the varied adoption rates. Further research into these factors could provide valuable insights for policymakers seeking to promote more equitable technological advancement across the nation.
As AI continues its rapid integration into the global economy, the insights from "America’s Workplace AI Temp Check" serve as a critical snapshot of the current landscape, offering a roadmap for understanding the opportunities and challenges that lie ahead for businesses and workers alike in different regions of the United States. The full report, "America’s Workplace AI Temp Check," is available for further exploration via a link provided by Resume Now.