The Congressional Budget Office (CBO) recently released its updated estimates on the distribution of US household income in 2022, offering a comprehensive look at the impact of federal transfers and taxes on various income brackets. This significant report reaffirms that the federal tax and transfer system continues to operate progressively, ensuring that higher-income households contribute a larger share of their earnings, even in the wake of the expiration of substantial pandemic-era economic relief policies. The findings, consistent with prior analyses by organizations like the Tax Foundation, underscore the enduring structure of the nation’s fiscal framework.
Understanding the CBO’s Role and Methodology
The Congressional Budget Office is a nonpartisan agency that provides budget and economic information to Congress. Its analyses are crucial for informing legislative debates and understanding the real-world effects of federal policies. For this report, the CBO meticulously analyzed data on household income, federal transfers (such as Social Security, Medicare, Medicaid, and various welfare programs), and federal taxes (individual income, payroll, corporate income, and excise taxes). The "distribution of household income" refers to how the total income of all U.S. households is divided among different income groups, typically quintiles (20 percent segments) or more granular percentile groupings. By including the effects of both transfers and taxes, the CBO provides a net picture of how government policies shape the economic well-being of American households. This holistic approach is vital because taxes reduce disposable income, while transfers increase it, particularly for lower-income groups. The CBO’s reports are widely regarded as authoritative sources for understanding economic inequality and the redistributive impact of federal fiscal policy.
Post-Pandemic Dip in Income Growth and Its Drivers
While the overall system remained progressive, 2022 saw a slight dip in US household income growth after taxes and transfers, following two years of unprecedented expansion in 2020 and 2021. The CBO explicitly attributes this moderation to the cessation of extraordinary pandemic-era legislation. During the height of the COVID-19 pandemic, the federal government enacted several large-scale relief programs, including direct recovery rebates (stimulus checks), expanded unemployment benefits, and a temporary, enhanced Child Tax Credit (CTC). These measures injected trillions of dollars into the economy, significantly bolstering household incomes across the spectrum, particularly for lower and middle-income families.
For instance, the temporary expansion of the Child Tax Credit in 2021 made it fully refundable and increased the maximum credit amount, providing a substantial boost to families with children. Similarly, enhanced unemployment benefits provided a critical lifeline to millions of Americans who lost jobs due to the pandemic. The expiration of these programs in 2022 naturally led to a contraction in the growth rate of after-tax and transfer income. However, the CBO’s data further revealed that, when these temporary items are excluded, household incomes generally rose across most segments, with the notable exception of the top 20 percent of households. This suggests an underlying resilience and growth in the economy, even as direct government aid tapered off.
Long-Term Income Trends: A Four-Decade Perspective
To fully appreciate the current landscape, it’s essential to zoom out and examine the broader historical context. Since 1979, the United States has witnessed significant shifts in income distribution. The CBO’s data reveals a pronounced divergence in income growth across different quintiles over this 43-year period. Average incomes for households in the lowest quintile have effectively doubled, indicating some progress in lifting the floor for the nation’s poorest. The middle three quintiles, representing the broad middle class, have experienced more modest growth, with average incomes rising by approximately 65 percent after accounting for taxes and transfers.
In stark contrast, the highest quintile has seen its income after taxes and transfers surge by an impressive 144 percent since 1979. This illustrates a widening gap between the highest earners and the rest of the population, a trend that has fueled ongoing debates about income inequality and economic opportunity. The CBO’s analysis further clarifies the composition of income across these groups. For the vast majority of taxpayers, labor income (wages and salaries) remains the primary source of their earnings. However, for higher earners, business and investment income (such as profits from businesses, capital gains, and dividends) plays a disproportionately larger and more crucial role. This distinction is vital for understanding how different tax policies impact various income groups, as labor income and investment income are often subject to different tax treatments.
Variations in Federal Tax Rates Across Tax Types
The overall progressivity of the federal system is a composite effect of various tax types, each with its own structure and impact on different income levels. The CBO report delves into the effective tax rates for individual income, payroll, excise, and corporate income taxes.
-
Individual Income Taxes: A Highly Progressive Pillar
Individual income taxes stand out as the most progressive component of the federal tax system. Their design incorporates graduated tax brackets, meaning higher incomes are taxed at higher marginal rates. More significantly, refundable tax credits play a crucial role in creating negative effective tax rates for lower-income households. Programs like the Earned Income Tax Credit (EITC) and the Child Tax Credit (CTC) are designed not only to reduce tax liabilities but also to provide direct payments to eligible filers, even if they owe no federal income tax. This means that the government effectively sends money back to these households. In 2022, the lowest quintile’s average effective federal income tax rate was -10.1 percent, highlighting the substantial support provided through these credits. Conversely, taxpayers in the top 20 percent faced an average effective income tax rate of 16.6 percent, demonstrating the progressive nature of this tax. The EITC, for instance, aims to supplement the wages of low-to-moderate-income workers, particularly those with children, thereby incentivizing work and reducing poverty. -
Payroll Taxes: Mostly Flat, Slightly Regressive
Payroll taxes, which primarily fund Social Security and Medicare, are applied more uniformly across a broad range of incomes. However, their structure leads to a somewhat regressive impact. In 2022, the effective payroll tax rate ranged from 9.5 percent for the lowest quintile to 6.1 percent for the top 20 percent. This apparent regressivity is largely due to the Social Security portion of the tax, which applies only to wages and self-employment income up to a certain annual limit—$147,000 in 2022. Income earned above this cap is not subject to the Social Security tax. Consequently, middle earners, whose entire income often falls below or just above this threshold, pay a larger percentage of their total income in Social Security taxes compared to very high earners, whose substantial incomes far exceed the cap. This cap concentrates the effective payroll tax rates on middle earners, making the overall payroll tax system less progressive than the individual income tax system. -
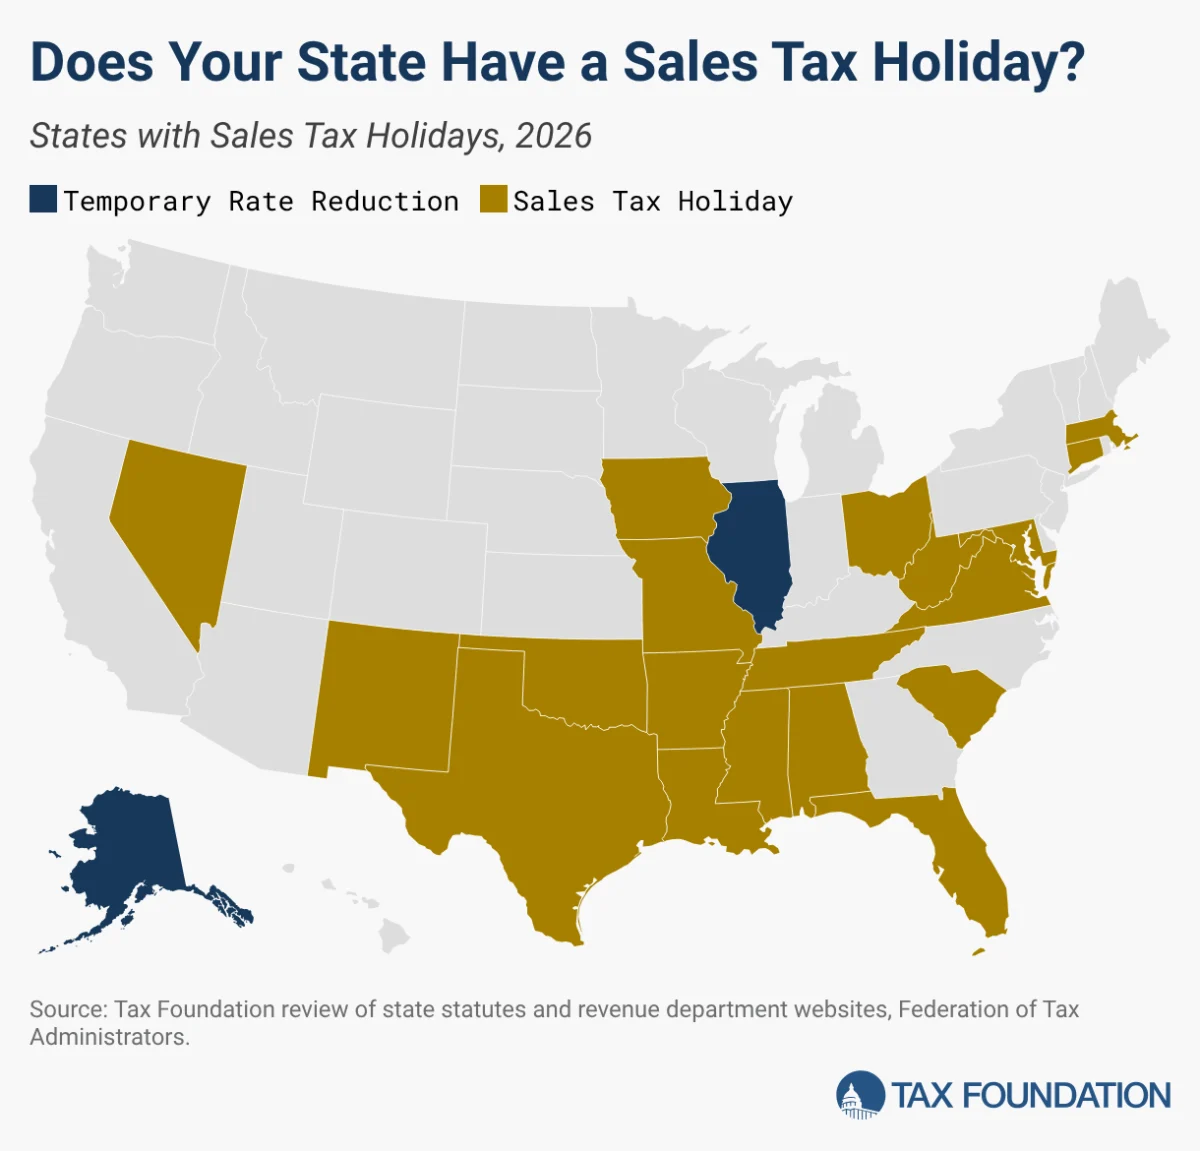
Excise Taxes: Inherently Regressive
Federal excise taxes, levied on specific goods and services such as gasoline, tobacco, alcohol, and certain luxury items, are generally regressive. This is because these taxes represent a larger proportion of income for lower-income households, who tend to spend a greater share of their earnings on consumption goods subject to these taxes. For example, a tax on gasoline disproportionately affects lower-income individuals who may have longer commutes or older, less fuel-efficient vehicles. The CBO data confirms this, showing that taxpayers in lower quintiles pay higher effective rates from excise taxes than those in higher quintiles. -
Corporate Income Taxes: Progressive Incidence
Corporate income taxes are levied on the profits of corporations. While businesses pay these taxes directly, the economic burden, or "incidence," of corporate taxes is ultimately borne by individuals—shareholders, workers, and consumers. The CBO’s analysis, aligning with broader economic consensus, finds that corporate income taxes are progressive. This is because higher-income households tend to own a larger share of corporate equities (stocks) than lower-income households. Therefore, the portion of the tax burden that falls on shareholders is disproportionately borne by the wealthy. In 2022, the effective corporate income tax rate was 0.8 percent for the bottom 20 percent of households, rising to 2.9 percent for the top 20 percent, illustrating its progressive impact.
Overall Federal Tax System: Consistently Progressive
When all these components are considered together, the federal tax system as a whole was unequivocally progressive in 2022. This means that effective federal tax rates—the total taxes paid as a percentage of income—increased with higher income levels. The CBO report indicates a significant gradient: the effective federal tax rate rose from a mere 1.4 percent for the bottom quintile to 23.2 percent for the top quintile. For the very highest earners, the progressivity was even more pronounced, with the top 1 percent of earners facing an effective federal tax rate of 31.5 percent.
Further disaggregating the top 1 percent reveals interesting nuances. Those in the 99th to 99.9th percentiles faced an average tax rate of 31.0 percent. This rate slightly increased to 32.6 percent for the 99.9th to 99.99th percentiles. However, for the very pinnacle—the top 0.01 percent of earners—the effective federal tax rate saw a marginal dip to 31.2 percent. This slight decrease at the extreme top has been a subject of ongoing debate, often attributed to the composition of income for these ultra-high earners, which may include a larger share of capital gains taxed at lower rates than ordinary income, or strategic tax planning.
Shifting Tax Burdens Over Time: The Role of Income Inequality
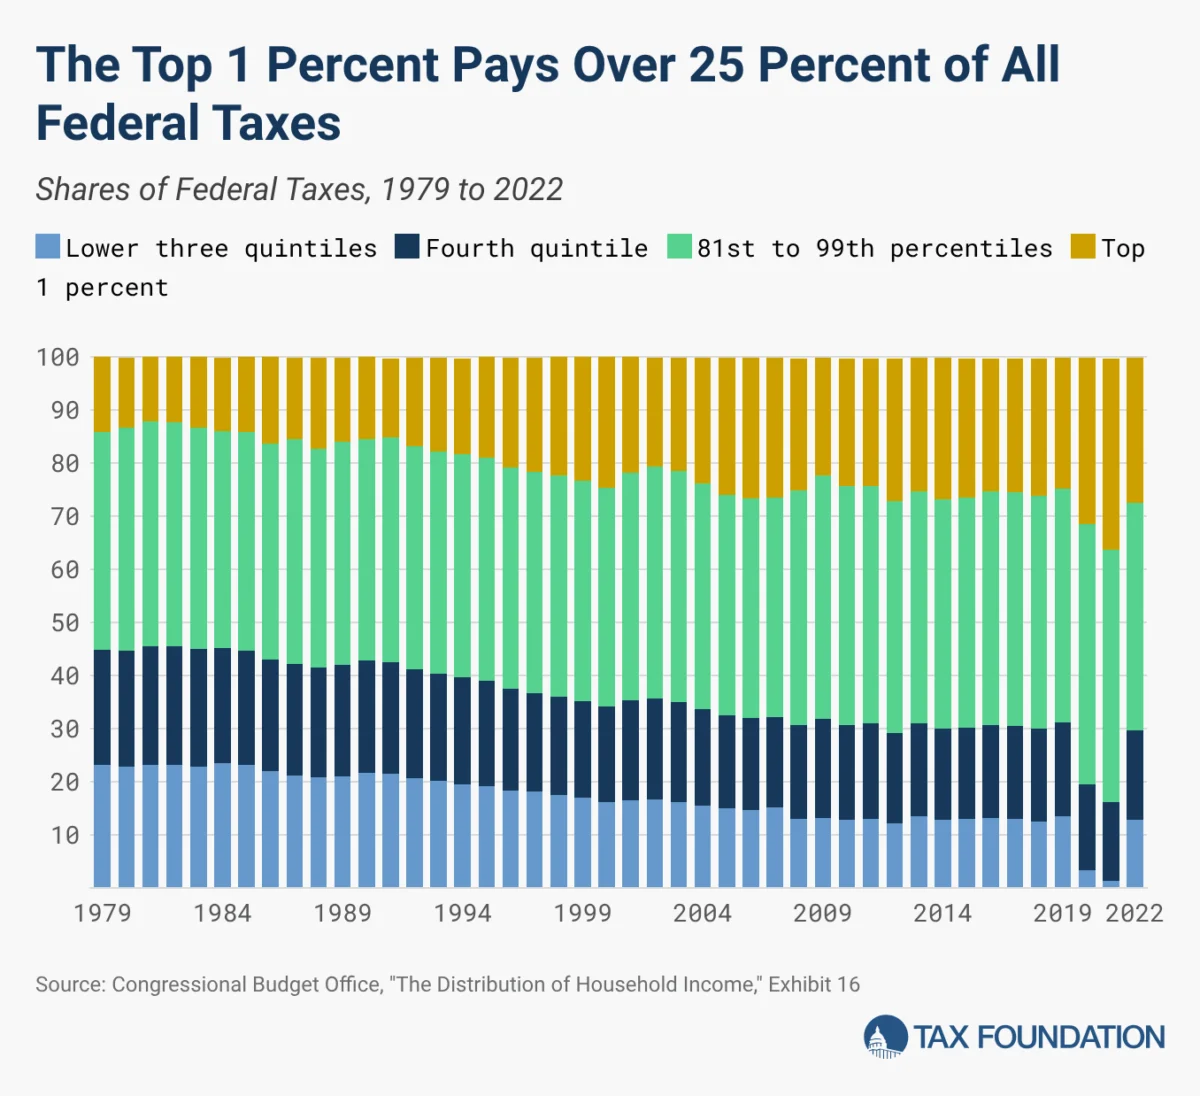
A critical finding of the CBO’s analysis is the evolving share of federal taxes paid by different income groups over several decades. High-income households have steadily taken on a larger proportion of the overall federal tax burden. In 2022, the top one percent of earners paid 27.3 percent of all federal taxes, a substantial increase from an average of 14.3 percent in the 1980s. Conversely, the share of federal taxes paid by the bottom 60 percent of households significantly decreased, falling from an average of 22.3 percent in the 1980s to just 12.8 percent in 2022.
This trend was even more pronounced during the initial years of the pandemic. In 2020 and 2021, when extensive relief measures were distributed through the tax code, the bottom 60 percent of taxpayers paid an exceptionally low share of federal taxes—3.3 percent in 2020 and 1.3 percent in 2021. As these relief programs expired in 2022, the share paid by this group normalized somewhat, rising to 12.8 percent, though still markedly lower than pre-pandemic averages or the 1980s.
This observed shift in tax burden can be attributed to two primary factors: a more progressive tax code over time, and a significant increase in income inequality. If the tax code itself has become more progressive, then higher earners would inherently pay a greater share. However, if a larger share of the nation’s total income has accrued to top earners, then even under a stable progressive system, they would mechanically pay a greater share of taxes.
To disentangle these effects, the CBO’s analysis compares the change in the share of income earned with the share of taxes paid for different income groups over time, and it also considers changes in average federal tax rates. In 1979, the bottom 80 percent of earners collectively earned 54.6 percent of total income and paid 44.8 percent of all federal taxes. By 2022, this group’s share of income had fallen to 45.1 percent, and their share of federal taxes paid declined even more sharply to 29.6 percent.
For the top 1 percent, the opposite trend is evident. In 1979, they earned 9 percent of income and paid 14.1 percent of federal taxes. By 2022, their share of income had nearly doubled to 17.8 percent, and their share of federal taxes paid also saw a significant rise to 27.3 percent. This means that from 1979 to 2022, the top 1 percent’s share of income increased by 97.8 percent, while their share of taxes paid increased by a comparable 93.6 percent. In contrast, the bottom 80 percent of earners experienced a 17.4 percent decline in their share of income but saw a much larger 33.9 percent decline in their share of federal taxes paid. This indicates that while income inequality has certainly played a role, changes in the tax code have also shifted the burden away from lower and middle-income groups.
Evolution of Effective Federal Tax Rates
The evolution of effective federal tax rates further corroborates this narrative of increasing progressivity. For the bottom 20 percent of households, the average tax rate declined substantially from 10 percent in the 1980s to a mere 0.7 percent between 2010 and 2019. The pandemic relief measures pushed these rates to unprecedented lows, reaching -16.5 percent in 2020 and -22.5 percent in 2021, reflecting the significant net transfers received by these households. As relief expired, their average tax rate returned to 1.4 percent in 2022, still remarkably low compared to historical levels.
For the top 1 percent, the effective tax rate remained relatively stable. It averaged 31.2 percent from 2010 to 2019 and hovered around 30 percent throughout the pandemic years. This rate is quite close to their average federal rate of 30.5 percent observed between 1979 and 2000, suggesting that while their share of income and taxes paid has increased, their effective rate has remained relatively consistent over the long term, with some fluctuations due to policy changes (like the Bush tax cuts or the Trump tax cuts). This stability in their effective rate, even as their income share grew, points to a progressive system that adapts to changes in the income landscape without drastically altering their overall tax burden as a percentage of their income.
Implications for Future Policy Debates
The latest CBO data from 2022 provides several critical takeaways for policymakers and the public. First, income earned after taxes and transfers has generally increased over the past several decades for all income groups, albeit unevenly. This suggests that the American economy has generated overall growth, and the transfer system has played a role in distributing some of that growth, especially to lower-income households.
Second, the federal tax system is unequivocally progressive and has, in fact, become more progressive over the past three decades. This finding challenges common narratives that the wealthy do not pay their fair share, at least in terms of their effective federal tax rates and their overall contribution to federal revenue.
Third, the federal system relies heavily on higher earners to raise revenue for government services and means-tested transfers. The disproportionate share of taxes paid by the top quintile, and especially the top 1 percent, highlights their critical role in funding federal expenditures.
These facts are crucial considerations for policymakers as they deliberate on proposals to alter the tax code, whether through increasing tax burdens, introducing new taxes, or reshaping the distribution of existing taxes. Any significant changes would likely have profound effects on different income groups and on the overall fiscal health of the nation. Understanding the current progressive structure, its historical evolution, and its impact on income distribution is essential for crafting responsible and equitable fiscal policy moving forward. The CBO’s continuous analysis provides the indispensable empirical foundation for these complex discussions.