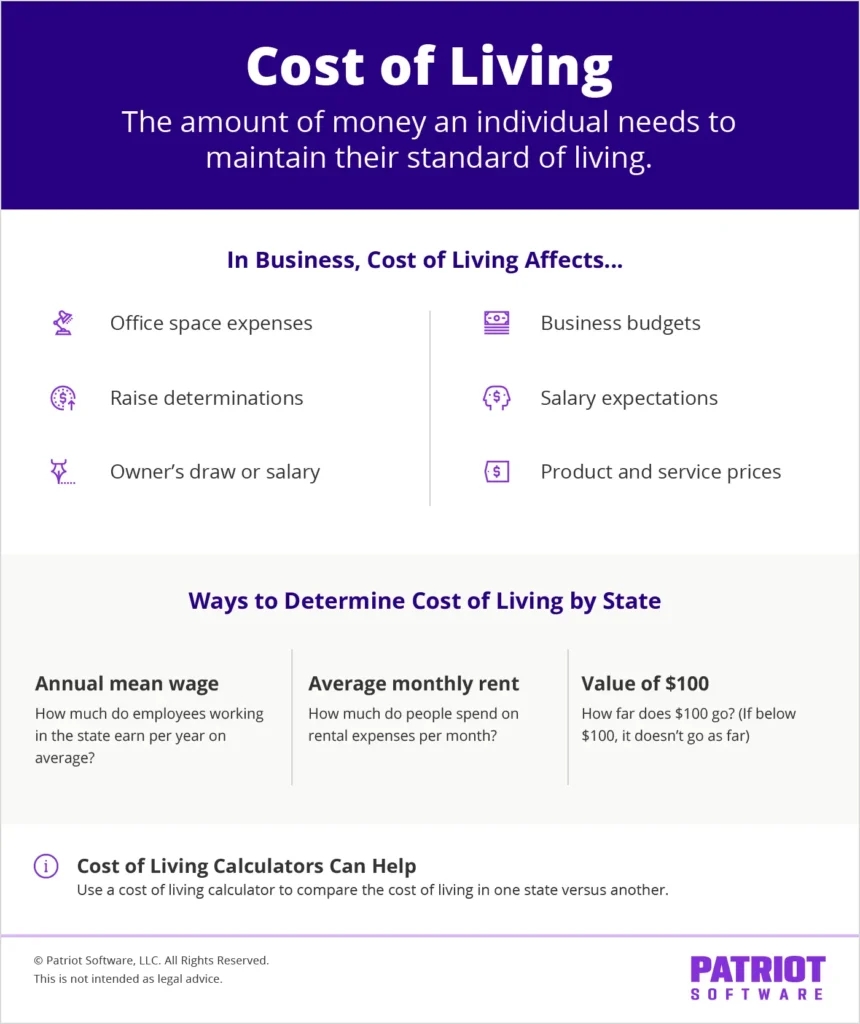
The economic landscape of the United States in 2026 presents a complex tapestry of varying living standards, wage expectations, and purchasing power, forcing both businesses and households to reassess their financial strategies. As the cost of living continues to be a primary driver of domestic migration and corporate relocation, understanding the granular data behind these shifts is no longer a luxury but a necessity for survival in a competitive market. The cost of living, defined fundamentally as the amount of money required to maintain a specific standard of living, encompasses essential expenditures including housing, food, transportation, healthcare, taxes, and education. By examining the most recent data from 2025 and 2026, it becomes clear that the divide between the most and least expensive states is widening, creating significant implications for the national labor market and small business sustainability.
The Evolution of Economic Disparity: A Brief Chronology
To understand the 2026 economic environment, one must look back at the trajectory of the last several years. In 2019, the cost of living was largely dictated by traditional urban hubs. However, the global pandemic and the subsequent inflationary period of 2021-2023 fundamentally altered the American economic map. The rise of remote work decoupled geography from employment for millions, leading to a "great migration" toward states with lower tax burdens and more affordable housing.
By 2024, many of these "affordable" havens began to see their own costs rise due to increased demand, a phenomenon that has stabilized somewhat in the 2025-2026 period. Current data reflects a mature post-inflationary market where wages are attempting to catch up with the high cost of shelter. The 2026 figures indicate that while some states have managed to keep costs low through aggressive housing development and favorable tax policies, others—particularly on the coasts—remain prohibitively expensive for the average earner.
Key Metrics and the Value of the Dollar
The most recent data sets utilize three critical indicators to measure the economic health of each state: the monthly mean wage, the average monthly rent for a standard 696-square-foot unit, and the "Value of $100." The latter is a measure of regional price parity; if the value is above $100, the consumer’s purchasing power is higher than the national average, whereas a value below $100 indicates that goods and services are more expensive.
In 2026, the disparity is stark. In Mississippi, the value of $100 stands at $112.71, the second-highest in the nation, providing a significant boost to the local population’s standard of living despite a lower monthly mean wage of $4,234.17. Conversely, in California, the value of $100 plummets to $87.42, meaning that even with a high monthly mean wage of $6,724.17, residents often find themselves struggling to cover basic expenses. This "hidden tax" of high-cost regions is a primary factor in the ongoing talent drain from the West Coast to the Sun Belt and the Midwest.
High-Cost Bastions: New York, Massachusetts, and California
The 2026 data reinforces the status of New York and Massachusetts as the most expensive states in the union. New York leads the nation in housing costs, with an average monthly rent of $3,043 for a modest apartment. Despite a mean monthly wage of $6,871.67, the sheer cost of living in the Empire State, particularly in the New York City metropolitan area, creates a significant barrier for new businesses and entry-level workers.
Massachusetts follows a similar pattern, boasting one of the highest mean monthly wages at $7,134.17, yet burdened by an average rent of $2,537. In these regions, the value of $100 is consistently below $93, indicating a high cost for nearly all consumer goods. For businesses operating in these states, the "bottom line" is under constant pressure from high commercial rents and the necessity of offering inflated salaries to attract and retain talent. This has led to a surge in businesses adopting "remote-first" policies to tap into labor markets in more affordable states.
The Affordability Frontier: Arkansas, Mississippi, and Oklahoma
On the opposite end of the spectrum, states like Arkansas, Mississippi, and Oklahoma continue to offer the highest levels of affordability. Arkansas presents a compelling case for both residents and entrepreneurs, with the value of $100 reaching $113.49—the highest in the country. With an average monthly rent of only $965, a worker in Arkansas retains a much higher percentage of their $4,574.17 monthly wage compared to their counterparts in higher-earning states.
Oklahoma also remains a stronghold of affordability, with the lowest average monthly rent in the nation at $912. For a small business, these states offer a lower barrier to entry, reduced overhead costs, and a more stable local workforce. The trade-off, however, often involves a smaller pool of specialized high-tech talent, though this is changing as remote work allows professionals to live in these affordable regions while working for national corporations.

Regional Data Analysis: 2026 Cost of Living Statistics
The following table provides a comprehensive look at the economic standing of each state as of the 2025-2026 reporting period. It highlights the monthly mean wage across all occupations, the average rent for a standard 696-square-foot unit, and the relative purchasing power of $100.
| State | Monthly Mean Wage | Avg Monthly Rent | Value of $100 |
|---|---|---|---|
| Alabama | $4,791.67 | $1,061 | $110.03 |
| Alaska | $6,226.67 | $1,334 | $98.29 |
| Arizona | $5,635.00 | $1,322 | $98.90 |
| Arkansas | $4,574.17 | $965 | $113.49 |
| California | $6,724.17 | $2,228 | $87.42 |
| Connecticut | $6,451.67 | $1,901 | $96.31 |
| D.C. | $9,250.83 | $2,248 | N/A |
| Florida | $5,389.17 | $1,684 | $96.55 |
| Georgia | $5,493.33 | $1,424 | $103.30 |
| Hawaii | $5,855.83 | $1,842 | $91.39 |
| Illinois | $5,927.50 | $1,710 | $101.15 |
| Indiana | $5,070.00 | $1,132 | $107.82 |
| Iowa | $4,985.83 | $983 | $111.23 |
| Massachusetts | $7,134.17 | $2,537 | $91.76 |
| Michigan | $5,410.00 | $1,157 | $105.82 |
| Mississippi | $4,234.17 | $1,016 | $112.71 |
| New Jersey | $6,503.33 | $2,114 | $91.12 |
| New York | $6,871.67 | $3,043 | $92.37 |
| Ohio | $5,365.83 | $1,100 | $108.19 |
| Oklahoma | $4,745.83 | $912 | $111.71 |
| Texas | $5,479.17 | $1,238 | $102.83 |
| Washington | $6,944.17 | $1,831 | $91.44 |
Business Implications: Why Cost of Living Dictates Strategy
For business owners and corporate executives, these figures are more than just statistics; they are the foundation of strategic planning. The cost of living in a specific state directly impacts the "business bottom line" through several channels. First, it dictates salary requirements. In a state like Washington, where the value of $100 is only $91.44, an employer must pay significantly more than an employer in Ohio ($108.19) just to provide the same quality of life to an employee.
Failure to account for these regional differences can lead to "negative cash flow" territory, where the cost of labor and overhead outpaces revenue. Furthermore, the cost of living influences the pricing model of products and services. A service provider in New Jersey, facing high taxes and rent, must charge higher rates than a provider in Tennessee to achieve the same profit margin. This can create competitive disadvantages in a global or national marketplace where customers may opt for lower-priced alternatives from more affordable regions.
Workforce Dynamics and the Remote Work Revolution
The 2026 economic landscape is also defined by the continued evolution of remote work. According to recent telework studies, states with high telework rates often see a "de-urbanization" effect, where workers earn high salaries from companies based in New York or California but reside in states like Vermont or Montana.
This trend has created a unique challenge for states with a high cost of living. To remain competitive, states like California and New York must find ways to lower the cost of housing or risk losing their tax base to more affordable regions. Conversely, "destination states" for remote workers are seeing their own costs rise as high-earning transplants drive up local real estate prices. This has led to local government reactions, with some states exploring "work-from-home" taxes or incentives to balance the local economy.
Analytical Perspectives: The Role of the Consumer Price Index (CPI)
Economists point to the Bureau of Labor Statistics’ Consumer Price Index (CPI) as the gold standard for tracking these changes. The CPI monitors the price of a fixed "market basket" of approximately 80,000 items, including everything from breakfast cereal to funeral services. In 2026, the CPI reveals that while energy costs have stabilized, the "shelter" component remains the most volatile and influential factor in the cost of living.
Cost of living calculators have become essential tools for HR departments and individuals considering relocation. For instance, a professional earning $50,000 in Cleveland, Ohio, would require a salary of approximately $127,317 in Manhattan to maintain an equivalent lifestyle. This 150% increase is almost entirely driven by housing and local taxes, illustrating the massive economic hurdles present in America’s "superstar cities."
Broader Impact and Future Outlook
As we move further into 2026, the relationship between the cost of living and business viability will likely tighten. We are seeing a trend where businesses are no longer just looking at "business-friendly" tax climates, but also at "employee-friendly" living costs. The ability of a state to provide affordable housing and a high value for the dollar is becoming its greatest economic development tool.
For the individual, the 2026 data suggests that geographic flexibility is the most significant asset one can possess. Those able to move to states with a high "Value of $100" while maintaining competitive wages will see the greatest increase in their personal wealth. For businesses, the mandate is clear: research, adapt, and budget with regional economic realities in mind, or risk being priced out of the market. The states that can balance high wages with manageable living costs will be the true economic engines of the late 2020s.