Lana Rhoades
August Economic Snapshot: Personal Income Inches Up, Consumer Spending Surges
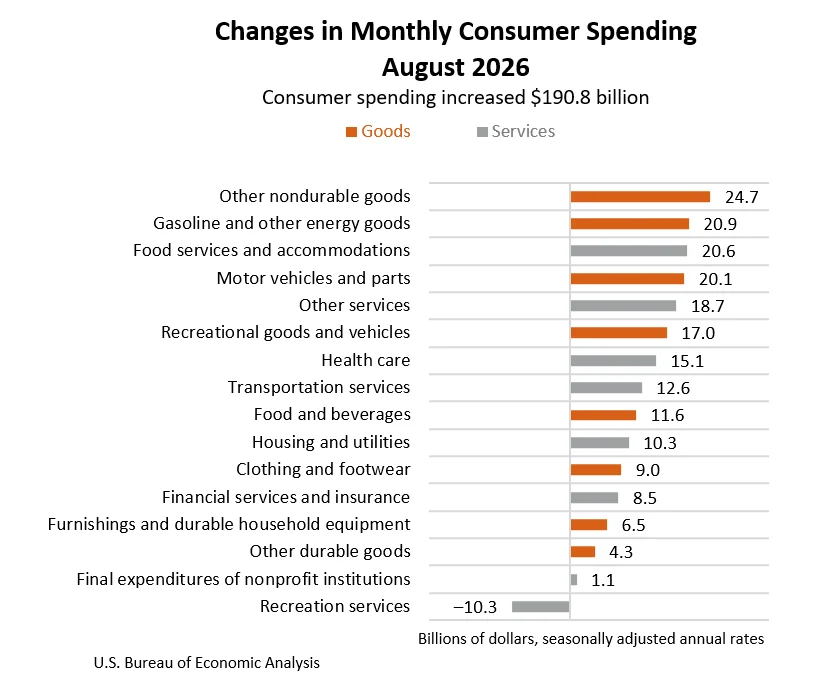
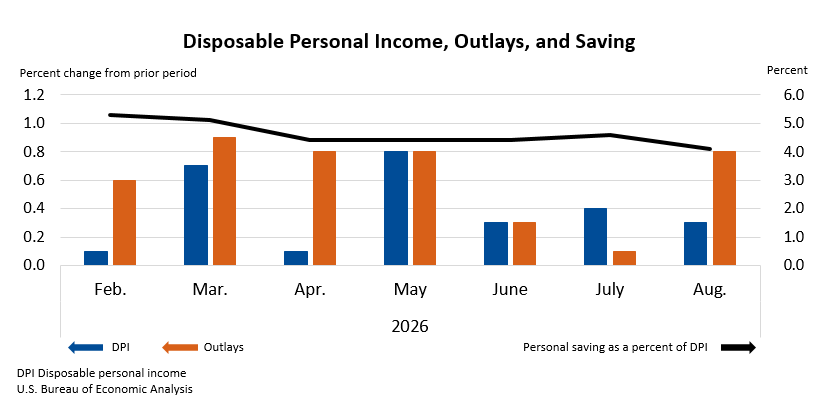
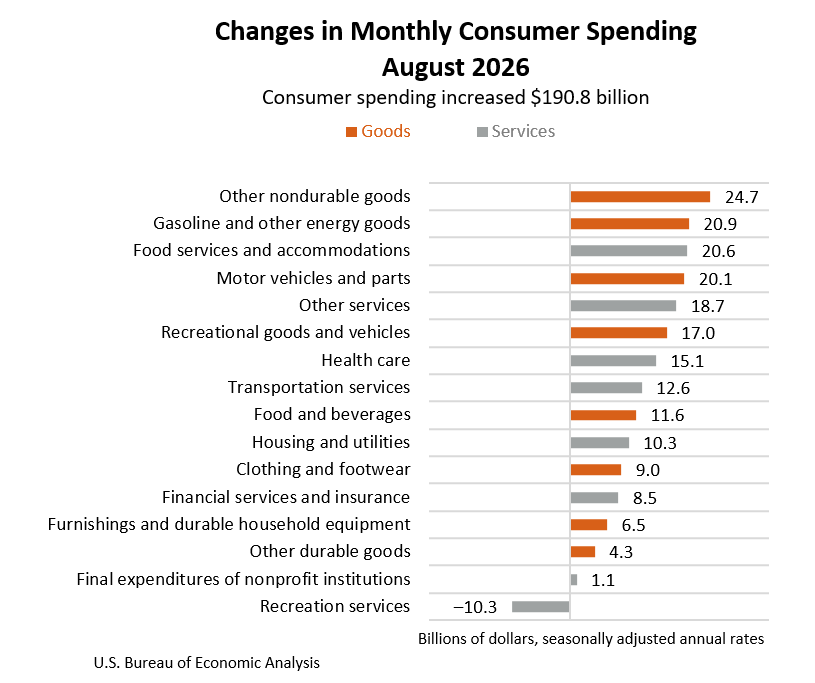
Washington D.C. – In August, the U.S. economy witnessed a modest increase in personal income, with earnings rising by $66.6 billion, or 0.2 percent on a monthly basis, according to the latest estimates released by the U.S. Bureau of Economic Analysis (BEA). This uptick in income was accompanied by a more substantial rise in disposable personal income (DPI) – the amount of income remaining after taxes – which climbed by $68.6 billion, or 0.3 percent. Crucially, this period also saw a robust surge in personal consumption expenditures (PCE), commonly known as consumer spending, which jumped by $190.8 billion, or a significant 0.9 percent.
The data paints a picture of a consumer actively engaging in the marketplace. Personal outlays, encompassing PCE, personal interest payments, and personal current transfer payments, collectively increased by $190.7 billion in August. This heightened spending activity led to a slight contraction in personal saving, which stood at $990.2 billion for the month. Consequently, the personal saving rate, representing personal saving as a percentage of DPI, dipped to 4.1 percent. This figure indicates a shift towards spending from saving among American households during the reporting period.
The primary drivers behind the growth in current-dollar personal income for August were increases in compensation and government social benefits. While specific details on compensation components were not elaborated upon in the initial release, the broad categories suggest a combination of wage growth and potentially enhanced social support programs contributing to the overall income picture. Government social benefits, a key component for many households, likely played a notable role in bolstering personal income levels.
Consumer Spending Accelerates Driven by Goods and Services
The most striking aspect of the August economic report was the substantial increase in personal consumption expenditures. The $190.8 billion rise in current-dollar PCE was broadly distributed across both goods and services. Spending on goods surged by $114.1 billion, indicating strong demand for tangible products. Simultaneously, spending on services saw a considerable increase of $76.7 billion, suggesting a continued recovery and expansion in the services sector, which has been a focal point for economic analysis in recent years.
This elevated spending translated into an increase in real PCE, which adjusts for inflation. Real PCE rose by $92.8 billion, or 0.6 percent on a monthly basis. This real spending growth is a key indicator of economic momentum, as it reflects an actual increase in the volume of goods and services purchased by consumers.
Inflationary Pressures Remain a Watchful Eye
While consumer spending showed robust growth, the report also provided insights into inflationary trends. The PCE price index, a broad measure of inflation for consumer spending, increased by 0.3 percent in August compared to the previous month. More granularly, when excluding the volatile categories of food and energy, the core PCE price index rose by 0.2 percent. This suggests that while overall price pressures were present, the underlying inflation rate, excluding the most unpredictable components, remained somewhat more contained.
On a year-over-year basis, the PCE price index for August showed a more pronounced increase of 3.4 percent. The core PCE price index, excluding food and energy, rose by 3.0 percent from the same month one year ago. These figures indicate that while monthly price increases might be moderating in certain areas, the cumulative impact of inflation over the past year remains a significant factor for consumers and policymakers. The sustained year-over-year increases, particularly in the core measure, will likely continue to be a focus for the Federal Reserve as it calibrates its monetary policy.
A Deeper Dive into the Data: Key Trends and Revisions
The U.S. Bureau of Economic Analysis provides detailed breakdowns of these figures, allowing for a more nuanced understanding of economic dynamics. The increase in current-dollar personal income in August was primarily attributed to higher compensation and government social benefits. While the initial report did not specify the exact nature of these compensation increases, it is often influenced by factors such as wage and salary growth, bonuses, and employer contributions to social insurance.
The BEA also incorporated revisions to its previous estimates, reflecting the ongoing process of data refinement. Monthly estimates for compensation from January through March of 2026 were adjusted to incorporate first-quarter wage and salary data from the Bureau of Labor Statistics (BLS) Quarterly Census of Employment and Wages program. Furthermore, estimates for wages and salaries from April through July of 2026 were updated based on revised monthly data from the BLS Current Employment Statistics (CES) program. These revisions are crucial for ensuring the accuracy and reliability of the national economic accounts. Additionally, revisions to Medicaid benefits reflect updated information from the Centers for Medicare & Medicaid Services, underscoring the interconnectedness of various government data sources in shaping economic assessments.
Broader Economic Context and Potential Implications
The August economic data arrives at a time of ongoing adjustments in the broader economic landscape. Following periods of elevated inflation and aggressive monetary policy tightening by the Federal Reserve, consumer behavior and income growth are closely monitored indicators of economic resilience. The robust increase in consumer spending in August, particularly in real terms, suggests that household demand has remained a significant engine of economic activity. This could be attributed to several factors, including a still-tight labor market providing a cushion for wage earners, the drawdown of accumulated savings from previous periods, or a shift in consumer confidence.
However, the persistent year-over-year increases in the PCE price index, even after excluding food and energy, signal that inflationary pressures, though perhaps moderating from their peaks, are not entirely vanquished. The Federal Reserve’s dual mandate of price stability and maximum employment means that such inflation data will be a critical input in their decision-making process. A sustained pattern of strong consumer spending coupled with elevated inflation could lead to a more cautious approach from the central bank regarding interest rate policy, potentially delaying any significant easing.
Conversely, if the rise in spending is sustainable and not primarily fueled by inflationary price increases, it could indicate a healthy and expanding economy. The BEA’s classification of spending into goods and services offers further insight. The strong performance in goods suggests continued demand for manufactured products, while the rise in services indicates a sustained engagement with sectors like travel, entertainment, and personal care.
The personal saving rate, while dipping to 4.1 percent, remains a point of interest. A lower saving rate implies that consumers are drawing down on accumulated savings or are less inclined to save a portion of their income, potentially signaling increased confidence in future earnings or a response to current spending opportunities. However, a sustained decline in the saving rate could also raise concerns about future household financial resilience, particularly if income growth falters.
Looking Ahead: The Next Economic Indicators
The BEA’s release of Personal Income and Outlays data is a key component of the monthly economic calendar. The next release, scheduled for October 29, 2026, at 8:30 a.m. EDT, will provide updated figures for September 2026. This subsequent report will offer further insights into the continuation or moderation of the trends observed in August, particularly concerning consumer spending patterns, income dynamics, and the trajectory of inflation.
The BEA also makes a wealth of related data available through its Interactive Data Application, allowing economists, analysts, and the public to delve deeper into the intricacies of personal income, consumption, and inflation. Tables such as "Personal Income and Its Disposition" (Table 2.6), "PCE by Major Type of Product" (Table 2.8.5), and various tables detailing price changes provide comprehensive datasets for understanding the nuances of these economic indicators. These resources are invaluable for tracking the long-term evolution of consumer behavior and its impact on the broader economy.
The technical notes accompanying these releases highlight the importance of ongoing data revisions, which are essential for maintaining the accuracy of economic statistics. Incorporating data from sources like the BLS and CMS ensures that the BEA’s estimates are as up-to-date and reflective of the economic reality as possible. These revisions, while sometimes causing minor adjustments to previously reported figures, ultimately strengthen the reliability of the national economic accounts.
In summary, August presented a mixed but generally positive economic picture for American households. Personal income saw a modest increase, while consumer spending experienced a significant surge, particularly in the realm of goods. Inflationary pressures, while present, showed some signs of moderation in core measures on a monthly basis, though year-over-year increases remained a key area of focus. The interplay between income, spending, and inflation will continue to be closely watched as policymakers and market participants navigate the evolving economic landscape.