Lana Rhoades
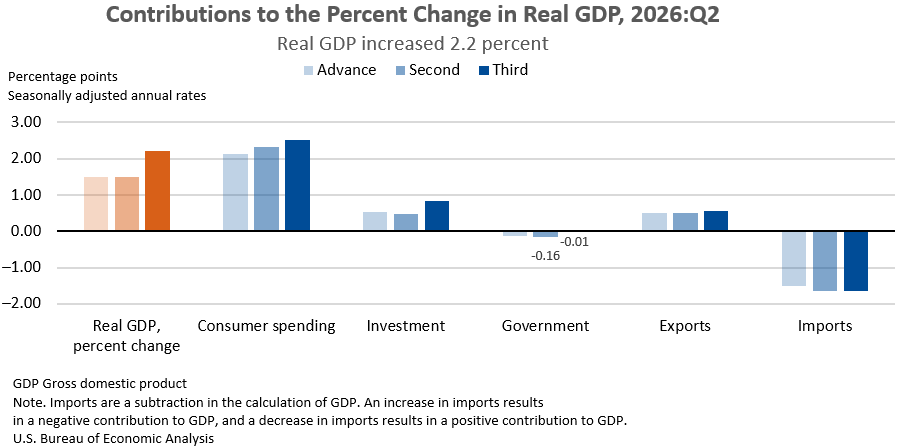
The United States economy demonstrated robust growth in the second quarter of 2026, with real gross domestic product (GDP) expanding at an annual rate of 2.2 percent, according to the third and final estimate released by the U.S. Bureau of Economic Analysis (BEA). This figure represents an upward revision from the previous estimate, signaling a stronger economic performance than initially assessed. The revised data indicates that the economy is building on the 2.5 percent growth recorded in the first quarter of 2026, underscoring a period of sustained expansion.
This latest assessment reveals that the second quarter’s GDP growth was bolstered by significant upward revisions to key economic components, including investment, consumer spending, and government expenditures. These revisions paint a picture of a dynamic economy where private and public sectors are contributing positively to overall output. The increased investment suggests businesses are confident in future economic prospects, while robust consumer spending indicates healthy household demand. Government spending, often a stabilizing force, also played a crucial role in this expansionary phase.
Drivers of Economic Expansion in Q2 2026
The primary engines behind the 2.2 percent GDP increase were strong performance in consumer spending, investment, and exports. These sectors collectively propelled the economy forward, showcasing the diverse strengths of U.S. economic activity. Conversely, imports, which are subtracted in the calculation of GDP, also saw an increase, a common occurrence during periods of economic growth as domestic demand rises.
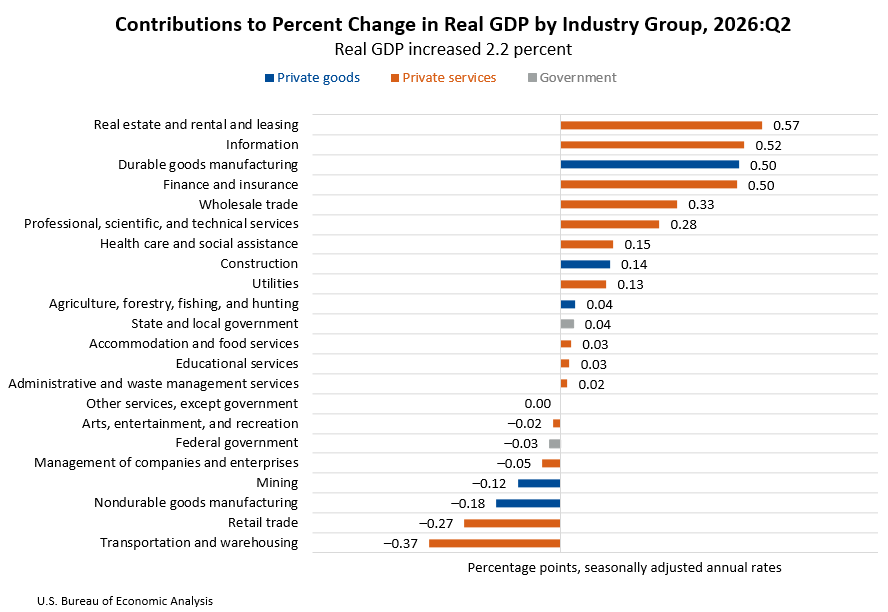
Breaking down the economic activity by industry provides a more granular view of the nation’s productive capacity. The services-producing sector, a cornerstone of the U.S. economy, experienced a notable increase in real value added, rising by 2.5 percent. This growth was complemented by a 2.3 percent expansion in the goods-producing industries. The government sector also contributed, albeit at a more modest pace, with less than a 0.1 percent increase in real value added.
Within the broad industry categories, several specific sectors stood out as key contributors to the overall GDP growth. Real estate and rental and leasing emerged as a leading force, alongside significant contributions from the information sector, durable goods manufacturing, and finance and insurance. These industries, through their increased output and economic activity, played a pivotal role in driving the nation’s economic expansion.
However, not all sectors experienced growth. Certain industries acted as offsets to the overall positive trend, with notable decreases observed in transportation and warehousing, retail trade, and nondurable goods manufacturing. These declines suggest potential headwinds or sector-specific challenges that are being navigated within the broader economic landscape. Understanding these divergences is crucial for a comprehensive view of economic health.
Context of Economic Performance: A Year in Review
The second quarter’s performance follows a period of steady, albeit fluctuating, growth throughout 2025 and into early 2026. The first quarter of 2026 had initially been estimated at 2.5 percent growth, later revised to reflect a more complete data picture. This upward revision to the first quarter’s GDP, now estimated at 2.5 percent, further solidifies the narrative of a strengthening economy heading into the second half of the year. The BEA’s annual update of the National Economic Accounts, which covers data from the first quarter of 2021 through the first quarter of 2026, has played a significant role in refining these figures. These comprehensive updates ensure that the GDP data accurately reflect the evolving economic landscape, incorporating new source data and conceptual changes.
The annual update also incorporates revisions to GDP by industry, Gross Domestic Income (GDI), and their major components. The reference year for these accounts remains 2017, providing a consistent basis for historical comparisons. The BEA’s commitment to regular and thorough updates underscores the importance of accurate economic measurement for policymakers, businesses, and the public.
Analysis of Key Economic Indicators
Beyond the headline GDP figures, several related economic measures provide further insight into the second quarter’s performance. Real final sales to private domestic purchasers, a critical indicator of underlying domestic demand, saw a substantial increase of 4.6 percent. This figure, revised up from the previous estimate, reflects a strong and growing appetite for goods and services from consumers and businesses.
Real gross output, a measure of the total value of goods and services produced by the economy, also exhibited healthy growth, increasing by 5.0 percent. This expansion was driven by strong performance in private services-producing industries (6.0 percent), private goods-producing industries (3.0 percent), and government (2.6 percent).
The relationship between GDP and GDI is another key aspect of economic analysis. Real Gross Domestic Income (GDI), which measures the income earned by all participants in the economy, increased by 2.6 percent in the second quarter, also revised upward. The average of real GDP and real GDI, often considered a more stable measure of economic growth, increased by 2.4 percent. This convergence of GDP and GDI suggests a balanced and sustainable growth pattern.
Corporate profits from current production also contributed to the economic picture, increasing by $384.0 billion. While this figure was revised down slightly from an earlier estimate, it still indicates a positive environment for corporate earnings.
Inflationary Pressures and Price Indices
While the economy demonstrated strong growth, attention also remains on inflationary pressures. The price index for gross domestic purchases, a broad measure of inflation for goods and services bought by U.S. residents, increased by 5.6 percent. This figure was revised down slightly, suggesting a moderating trend in overall price increases compared to previous estimates.
The Personal Consumption Expenditures (PCE) price index, a key inflation gauge closely watched by the Federal Reserve, increased by 5.0 percent. This was also a downward revision, indicating a slightly less inflationary environment than initially reported. The core PCE price index, which excludes volatile food and energy prices, increased by 3.3 percent, also revised downward. These revisions suggest that inflationary pressures may be easing, a development that could influence future monetary policy decisions.
Regional Economic Performance: A State-by-State Snapshot
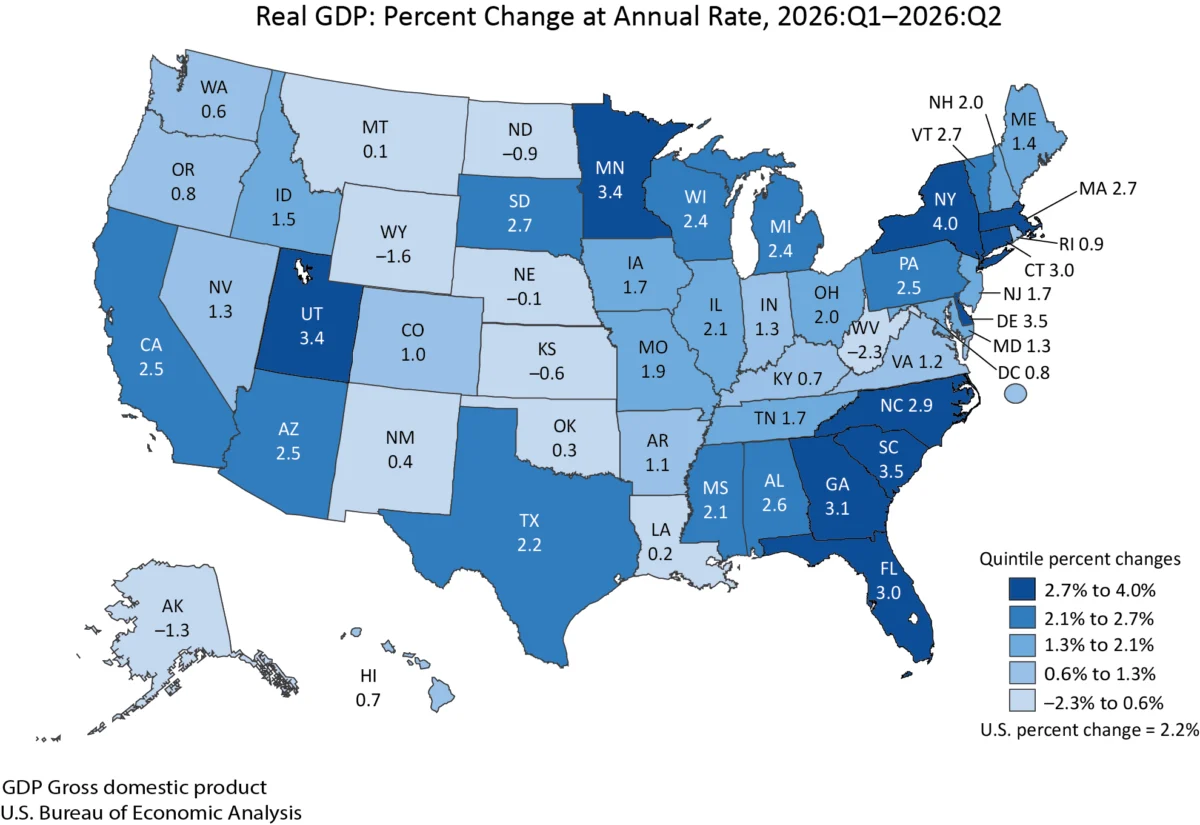
The economic expansion was not uniform across the nation, with significant variations observed in GDP growth by state. In the second quarter of 2026, real GDP increased in 44 states and the District of Columbia. The pace of growth varied considerably, with New York leading the pack at a robust 4.0 percent annual rate, while West Virginia experienced a contraction of 2.3 percent.
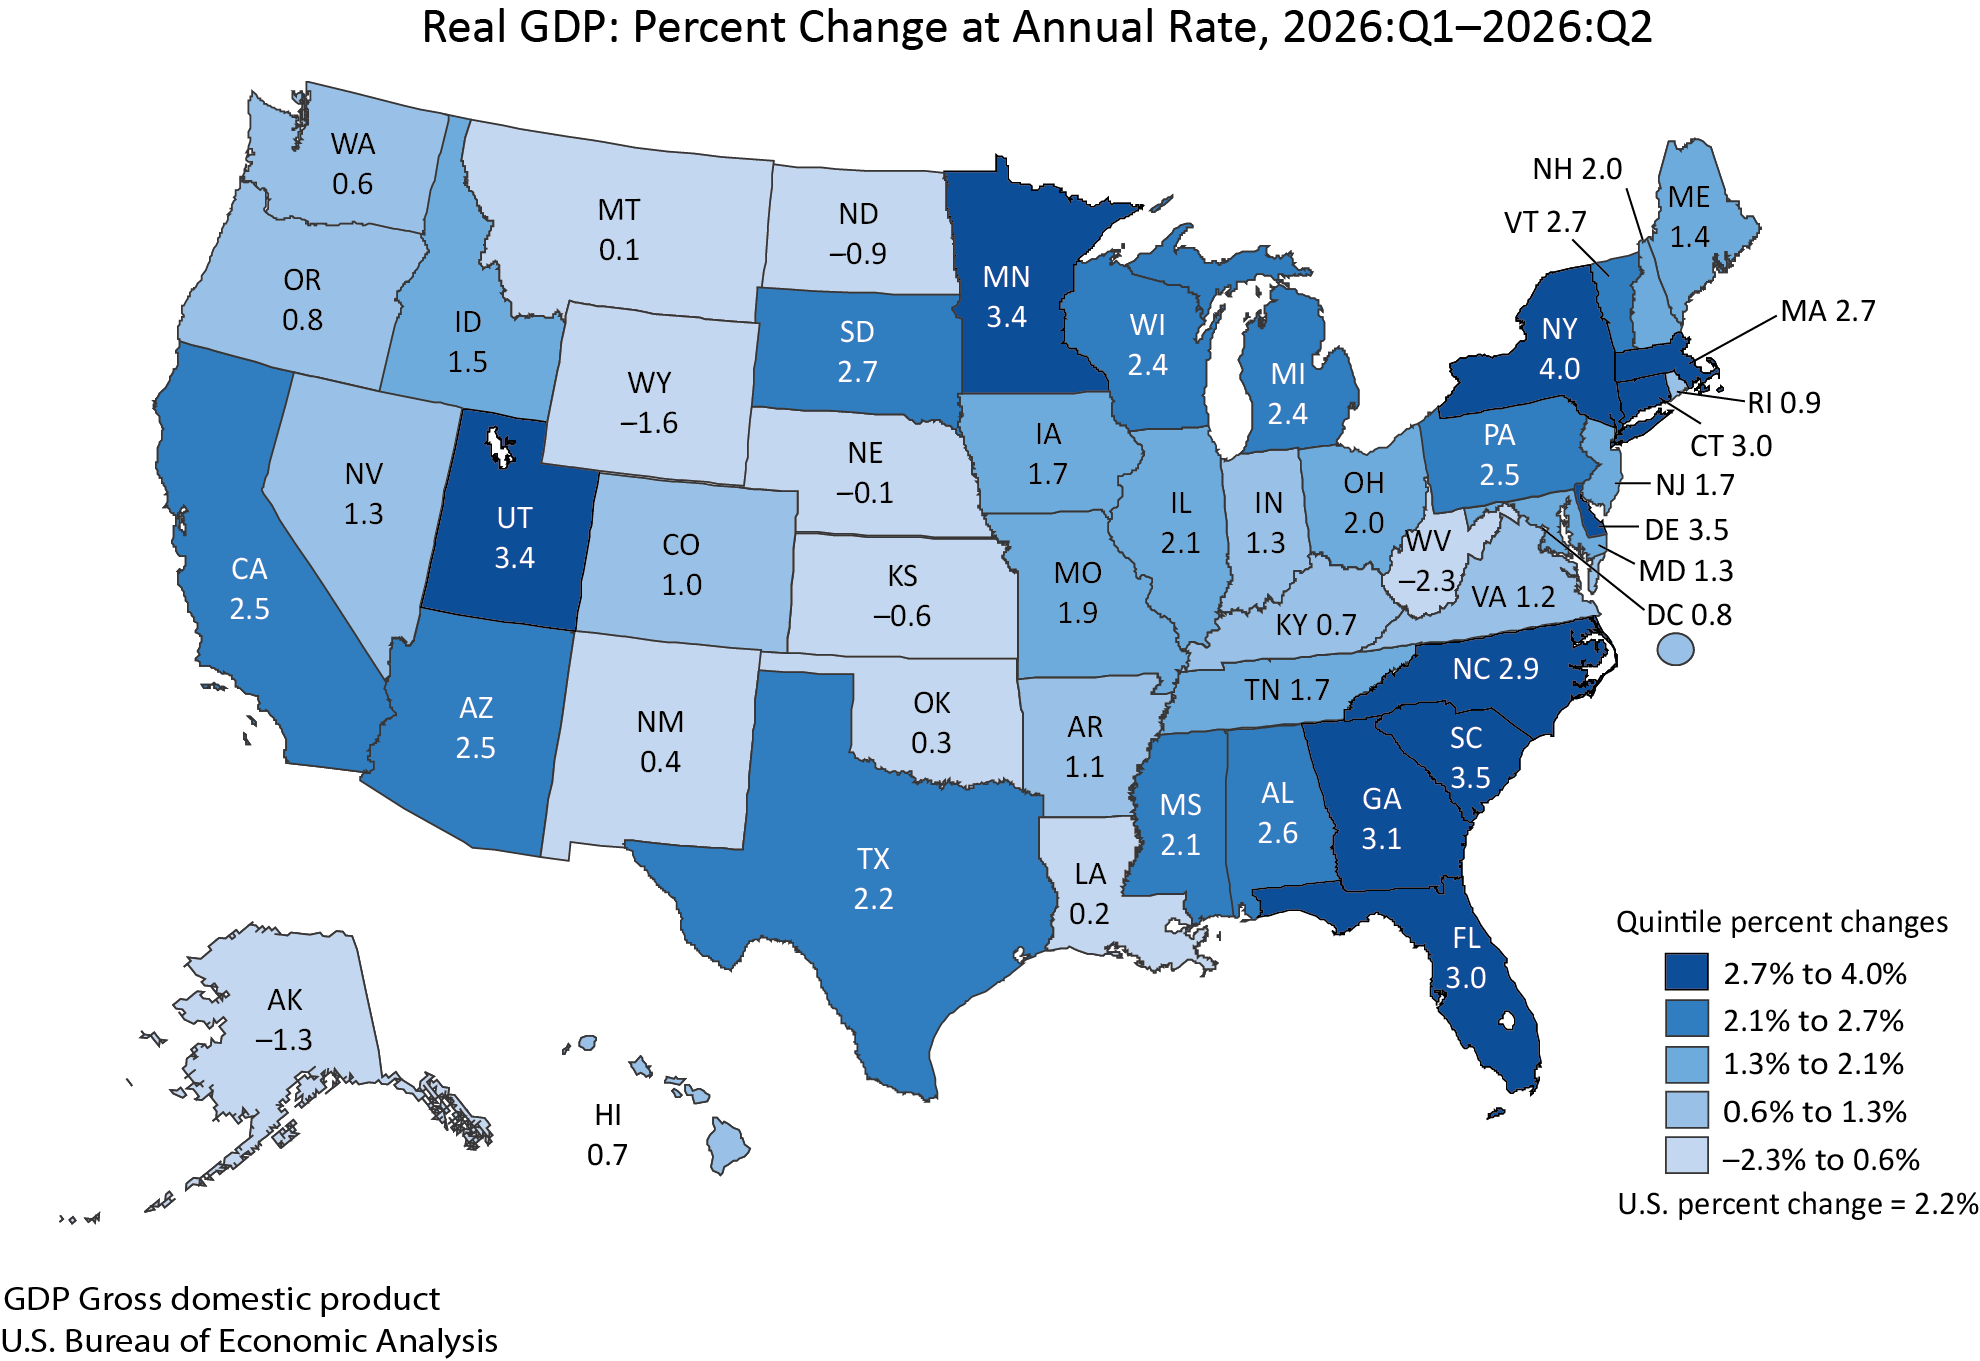
In New York and Delaware, the finance and insurance sector was the primary driver of GDP growth. Conversely, mining played a significant role in the economic declines observed in West Virginia and Wyoming. These regional differences highlight the diverse economic structures and industry concentrations across the United States.
Personal Income Trends Across the States
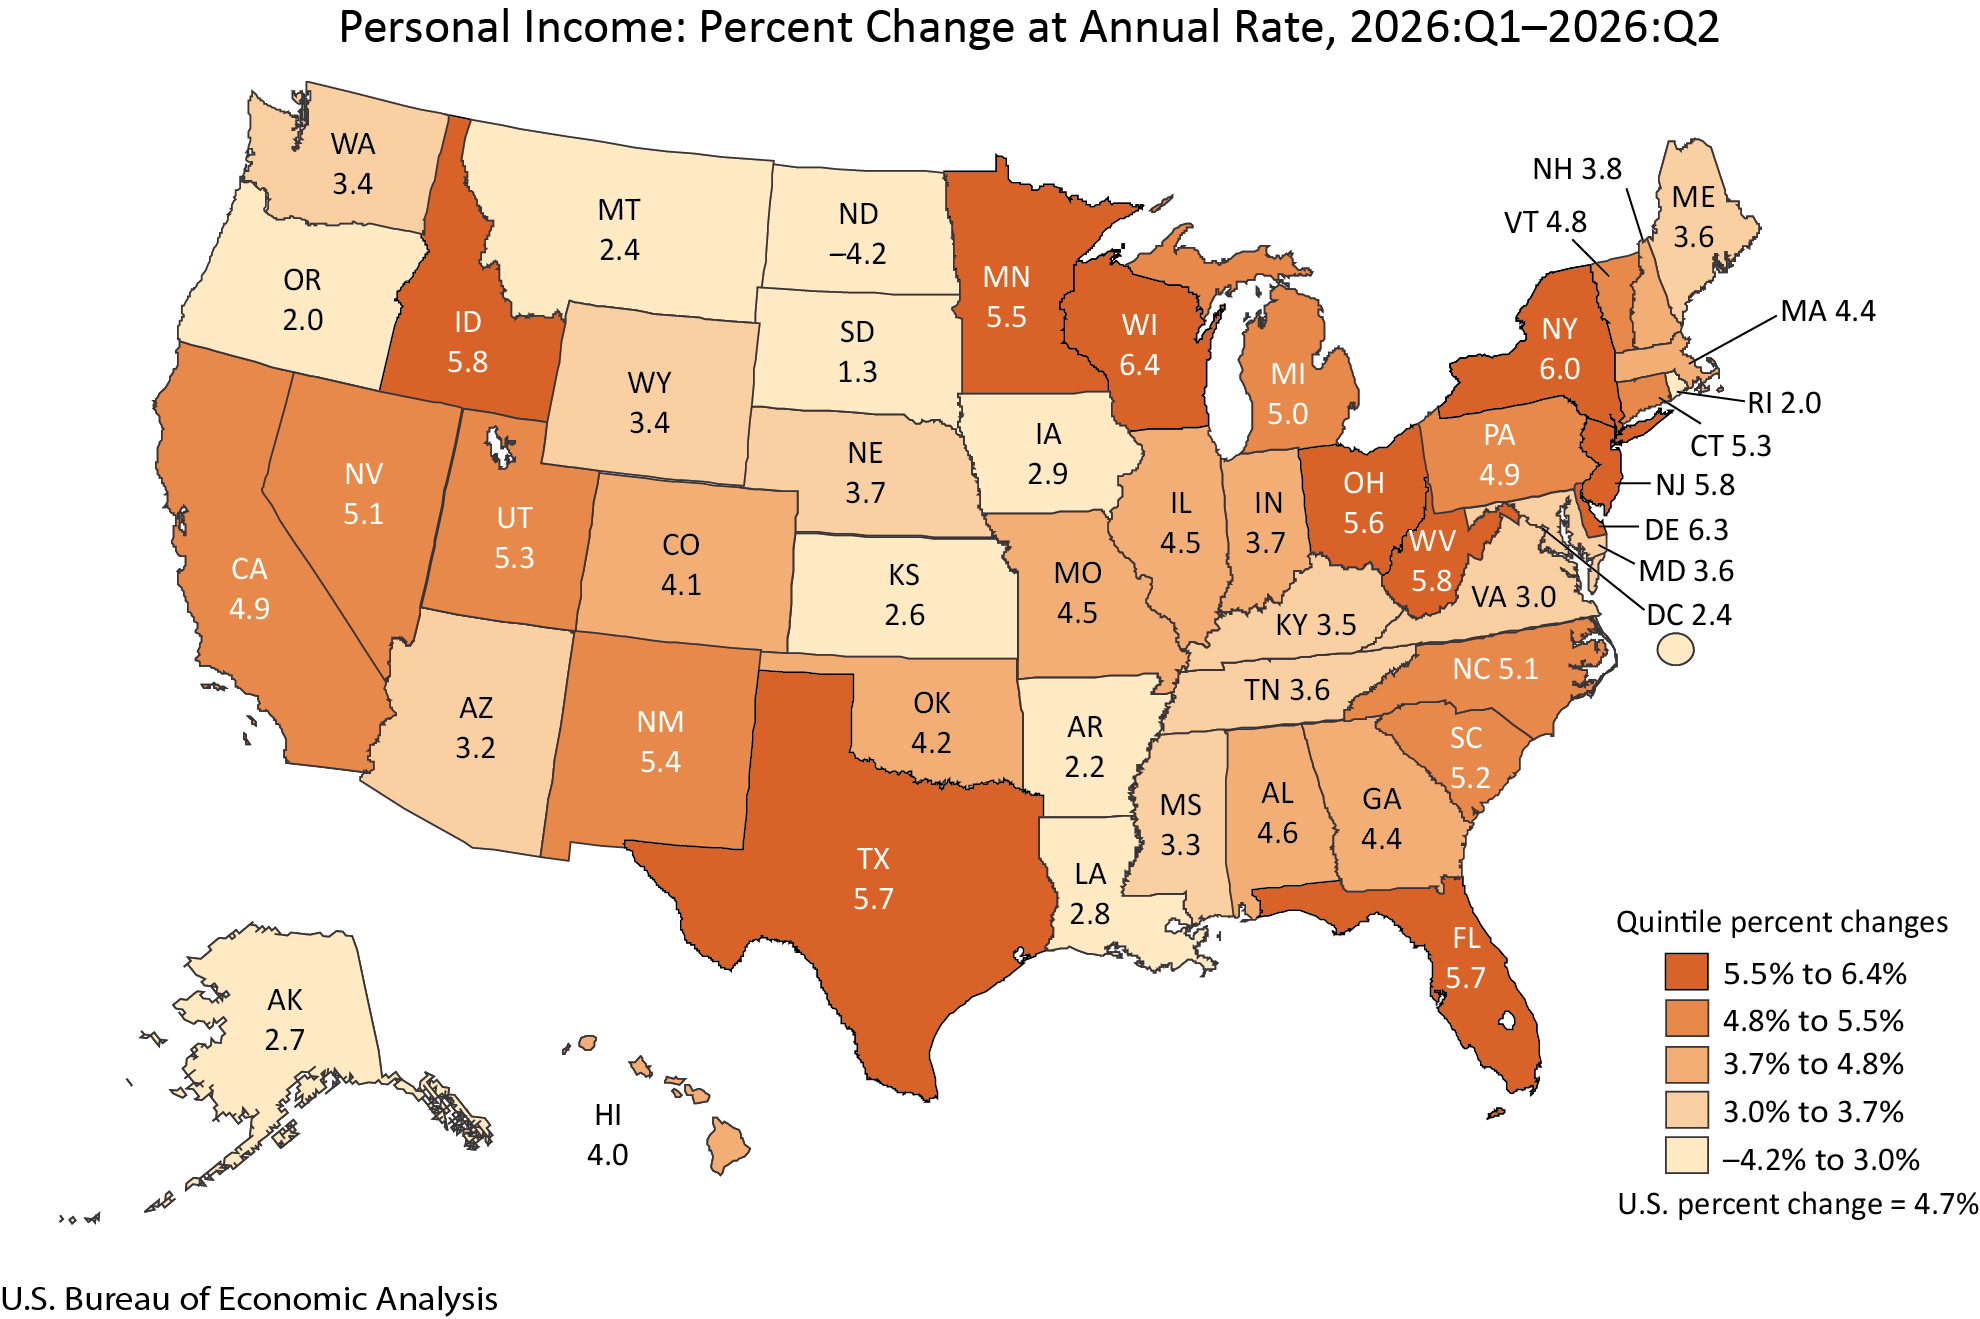
Personal income, a crucial indicator of household financial well-being, also showed varied growth patterns at the state level. Nationally, current-dollar personal income increased by $314.3 billion, or 4.7 percent at an annual rate. Personal income growth was widespread, with 49 states and the District of Columbia experiencing increases. Wisconsin reported the highest growth rate at 6.4 percent, while North Dakota saw a significant decline of 4.2 percent.
Earnings, which comprise compensation and proprietors’ income, increased in 48 states and the District of Columbia. Minnesota reported the highest earnings growth at 7.3 percent, while North Dakota experienced the sharpest decline at 9.3 percent. Personal current transfer receipts, such as government benefits, increased in 48 states, with Wisconsin showing the largest increase at 13.0 percent. Oregon, however, saw a decline of 3.9 percent in transfer receipts. Property income, including dividends, interest, and rent, demonstrated broad-based growth, increasing in all 50 states and the District of Columbia.
Consumer Spending Patterns by State
Personal Consumption Expenditures (PCE), a measure of consumer spending, also exhibited state-level variations. In 2025, current-dollar PCE increased by 5.3 percent nationally, with growth observed in 14 of the 16 major categories tracked by the BEA. At the state level, PCE increased in all 50 states and the District of Columbia. Florida recorded the highest growth rate at 7.0 percent, while California saw a more modest increase of 4.2 percent. Health care and housing and utilities were identified as the leading contributors to PCE increases in most states, including Florida, underscoring their importance in household budgets.
Looking Ahead: Upcoming Data Releases
The U.S. Bureau of Economic Analysis has scheduled its next major release for October 29, 2026, at 8:30 a.m. EDT, which will feature the advance estimate for GDP in the third quarter of 2026. This upcoming report will provide further insights into the economy’s trajectory and may incorporate preliminary data that offers an early glimpse into the performance of the economy during the July to September period. Economic observers will be keenly watching to see if the momentum from the second quarter continues or if any new trends emerge.
Technical Notes and Data Revisions
The BEA’s "Technical Notes" section provides crucial context for understanding the data and its revisions. The upward revision of 0.7 percentage point to the second quarter’s real GDP growth was primarily attributed to stronger-than-expected performance in investment, consumer spending, and government spending. This highlights the BEA’s iterative process of data collection and refinement, where initial estimates are subject to adjustments as more comprehensive information becomes available. The key source data and assumptions table, linked within the report, offers detailed insights into the components driving these revisions.
The BEA’s commitment to transparency and accuracy is further demonstrated through its annual updates of the National and Regional Economic Accounts. These updates are vital for ensuring that the economic data reflect the most current and complete information available. The 2026 annual update, for instance, incorporated data from the first quarter of 2021 through the first quarter of 2026, leading to revisions across various economic indicators. Such comprehensive reviews are essential for maintaining the integrity and reliability of economic statistics.
The U.S. economy in the second quarter of 2026 demonstrated resilience and sustained growth, driven by a combination of robust consumer spending, increased investment, and a positive contribution from exports. While certain sectors faced challenges, the overall economic picture painted by the BEA’s final estimates is one of continued expansion. The upward revisions to both first and second quarter GDP figures suggest a stronger economic foundation than previously understood, providing a positive outlook as the nation moves into the latter half of the year. The ongoing analysis of regional performance and inflationary trends will remain critical for policymakers and market participants alike.