
 Lana Rhoades
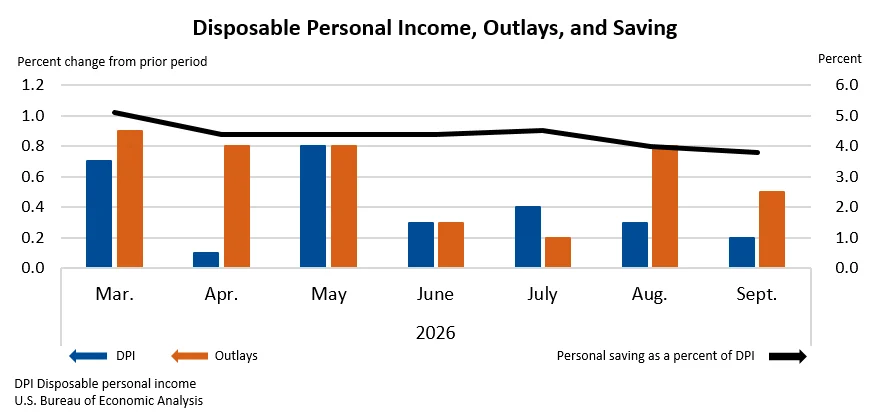
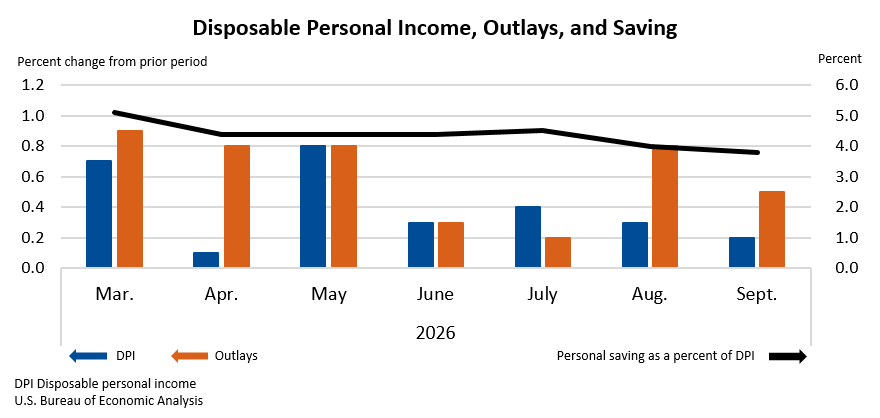
Washington D.C. – Personal income in the United States registered a modest increase of $54.5 billion, or 0.2 percent, in September, according to the latest estimates released by the U.S. Bureau of Economic Analysis (BEA). This uptick signals continued, albeit gradual, growth in household earnings. Accompanying this rise in overall income was a corresponding increase in disposable personal income (DPI), the amount households have available for spending or saving after taxes, which grew by $52.7 billion, also representing a 0.2 percent increase.
Consumer spending, a critical engine of the U.S. economy, demonstrated a more robust expansion. Personal consumption expenditures (PCE), which encompass spending on both goods and services, surged by $113.1 billion, marking a significant 0.5 percent rise. This divergence between the pace of income growth and consumer spending suggests that households are increasingly drawing on savings or utilizing credit to fuel their consumption.
The BEA data further indicates that personal outlays, a broader measure including PCE, personal interest payments, and personal current transfer payments, collectively rose by $113.0 billion in September. Despite the increased spending, personal saving remained substantial, totaling $911.1 billion. However, the personal saving rate, calculated as personal saving as a percentage of disposable personal income, dipped to 3.8 percent. This decline in the saving rate, coupled with the stronger growth in spending compared to income, points to a dynamic where consumers are actively engaging in the marketplace, potentially influenced by factors such as inflation, interest rates, and evolving economic confidence.
The primary drivers behind the increase in current-dollar personal income during September were identified as growth in compensation and an uptick in government social benefits. While specific details on the composition of compensation increases were not immediately available in the released summary, such growth often reflects rising wages and salaries, potentially influenced by a tight labor market or sector-specific demand. The contribution of government social benefits can encompass a range of programs, and their increase could be attributed to policy adjustments or cyclical factors affecting program utilization.
Consumer Spending Landscape: A Tale of Goods and Services
The substantial increase in current-dollar PCE was notably propelled by a significant rise in spending on services, which accounted for $78.1 billion of the total $113.1 billion increase. Spending on goods, while also increasing, contributed a smaller portion of $35.1 billion. This pattern suggests a continuing shift in consumer priorities, with a greater allocation of resources towards experiences, travel, healthcare, and other service-oriented activities. This trend has been observed in recent economic cycles as pandemic-related restrictions eased, and consumers have prioritized services over durable goods, which saw a surge during periods of lockdown.
While nominal spending on both goods and services saw increases, the picture becomes more nuanced when examining real terms, which adjust for inflation. Real PCE, representing the volume of goods and services consumed, saw a more subdued increase of $2.6 billion, translating to less than 0.1 percent at a monthly rate. This indicates that a considerable portion of the nominal increase in PCE was driven by price appreciation rather than an expansion in the quantity of goods and services purchased.
Inflationary Pressures Persist in Consumer Spending
The implications of inflation on consumer purchasing power are further underscored by the PCE price index. For September, the PCE price index rose by 0.5 percent from the preceding month. This broad-based inflation measure suggests that the cost of goods and services consumed by households continued to climb. When essential items like food and energy are excluded, the core PCE price index, often closely watched by policymakers for underlying inflation trends, increased by 0.3 percent in September. While this core reading is more moderate than the overall PCE price index, it still indicates persistent inflationary pressures within the economy.
Looking at a year-over-year perspective, the PCE price index for September showed an increase of 3.6 percent compared to the same month in the previous year. The core PCE price index, excluding food and energy, also saw a notable rise of 3.1 percent from one year ago. These figures highlight the sustained inflationary environment that households have been navigating, impacting their real purchasing power and influencing their spending and saving decisions.
Historical Context and Economic Indicators
To fully appreciate the September figures, it is beneficial to consider the preceding months. In August, current-dollar personal income had grown by 0.3 percent, while disposable personal income also saw a 0.3 percent increase. Real disposable income, however, remained flat at 0.0 percent, and real PCE had expanded by 0.5 percent. The PCE price index had risen by 0.3 percent in August, with the core PCE price index also showing a 0.3 percent increase.
The shift from August to September reveals a slight deceleration in nominal income growth (from 0.3% to 0.2%) and a similar trend in disposable personal income. Conversely, consumer spending in nominal terms saw a notable acceleration in growth (from 0.9% to 0.5% for current-dollar PCE), while real PCE growth softened considerably (from 0.5% to effectively flat at 0.0%). This comparison underscores the increasing role of price increases in driving nominal spending figures in September.
The personal saving rate’s decline to 3.8 percent in September, from previous levels which have historically been higher, suggests a potential drawdown of accumulated savings from earlier periods. During the height of the pandemic, enhanced government stimulus and reduced spending opportunities led to a significant build-up of household savings. As the economy normalized and inflationary pressures persisted, households may be utilizing these savings to maintain their consumption levels, a factor that could influence the sustainability of current spending patterns.
Revisions and Data Refinements
The BEA also noted that estimates for July and August have undergone revisions. These adjustments were primarily based on updated data from the U.S. Bureau of Labor Statistics (BLS) for the Current Employment Statistics (CES) survey, which provides crucial information on employment, hours, and earnings. Additionally, revisions to personal interest income were informed by newly available data from the U.S. Bureau of the Fiscal Service concerning monetary interest. Such revisions are a standard part of the statistical process, ensuring that economic data reflects the most up-to-date and comprehensive information available.
Analyzing the Implications: Consumer Behavior and Economic Outlook
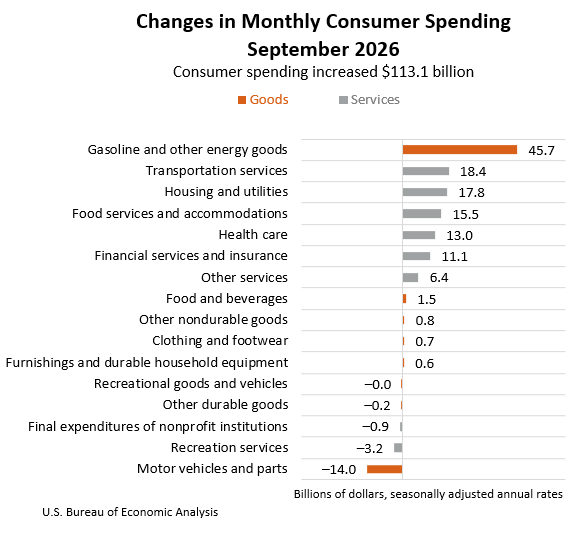
The September data presents a mixed picture of the U.S. economy. On one hand, the continued rise in personal income and a robust increase in consumer spending are positive indicators of economic activity. Consumer spending represents a significant portion of the Gross Domestic Product (GDP), and its strength is vital for sustained economic growth. The notable surge in spending on services suggests resilience in demand for these sectors, which are often labor-intensive and contribute significantly to employment.
However, the widening gap between nominal spending growth and real spending growth, coupled with persistent inflation, raises questions about the long-term sustainability of current consumption levels. If consumers are increasingly relying on savings or credit to fund their purchases, this could create vulnerabilities in the future. A continued decline in the personal saving rate, especially if not matched by a commensurate increase in income, could signal a period of belt-tightening for households down the line.
The Federal Reserve closely monitors PCE price index data, particularly the core component, as a key indicator for its monetary policy decisions. The persistent, albeit moderating, inflation measured by the PCE price index suggests that the Federal Reserve may maintain a cautious approach regarding interest rate policy, aiming to bring inflation back to its target level without unduly stifling economic growth.
Expert Commentary and Potential Reactions
While the BEA report is purely statistical, economists and market analysts will undoubtedly be dissecting these figures for insights into consumer behavior and the broader economic trajectory. One might infer that economists focusing on consumer resilience would highlight the strong spending on services as evidence of a robust consumer base. Conversely, those concerned about inflation and household financial health might point to the declining saving rate and the impact of rising prices on real purchasing power as areas of caution.
For instance, a statement from a representative of a consumer advocacy group might express concern about the rising cost of living, urging policymakers to address inflationary pressures that erode household budgets. On the other hand, an analyst from a financial institution might view the increased spending as a positive signal for corporate earnings, particularly for companies in the services sector.
Looking Ahead: The Path Forward
The data released today provides a snapshot of the U.S. economy in September. The next Personal Income and Outlays report, scheduled for release on November 25, 2026, at 8:30 a.m. EST, will offer insights into October’s economic performance. This subsequent report will be crucial in determining whether the trends observed in September – a modest income growth, robust nominal spending, and persistent inflation – represent a temporary phase or the emergence of new economic patterns.
The BEA’s commitment to providing detailed data through its Interactive Data Application allows for deeper dives into specific components of personal income and outlays. Tables such as "Personal Income and Its Disposition" and "Percent Change From Preceding Period in Real PCE by Major Type of Product" will be invaluable for researchers and policymakers seeking to understand the nuances of these economic shifts. As the economy continues to navigate a complex global landscape, these timely and comprehensive data releases from the Bureau of Economic Analysis remain indispensable tools for informed decision-making and economic forecasting. The interplay between income, spending, saving, and inflation will continue to be a central focus as the year draws to a close and attention turns towards the economic outlook for the coming year.