
 Lana Rhoades
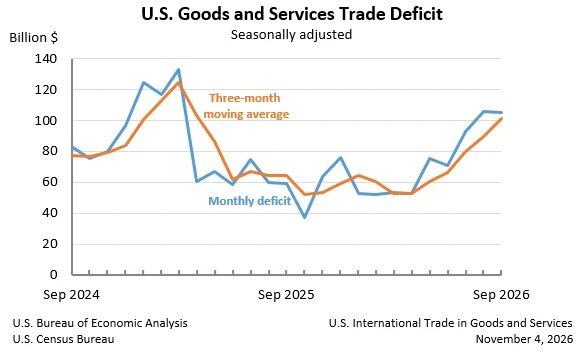
WASHINGTON D.C. – The United States recorded a goods and services deficit of $105.0 billion in September, a modest decrease of $0.7 billion from the revised August figure of $105.7 billion. This slight contraction, announced today by the U.S. Census Bureau and the U.S. Bureau of Economic Analysis, reflects a complex interplay of rising exports and imports, with notable shifts within the goods and services sectors. While the overall deficit showed a marginal improvement, underlying trends indicate a dynamic and evolving landscape of international trade for the nation.
Key Figures and Sectoral Performance
The September report indicates that U.S. exports reached $321.5 billion, a notable increase of $5.8 billion from the previous month. Concurrently, imports also climbed, reaching $426.6 billion, an expansion of $5.2 billion compared to August. This simultaneous growth in both exports and imports, while contributing to a larger overall trade volume, resulted in the marginal reduction of the deficit.
Digging deeper into the components, the decrease in the overall goods and services deficit was primarily driven by a $0.7 billion reduction in the goods deficit, which stood at $135.9 billion in September. This was partially offset by a slight decrease in the services surplus, which fell by less than $0.1 billion to $30.9 billion. The resilience of the services sector, which typically contributes positively to the U.S. trade balance, remains a key factor in moderating the overall deficit.
Year-to-Date Trends and Broader Economic Context
On a year-to-date basis, the goods and services deficit has shown a more significant contraction, decreasing by $92.4 billion, or 12.2 percent, compared to the same period in 2025. This broader perspective highlights a positive trend in the nation’s trade performance over the first nine months of the year. Exports have surged by $297.3 billion, an impressive 11.6 percent increase, while imports have also grown, albeit at a more moderate pace of $204.9 billion, or 6.2 percent. This divergence in growth rates between exports and imports is a key driver of the year-to-date deficit reduction.
The period leading up to September has seen a dynamic global economic environment. Inflationary pressures, supply chain adjustments, and evolving geopolitical landscapes have all contributed to fluctuating trade patterns. The U.S. economy, characterized by robust consumer demand and industrial activity, has continued to drive import volumes, while a strong dollar and increased global economic activity have supported export growth.
Analyzing the Monthly Dynamics: Exports and Imports in Detail
Exports:
The $5.8 billion increase in total exports to $321.5 billion in September was a composite of gains in both goods and services. Exports of goods alone climbed by $5.1 billion to reach $211.0 billion. This figure comprises an increase of $5.0 billion in goods on a Census basis, alongside a $0.1 billion rise in net balance of payments adjustments. The growth in goods exports suggests increased demand for American products in international markets.
Exports of services also demonstrated positive momentum, rising by $0.7 billion to $110.5 billion in September. This expansion in services exports, which include categories such as travel, transportation, and financial services, underscores the continued strength and competitiveness of the U.S. services sector on the global stage.
Imports:
The $5.2 billion rise in total imports to $426.6 billion in September was also a result of movements in both goods and services. Imports of goods increased by $4.4 billion to $346.9 billion. Within this category, imports of goods on a Census basis saw a substantial increase of $8.0 billion. However, this was partially tempered by a decrease of $3.6 billion in net balance of payments adjustments, leading to the net increase. The rise in goods imports indicates sustained domestic demand for foreign-produced goods.
Imports of services also experienced a modest uptick, growing by $0.8 billion to $79.7 billion in September. This indicates a continued outflow of U.S. dollars for services consumed by Americans from foreign providers.
Real Goods Deficit and Valuation Adjustments
A crucial aspect of trade data analysis involves differentiating between nominal and real values. The report highlights that the real goods deficit, adjusted for price changes and measured in 2017 dollars on a Census basis, actually increased by $3.5 billion, or 3.0 percent, to $119.5 billion in September. This contrasts with the nominal goods deficit, which saw a decrease. The reason for this divergence is attributed to a balance of payments adjustment for nonmonetary gold imports. This adjustment, as explained by the Bureau of Economic Analysis, accounts for the specific treatment of gold transactions in international trade statistics, demonstrating the complexities in accurately capturing the full economic picture.
Three-Month Moving Averages and Shifting Trends
While the monthly figures provide a snapshot, three-month moving averages offer a smoother perspective on underlying trade trends. For the three months ending in September, the average goods and services deficit rose by $11.3 billion to $101.2 billion. This increase in the three-month average indicates a somewhat widening deficit over this more extended period, suggesting that the slight improvement in September might be a short-term fluctuation rather than a sustained reversal of trend.
Year-over-year, the average goods and services deficit has also increased significantly, by $36.5 billion from the three months ending in September 2025. This suggests that, despite the year-to-date improvements, the U.S. trade balance has faced persistent headwinds when viewed over longer horizons.
Trade Balances by Country and Area
The report also provides a detailed breakdown of trade balances with key trading partners. In September, the U.S. recorded surpluses, in billions of dollars, with:
- Netherlands ($7.7)
- South and Central America ($6.2)
- United Kingdom ($3.0)
- Hong Kong ($2.5)
- Australia ($2.1)
- Brazil ($1.1)
- Singapore ($0.7)
- Saudi Arabia ($0.5)
- Belgium ($0.2)
Conversely, significant deficits were observed with several major economies, including:
- Mexico ($28.7)
- Vietnam ($25.3)
- Taiwan ($21.9)
- China ($17.9)
- European Union ($14.2)
- South Korea ($12.2)
- Germany ($7.9)
- Italy ($6.3)
- Malaysia ($5.3)
- Japan ($4.8)
- India ($4.5)
- Canada ($4.4)
- Ireland ($3.0)
- Switzerland ($1.3)
- France ($1.3)
- Israel ($0.7)
These country-specific figures highlight the diverse nature of U.S. trade relationships and the varying impacts on the national trade balance. The persistent deficits with key Asian manufacturing hubs and the European Union underscore ongoing challenges in achieving a more balanced trade posture with these regions.
Revisions and Data Transparency
The U.S. Census Bureau and the Bureau of Economic Analysis also provided details on revisions to August trade data. While specific figures for these revisions were not fully elaborated in the provided text, such adjustments are standard practice in economic reporting, reflecting the incorporation of updated information and methodologies. These revisions are crucial for maintaining the accuracy and reliability of economic indicators.
Implications and Future Outlook
The September trade data presents a mixed picture. The slight narrowing of the overall deficit offers a degree of positive news, particularly in the context of ongoing efforts to manage the nation’s trade balance. The growth in exports, both in goods and services, is a testament to the competitiveness of American industries and the resilience of global demand.
However, the increase in the three-month moving averages and the significant year-over-year widening of the average deficit suggest that underlying pressures contributing to a larger trade imbalance persist. Factors such as global economic growth differentials, currency exchange rates, and ongoing supply chain adjustments will continue to shape U.S. trade performance.
The divergence between the nominal and real goods deficit in September, driven by adjustments for nonmonetary gold, underscores the importance of analyzing trade data with a nuanced understanding of valuation and statistical methodologies.
Looking ahead, the next release of U.S. International Trade in Goods and Services data, scheduled for December 8, 2026, will provide further insights into October’s trade performance. Market participants and policymakers will be closely monitoring these figures for any signs of sustained improvement or further deterioration in the U.S. trade balance. The dynamic nature of international trade suggests that continued vigilance and adaptation will be essential for navigating the complex global economic landscape.
The detailed data tables and explanations are available on the websites of the U.S. Census Bureau and the U.S. Bureau of Economic Analysis, providing a comprehensive resource for understanding the intricacies of U.S. international trade.