Lana Rhoades
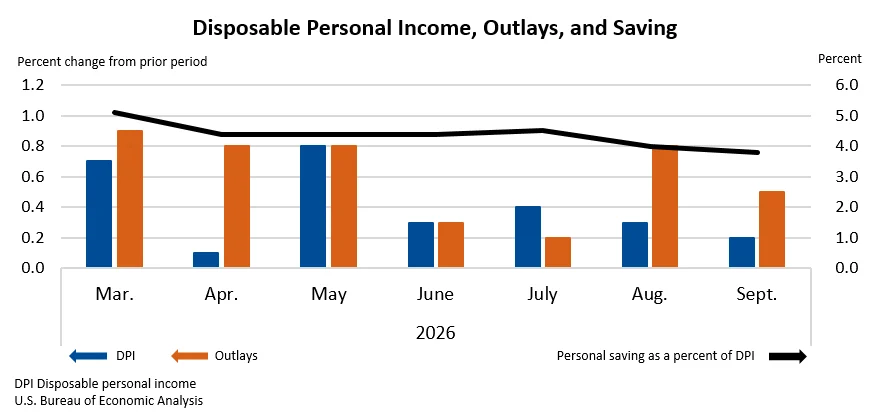
Personal income experienced a modest increase of $54.5 billion, or 0.2 percent, in September, according to the latest estimates from the U.S. Bureau of Economic Analysis (BEA). This growth indicates a continued, albeit tempered, expansion in the nation’s economic output. Disposable personal income (DPI), which represents personal income after taxes, also saw a similar uptick of $52.7 billion, or 0.2 percent. This suggests that the increased income was largely available for consumers to spend or save. Concurrently, personal consumption expenditures (PCE), a key measure of consumer spending, surged by a more substantial $113.1 billion, marking a 0.5 percent rise. This divergence between income growth and spending growth highlights a scenario where consumers are drawing down on savings or increasing their debt to fuel current consumption.
The BEA data further reveals that personal outlays, encompassing PCE, personal interest payments, and personal current transfer payments, rose by $113.0 billion in September. This comprehensive measure of consumer spending underscores the robust demand driving economic activity. Despite the increased spending, personal saving remained at a considerable $911.1 billion. However, the personal saving rate, calculated as personal saving as a percentage of DPI, dipped to 3.8 percent. This decline from previous periods suggests a shift in consumer behavior, with a greater proportion of disposable income being allocated to consumption rather than being set aside.
The primary drivers behind the increase in current-dollar personal income for September were identified as growth in compensation and an uptick in government social benefits. Compensation, which includes wages and salaries, benefits, and other forms of employee pay, has been a consistent contributor to income growth. The increase in government social benefits, which can include programs like Social Security, unemployment benefits, and other transfers, suggests a continued role for government support in bolstering household incomes.
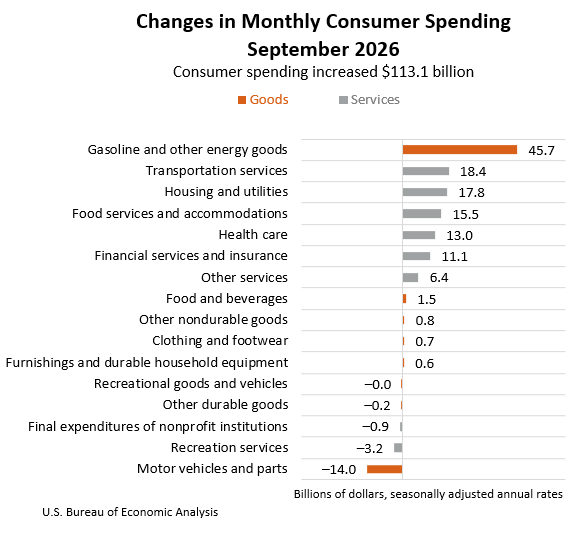
Examining the components of personal consumption expenditures, the $113.1 billion increase in current-dollar PCE was significantly influenced by spending on both goods and services. Spending on goods rose by $35.1 billion, while spending on services experienced a more pronounced increase of $78.1 billion. This trend indicates a growing preference for services-based consumption, which can range from healthcare and education to entertainment and travel. The robust growth in services spending is a positive signal for sectors heavily reliant on consumer demand for non-tangible products.
In real terms, adjusted for inflation, personal consumption expenditures (PCE) increased by a more modest $2.6 billion, translating to less than a 0.1 percent monthly rate. This indicates that while nominal spending has grown considerably, the real purchasing power of consumers has seen only marginal expansion. The discrepancy between nominal and real PCE growth is largely attributable to inflationary pressures.
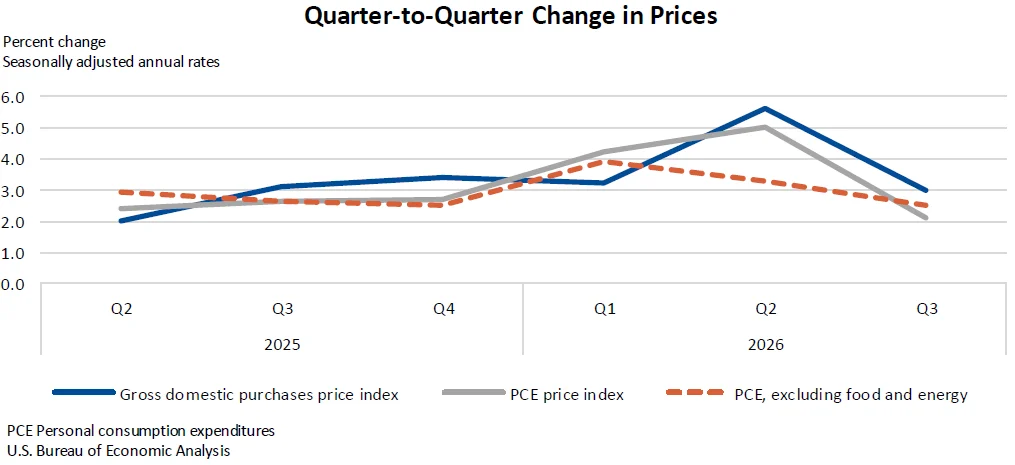
The Personal Consumption Expenditures (PCE) price index, a critical gauge of inflation as perceived by consumers, saw a 0.5 percent increase in September from the preceding month. This figure is particularly noteworthy as it indicates a persistent upward trend in the cost of goods and services. Furthermore, when excluding the volatile categories of food and energy, the core PCE price index, which is closely monitored by the Federal Reserve for its insights into underlying inflation trends, rose by 0.3 percent. This suggests that inflationary pressures are not solely confined to energy and food prices but are also present in a broader range of goods and services.
On an annual basis, the PCE price index for September exhibited a 3.6 percent increase compared to the same month in the previous year. This year-over-year inflation rate underscores the sustained pressure on consumer budgets. The core PCE price index, excluding food and energy, also demonstrated an increase of 3.1 percent from one year ago. While this is a lower figure than the overall PCE price index, it still signifies a significant rise in the cost of essential goods and services over the past year, potentially impacting consumer purchasing power and savings.
The BEA’s detailed data tables provide further insights into these trends. For instance, Table 2.6, "Personal Income and Its Disposition," illustrates the monthly percentage changes. In August, current-dollar personal income had grown by 0.3 percent, with disposable personal income also at 0.3 percent. However, real disposable income remained stagnant at 0.0 percent for August, and then contracted by -0.3 percent in September, signaling a potential erosion of purchasing power for some households. Current-dollar PCE showed a stronger 0.9 percent increase in August, followed by the 0.5 percent rise in September. Real PCE, however, saw a more moderate 0.5 percent increase in August and then barely budged at 0.0 percent in September, reinforcing the impact of inflation on real consumption. The PCE price index rose by 0.3 percent in August and then accelerated to 0.5 percent in September, with the core PCE price index remaining steady at 0.3 percent for both months.
Background and Context of Economic Indicators
The release of personal income and outlays data by the Bureau of Economic Analysis serves as a crucial barometer of the health of the U.S. economy. These statistics are closely watched by policymakers, businesses, and investors for their implications on consumer behavior, inflation, and overall economic growth. Personal income, in its broadest definition, encompasses all income received by individuals from all sources. This includes wages and salaries, proprietors’ income, rental income, personal interest and dividend income, and personal current transfer receipts.
Disposable personal income (DPI) is a particularly important subset, as it represents the income available to households for spending or saving after all taxes have been paid. Changes in DPI are a strong indicator of consumers’ ability to purchase goods and services. Personal consumption expenditures (PCE) represent the bulk of economic activity, reflecting the spending by households on goods and services. The BEA’s PCE data is a critical component of the Gross Domestic Product (GDP) calculation.
The personal saving rate, while currently at a moderate 3.8 percent, is a reflection of consumer confidence and financial prudence. Historically, higher saving rates can indicate economic caution, while lower rates might suggest greater confidence in future earnings or a willingness to finance current consumption through borrowing. The current trend of a declining saving rate, coupled with rising nominal spending, suggests that consumers may be feeling more optimistic about their immediate financial situations or are facing rising costs that necessitate drawing down on savings.
The PCE price index, especially its core component, is a primary inflation indicator for the Federal Reserve. The Fed targets an inflation rate of 2 percent, and deviations from this target can influence monetary policy decisions, such as interest rate adjustments. The observed increase in the PCE price index in September, both overall and excluding food and energy, signals that inflationary pressures remain a significant consideration for economic policymakers. This could lead to continued scrutiny of monetary policy to ensure price stability.
Revisions and Data Integrity
The BEA’s reports are not static, and the released figures are subject to revisions as more comprehensive data becomes available. In this release, estimates for July and August were updated to incorporate revised data from the U.S. Bureau of Labor Statistics (BLS) for the Current Employment Statistics (CES) program. This program provides monthly employment and payroll statistics. Additionally, revisions to personal interest income were informed by newly available data from the U.S. Bureau of the Fiscal Service, which tracks government financial operations. These revisions underscore the dynamic nature of economic data collection and the BEA’s commitment to providing the most accurate representation of economic activity.
The technical notes accompanying the release also highlight the importance of understanding the nuances of the data. For instance, the distinction between current-dollar and real figures is crucial. Current-dollar figures reflect the prices prevailing at the time of the transaction, while real figures are adjusted for inflation, providing a clearer picture of the volume of goods and services consumed or the actual purchasing power of income. The BEA’s commitment to transparency is further demonstrated by providing links to detailed data tables and an archive of historical data, allowing for in-depth analysis and comparison.
Broader Economic Implications and Analysis
The September report presents a mixed economic picture. On one hand, the increase in personal income, driven by compensation and social benefits, suggests a foundation of underlying economic strength and continued support for household finances. The robust growth in personal consumption expenditures, particularly in services, indicates resilient consumer demand, a vital engine for economic expansion. This sustained spending can contribute to business revenue, job creation, and overall economic output.
However, the widening gap between nominal spending growth and real spending growth, alongside persistent inflation as measured by the PCE price index, raises concerns. The fact that real PCE saw minimal growth in September, even as nominal PCE surged, implies that a significant portion of the increased spending is being absorbed by higher prices. This can erode the purchasing power of consumers, particularly for those whose incomes are not keeping pace with inflation. The decline in the personal saving rate to 3.8 percent, while still representing a substantial amount of savings, suggests a trend of consumers dipping into their reserves or increasing leverage to maintain their consumption levels in the face of rising costs.
The Federal Reserve will be closely examining these inflation figures. The continued rise in the PCE price index, especially the core component, could reinforce the central bank’s stance on maintaining a restrictive monetary policy. This might involve keeping interest rates elevated for longer than previously anticipated, which could have implications for borrowing costs for businesses and consumers, potentially slowing down future investment and spending.
From a business perspective, the strong demand for services presents opportunities for growth in sectors such as healthcare, leisure, hospitality, and professional services. However, businesses also face the challenge of managing rising input costs due to inflation, which could impact profit margins if they are unable to fully pass these costs onto consumers. The mixed signals from the data suggest a need for businesses to remain agile and adapt to evolving consumer spending patterns and inflationary environments.
The implications for households are also significant. While those with strong income growth may be able to absorb inflationary pressures, households with more stagnant incomes or those heavily reliant on fixed incomes could experience a decline in their real standard of living. The declining saving rate could also signal increased financial vulnerability for some households, particularly if unexpected expenses arise or if economic conditions deteriorate.
The next release of Personal Income and Outlays data, scheduled for November 25, 2026, will provide further clarity on October’s economic activity. This subsequent report will be crucial in determining whether the trends observed in September represent a temporary fluctuation or the continuation of a more sustained economic trajectory. Analysts will be looking for signs of whether income growth accelerates to outpace inflation, or if consumer spending begins to moderate as a result of persistent price pressures and potentially tighter monetary conditions. The interplay between income, spending, and inflation will continue to be a central theme in assessing the overall health and direction of the U.S. economy.