Layla Zulfa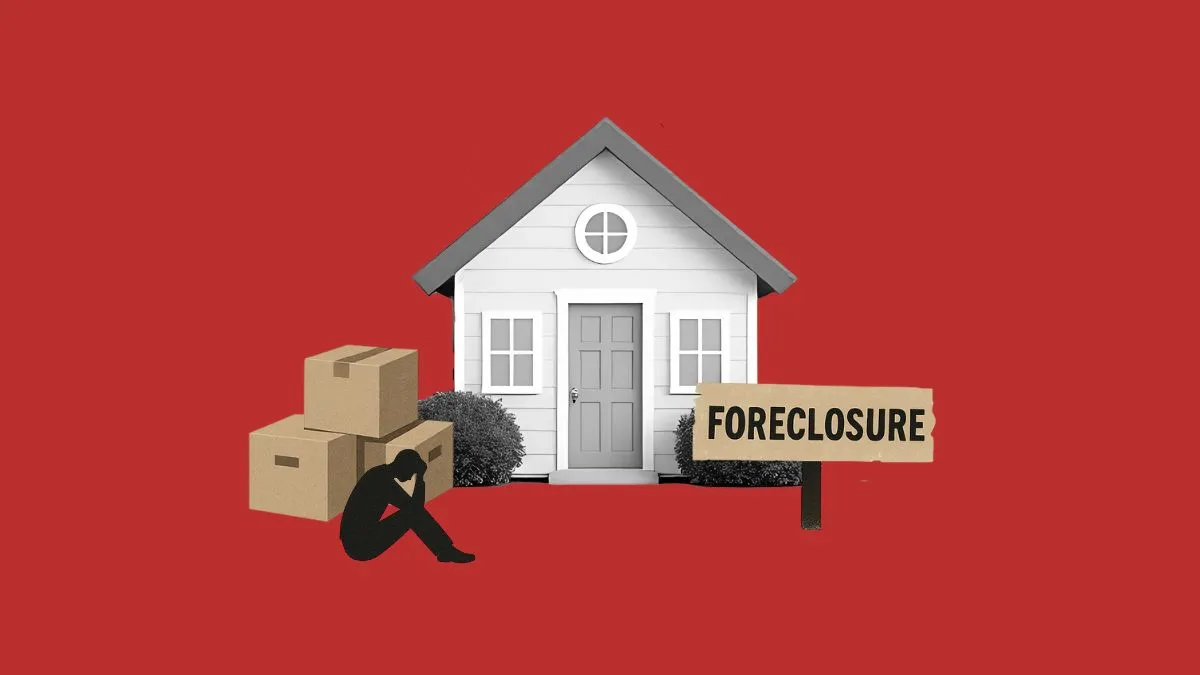
Recent reports indicating a 21% year-over-year increase in foreclosure data have ignited a wave of cautionary headlines and dire predictions about an impending housing market crash. This surge in negative sentiment, often amplified by social media and public figures, suggests a widespread financial struggle among American homeowners and portends a worsening economic landscape. The narrative of a looming crisis, reminiscent of the 2008 financial downturn, has permeated public discourse, prompting a closer examination of the underlying economic indicators and historical parallels.
Andrew Yang, a former presidential candidate, recently voiced concerns on the social media platform X, stating, "The pain is spreading to homeowners. Highest foreclosure rate in 7 years and it gets worse from here." His comment accompanied a repost of an article from a source often associated with pessimistic economic outlooks, highlighting the reach of this particular narrative. Similar anxieties have been circulating, with some predicting a foreclosure crisis exceeding that of 2008, fueled by the assertion that the U.S. is experiencing an unprecedented imbalance between sellers and buyers. However, a closer look at available data suggests this latter claim is inaccurate. In 2007, active home listings stood at approximately 4 million, a stark contrast to the current figure of around 1.56 million. Normal market conditions typically see between 2 million and 2.5 million active listings, underscoring a significant divergence from the conditions cited by alarmists.
Deconstructing the Foreclosure Crisis Narrative
To assess the validity of widespread foreclosure crisis claims, it is crucial to consult authoritative sources and analyze historical trends. The Federal Reserve Bank of New York’s Household Debt and Credit Report provides a robust framework for understanding these dynamics. A review of historical data, particularly from the mid-2000s, reveals a period of escalating foreclosure rates in the years leading up to 2008. This period was characterized by a significant credit boom, a surge in subprime lending, and a subsequent economic recession triggered by widespread job losses. The bankruptcy data from the early 2000s illustrates the scale and duration of the credit risk cycle at that time, which took years to build and required a massive expansion of credit.
In stark contrast, current economic conditions do not mirror this historical precedent. The preconditions for a crisis of that magnitude – a massive credit boom and widespread financial distress – are not demonstrably present today. Arguing for a foreclosure crisis today, based on current delinquency rates, would imply that the United States has been in a perpetual state of foreclosure crisis since World War II. Historically, a delinquency rate of 1% to 4% on mortgage loans has been a normal occurrence, with foreclosures happening annually as part of a functioning housing market. The current situation appears to represent a return to more normalized levels rather than an unprecedented crisis.
Furthermore, the impact of legislative changes enacted over the past two decades cannot be overlooked. The Bankruptcy Reform Law of 2005 and the Dodd-Frank Act, which introduced the Qualified Mortgage (QM) rule in 2014, have significantly altered the lending landscape and consumer protection mechanisms. These regulations have contributed to a more robust credit profile among homeowners, making large-scale defaults less likely. The distinction between "stock" (total existing loans) and "flow" (new loans and delinquencies) is also critical. With over 162 million individuals employed, the underlying economic stability provides a buffer against widespread financial collapse.
The Time Lag: Foreclosures to Market Supply
A key factor often overlooked in the "doom and gloom" narrative is the time it takes for foreclosures to translate into actual market supply. Weekly data on new home listings serves as a critical indicator in this regard. In periods of severe housing market distress, a surge in new listings, driven by distressed sellers, is a predictable outcome. However, the past five years have consistently shown some of the lowest new listing figures in history, irrespective of fluctuating interest rates. Even in the current period, new listings have not reached historical normal levels, which typically range between 80,000 to 100,000 units during peak seasonal months.
This stands in stark contrast to the housing bubble and credit crisis years. During that tumultuous period, new listings frequently ranged from 250,000 to 400,000 units per week for an extended duration. The current market’s limited new supply, despite potential economic headwinds, suggests a fundamental difference in market dynamics. This prolonged period of low inventory is a significant factor mitigating the potential impact of any increase in foreclosures. The supply side of the housing market remains constrained, which can absorb a greater number of distressed sales without triggering a widespread price collapse.
Homeowner Equity: A Crucial Bulwark
Another significant differentiator between the current market and the 2008 crisis is the substantial level of homeowner equity. In 2010, a staggering 23% of homes were "underwater," meaning their market value was less than the outstanding mortgage balance. This situation, coupled with a market experiencing a 17% price decline in 2007-2008 amidst a severe financial recession, led to a flood of distressed sellers.
Today, the landscape is vastly different. Approximately 40% of homes are owned outright, with no mortgage. Furthermore, down payment percentages have been at historic highs in recent years, indicating a more financially sound entry into homeownership for new buyers. The aggregate net equity held by homeowners is immense. The total Loan-to-Value (LTV) ratio, a measure of the mortgage balance relative to home value, which stood around 85% in 2008, is now a considerably lower 45.1%. This substantial equity provides homeowners with a significant financial cushion, enabling them to weather economic challenges and avoid being forced into distressed sales.
The structure of mortgage debt also plays a pivotal role. The prevalence of toxic, adjustable-rate mortgages and predatory lending practices that characterized the pre-2008 era has largely been replaced by 30-year fixed-rate mortgages. The majority of American homeowners currently hold these fixed-rate loans, with most securing rates below 6%. This stability in monthly payments, combined with annual wage growth, provides homeowners with greater financial flexibility. Unlike the previous crisis, where resetting mortgage rates led to payment shocks and widespread default, the current system is largely insulated from such payment volatility.
Conclusion: Understanding Foreclosure Dynamics
The data presented strongly suggests that the current discourse surrounding a widespread foreclosure crisis is largely unfounded. Foreclosure is not an immediate event but a protracted process. It begins with a series of delinquency notices (30, 60, 90, or 120 days), followed by a notice of default, and only then does a property enter the foreclosure pipeline, eventually leading to market supply. This process inherently involves a significant time lag.
The housing bubble years of the mid-2000s represent the first true foreclosure crisis in the United States post-World War II. While previous recessions were primarily job-loss driven, they did not trigger a national housing market collapse. That period remains the only time in over 80 years where national nominal home prices experienced a significant decline. The current market lacks the systemic vulnerabilities – the widespread toxic debt, the prevalence of adjustable-rate mortgages prone to payment shock, and the high LTV ratios – that fueled the 2008 crisis.
Equipped with this data, individuals can better discern between alarmist rhetoric and factual analysis. Understanding the intricate process of foreclosure, the role of legislative reforms, the significance of homeowner equity, and the historical context of market cycles provides a clearer perspective on the current housing landscape. By focusing on these fundamental economic indicators, it becomes evident that the conditions necessary for a crisis comparable to 2008 are not present. The recent uptick in foreclosure data, while a concern for affected individuals, appears to be a normalization rather than a harbinger of systemic collapse. The robust equity positions of homeowners and the structural stability of most mortgage debt serve as significant buffers, mitigating the potential for widespread distress.