
 Lana Rhoades
The U.S. Bureau of Economic Analysis (BEA) has released its latest comprehensive report on the outdoor recreation economy, revealing a significant economic powerhouse that contributed $696.7 billion to the nation’s current-dollar Gross Domestic Product (GDP) in 2024. This figure represents 2.4 percent of the total U.S. GDP, underscoring the sector’s substantial role in national economic output. The data, which spans all 50 states and the District of Columbia, offers a granular view of how outdoor activities drive economic growth, employment, and compensation across the country.
National Economic Performance of Outdoor Recreation
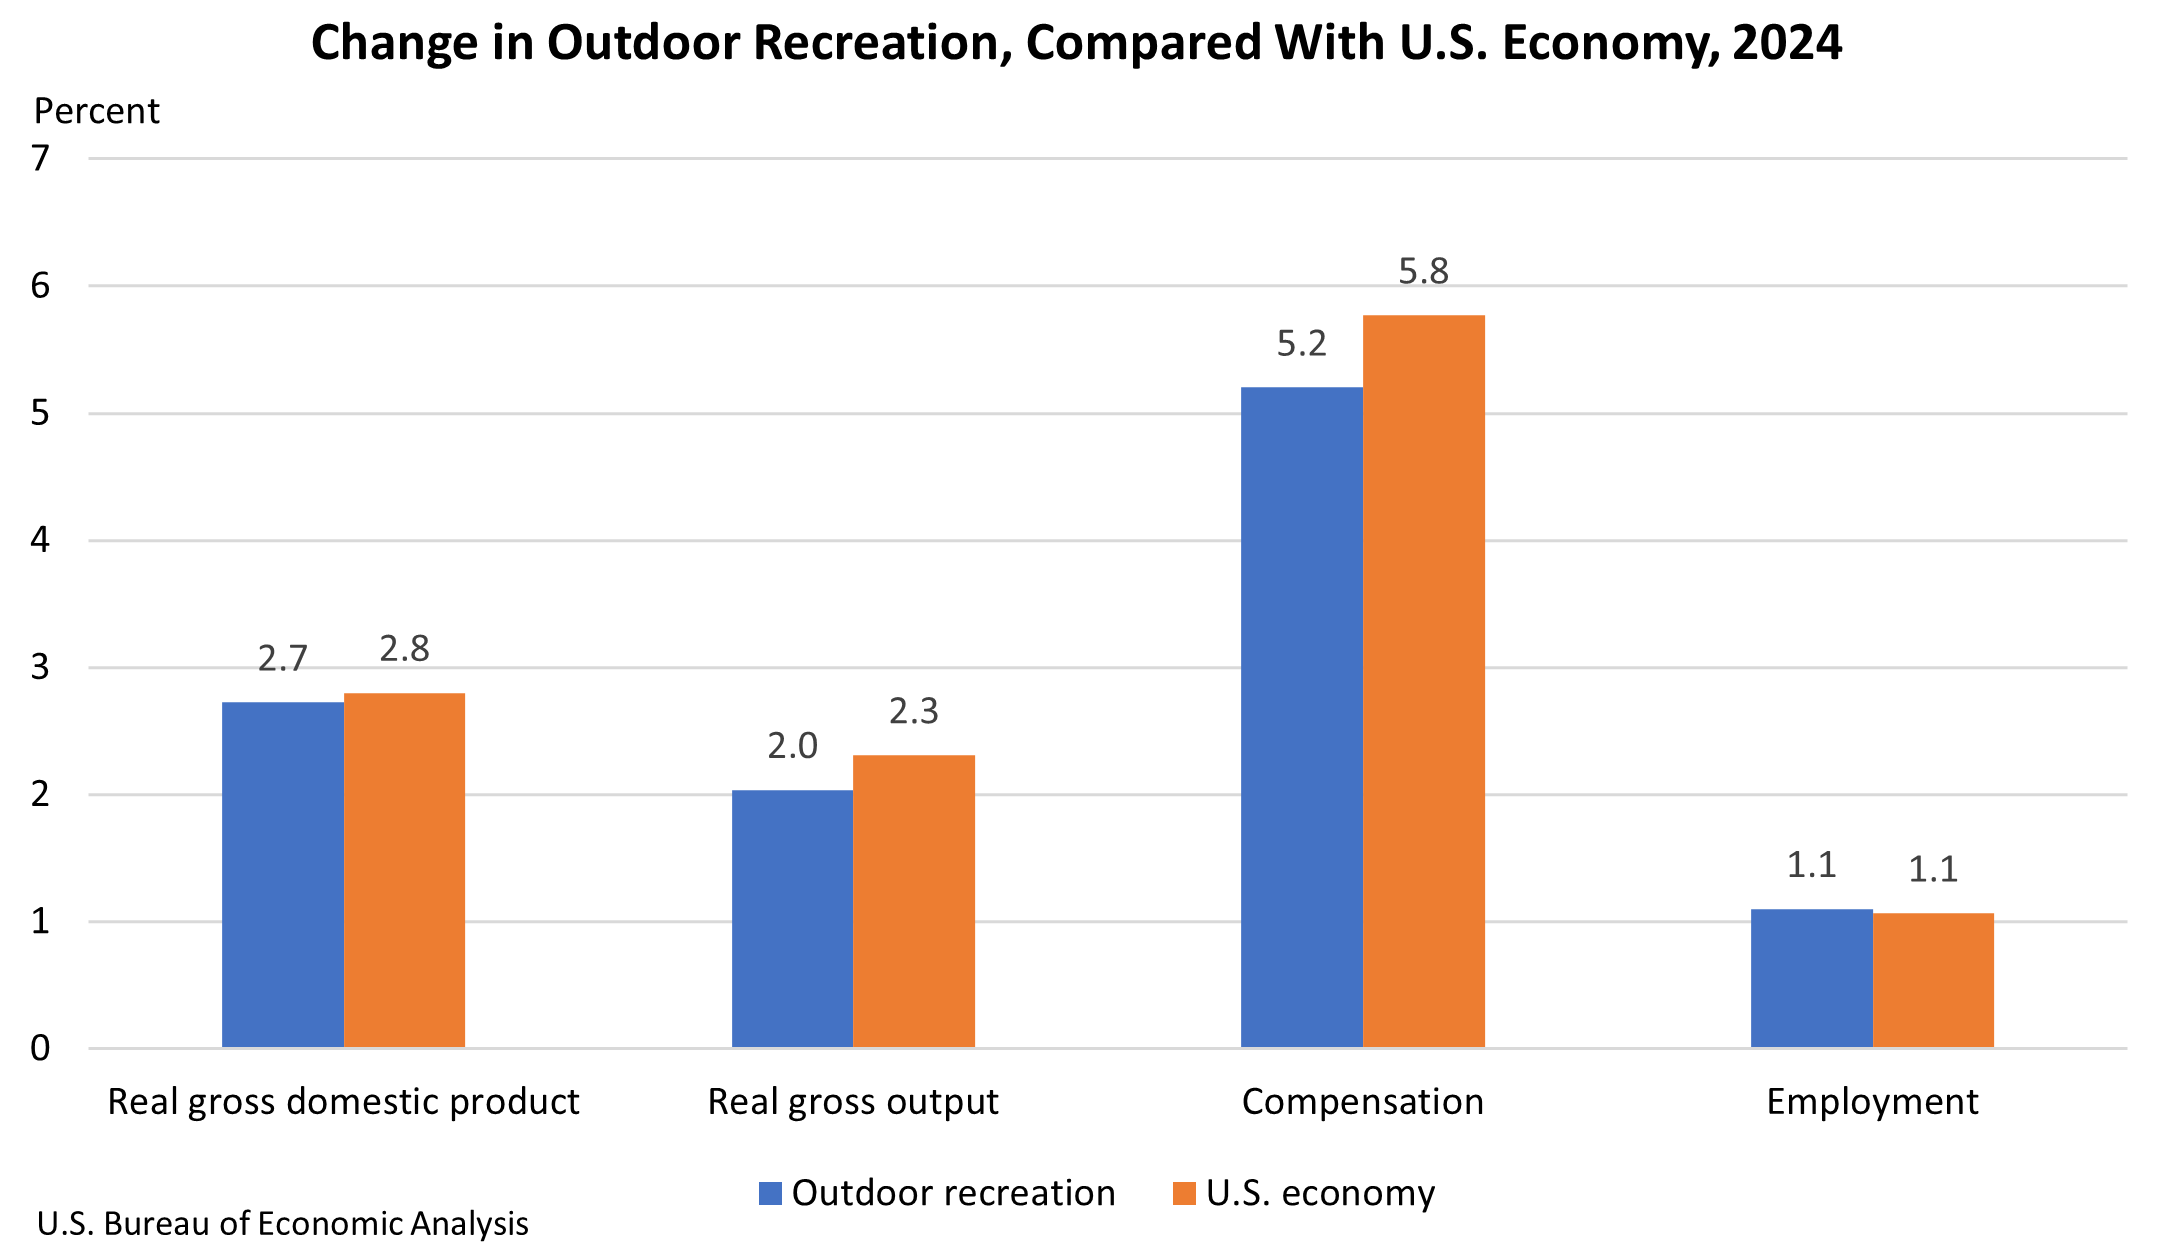
The BEA’s findings indicate that the inflation-adjusted (real) GDP for the outdoor recreation economy experienced a growth of 2.7 percent in 2024. While this growth rate is slightly below the 2.8 percent expansion of the overall U.S. economy, it still signifies a robust performance. This moderation follows a more significant surge of 5.3 percent observed in 2023, suggesting a recalibration after a period of heightened activity.
Beyond GDP, the sector’s gross output, which measures the total value of goods and services produced, saw a 2.0 percent increase. Compensation for individuals employed within the outdoor recreation sector rose by a notable 5.2 percent, outpacing the overall GDP growth. Employment within the sector also expanded, increasing by 1.1 percent. These figures collectively paint a picture of a dynamic and growing industry that not only generates substantial economic value but also provides increasing income and job opportunities.
State-Level Variations in Outdoor Recreation’s Economic Impact
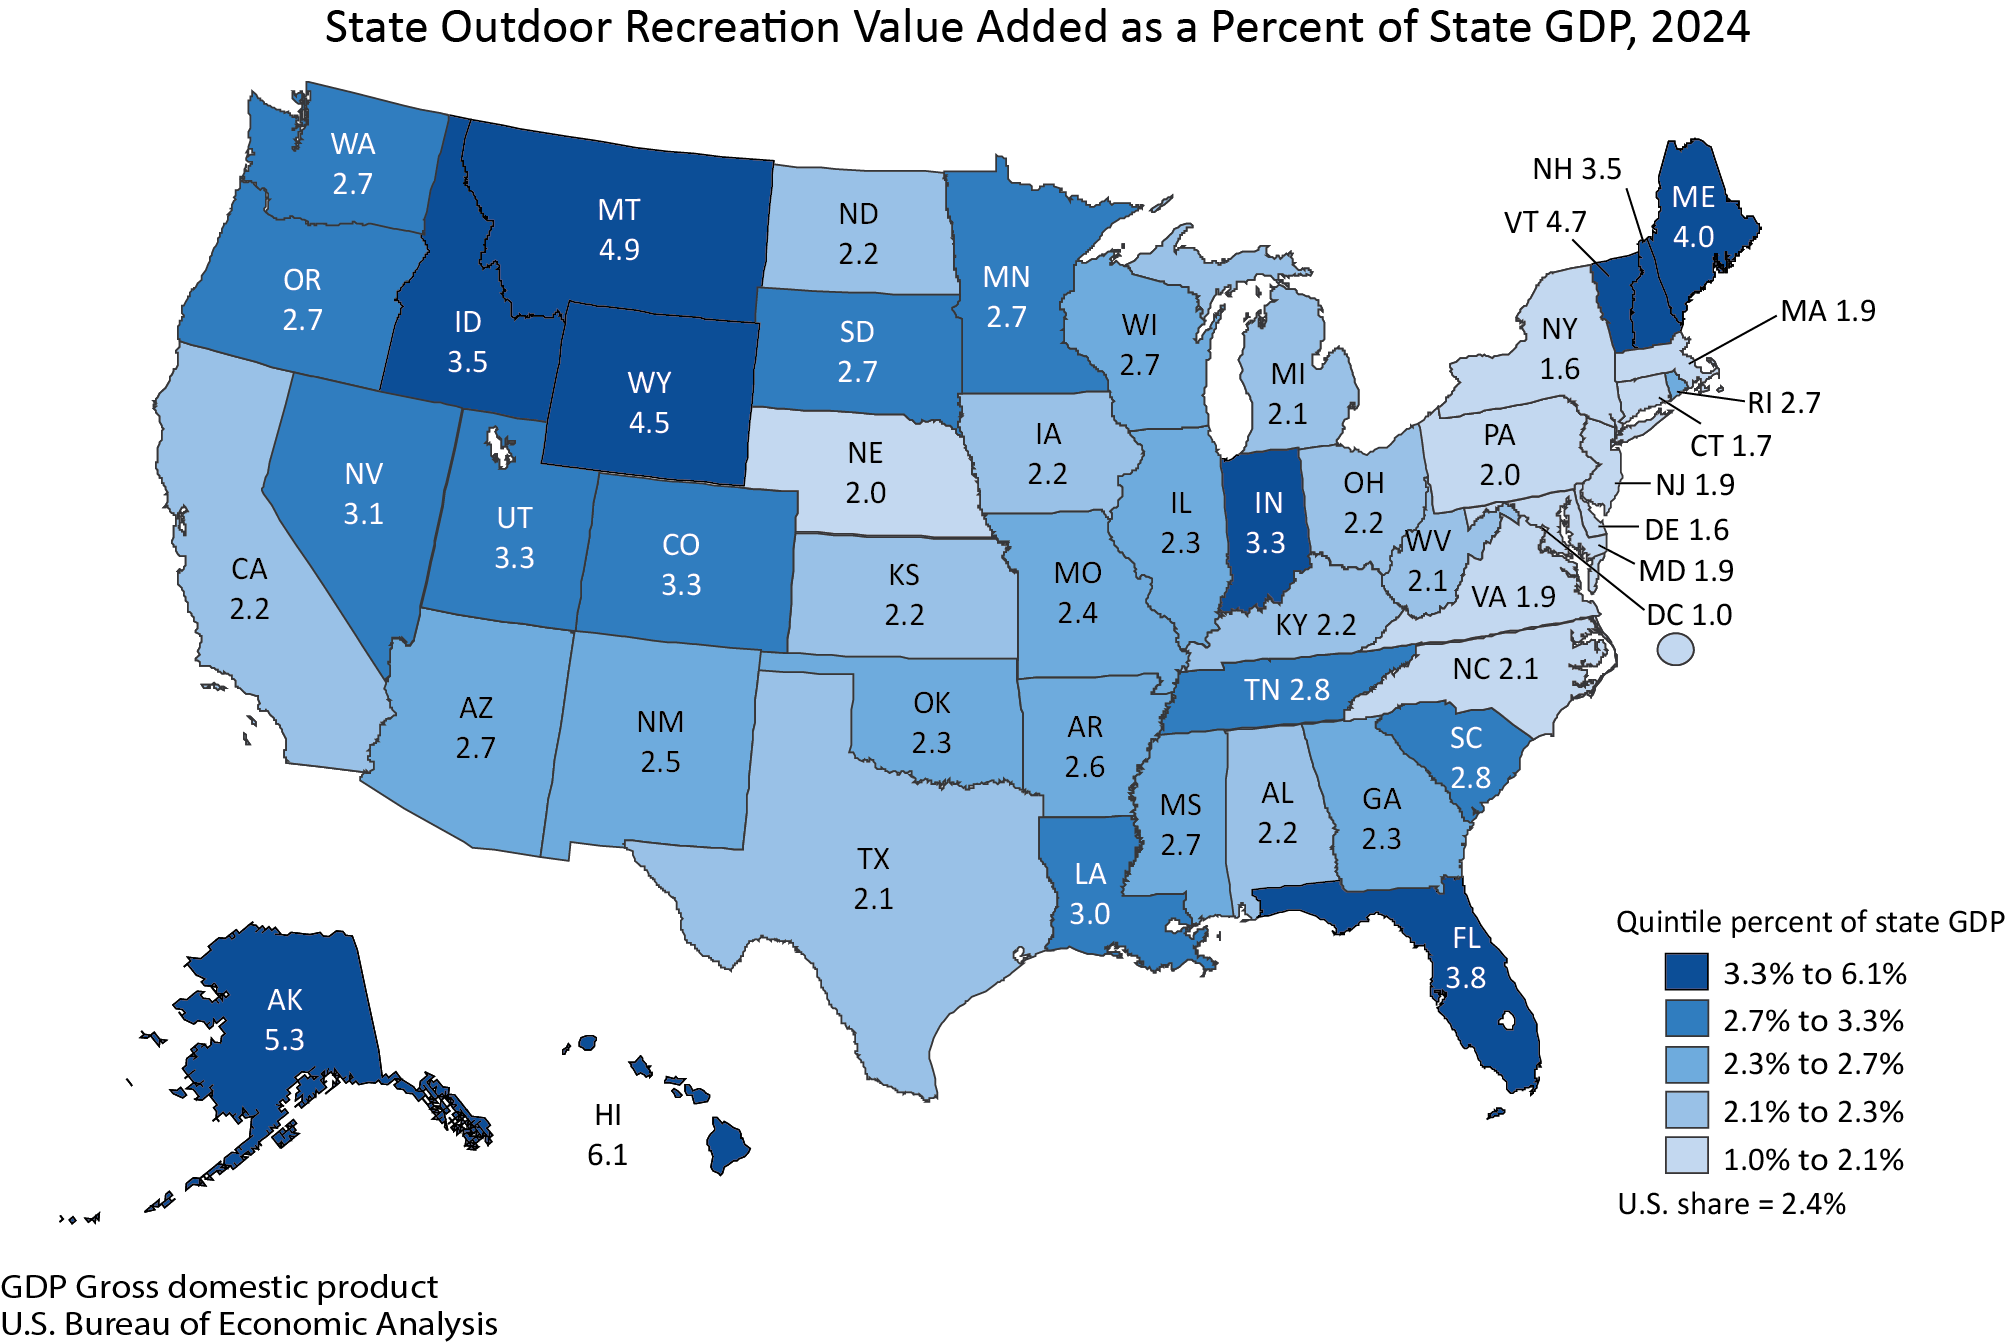
The BEA’s report highlights considerable variation in the economic significance of outdoor recreation across different states and the District of Columbia. The value added by outdoor recreation as a share of state GDP ranged from a commanding 6.1 percent in Hawaii to a more modest 1.0 percent in the District of Columbia. This disparity reflects the diverse economic structures, natural resource endowments, and tourism-dependent economies present throughout the United States.
States like Hawaii, with its iconic natural landscapes and thriving tourism industry, naturally see outdoor recreation playing a disproportionately larger role in their overall economic fabric. Conversely, urban centers with more diversified economies might exhibit a smaller relative contribution from outdoor recreation, even if the absolute dollar value is substantial.
Employment Trends in Outdoor Recreation
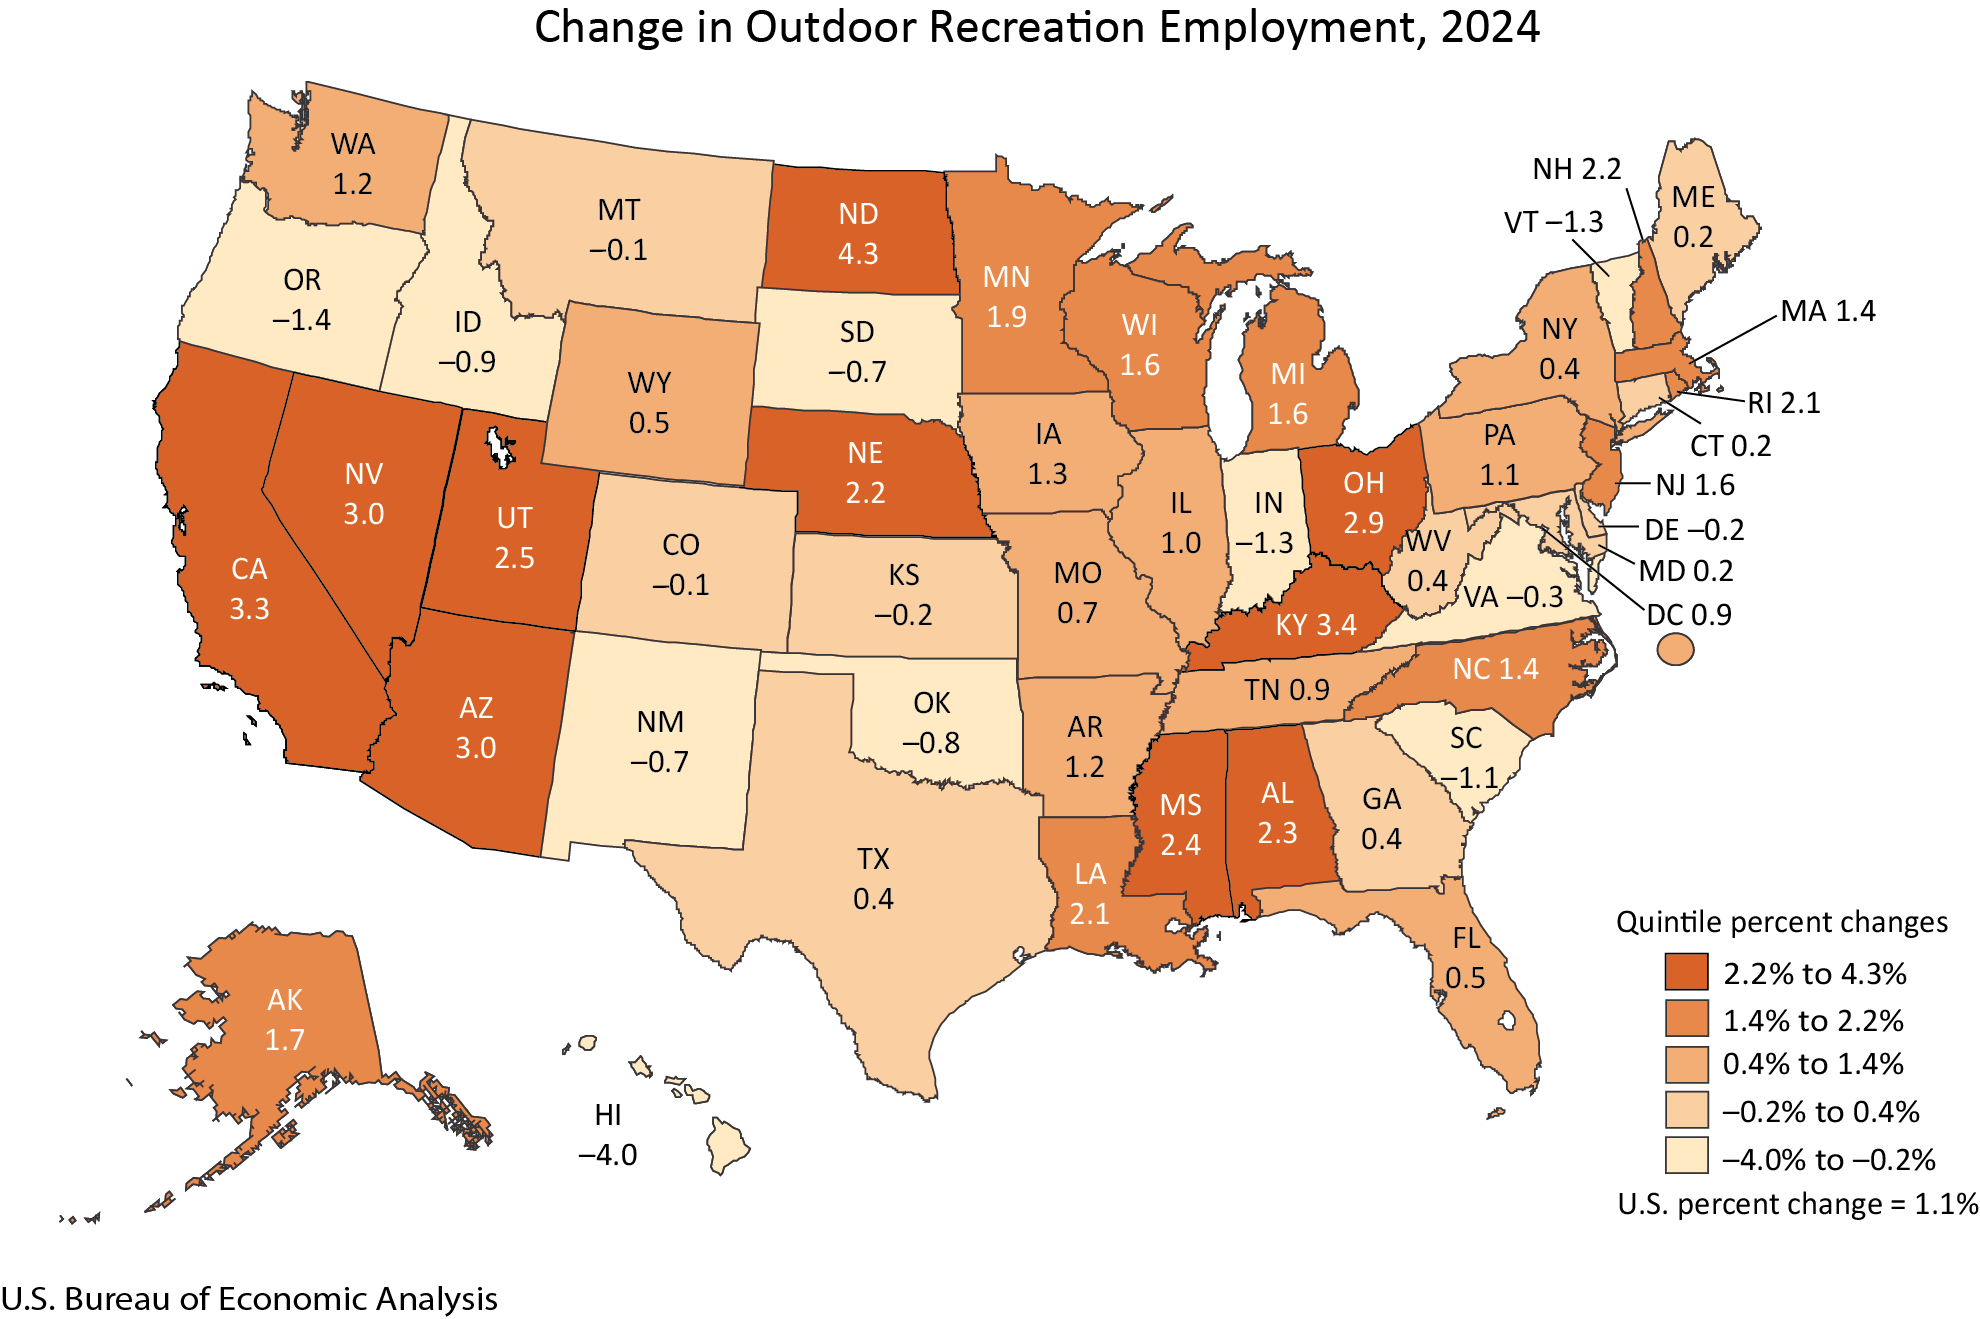
In 2024, outdoor recreation employment saw an increase in 36 states and the District of Columbia, indicating a broad-based expansion of jobs within the sector. The percentage change in outdoor recreation employment varied significantly, with North Dakota leading the nation with a remarkable 4.3 percent increase. This surge in North Dakota suggests a growing emphasis on or development of outdoor recreational opportunities within the state.
On the other end of the spectrum, Hawaii experienced a decline of 4.0 percent in outdoor recreation employment. This contraction, juxtaposed with its high percentage of GDP contribution, could indicate shifts in the types of outdoor activities being pursued or a temporary downturn in specific sub-sectors within the state’s robust tourism industry. The BEA’s interactive tables provide a detailed breakdown, allowing for a deeper understanding of these regional employment dynamics.
Categorizing Outdoor Recreation Activities: A Deeper Dive
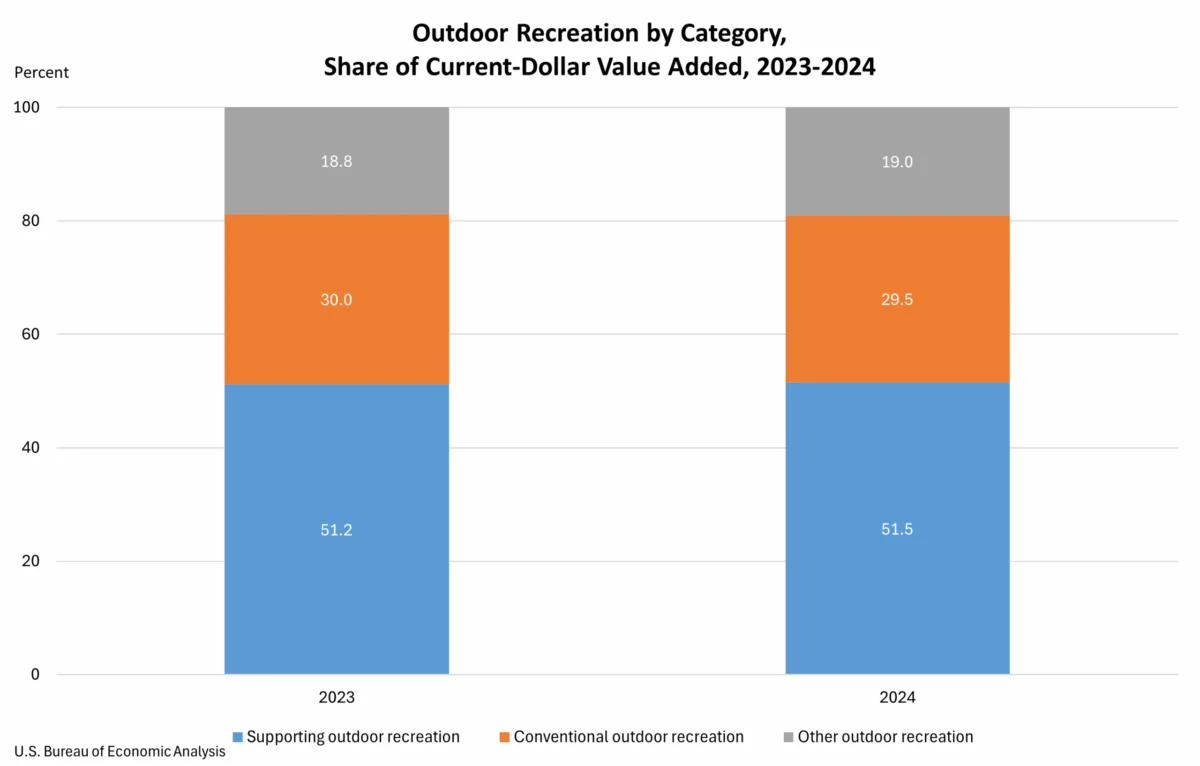
The BEA categorizes outdoor recreation activities into three broad groups, providing a framework for understanding where economic value is generated:
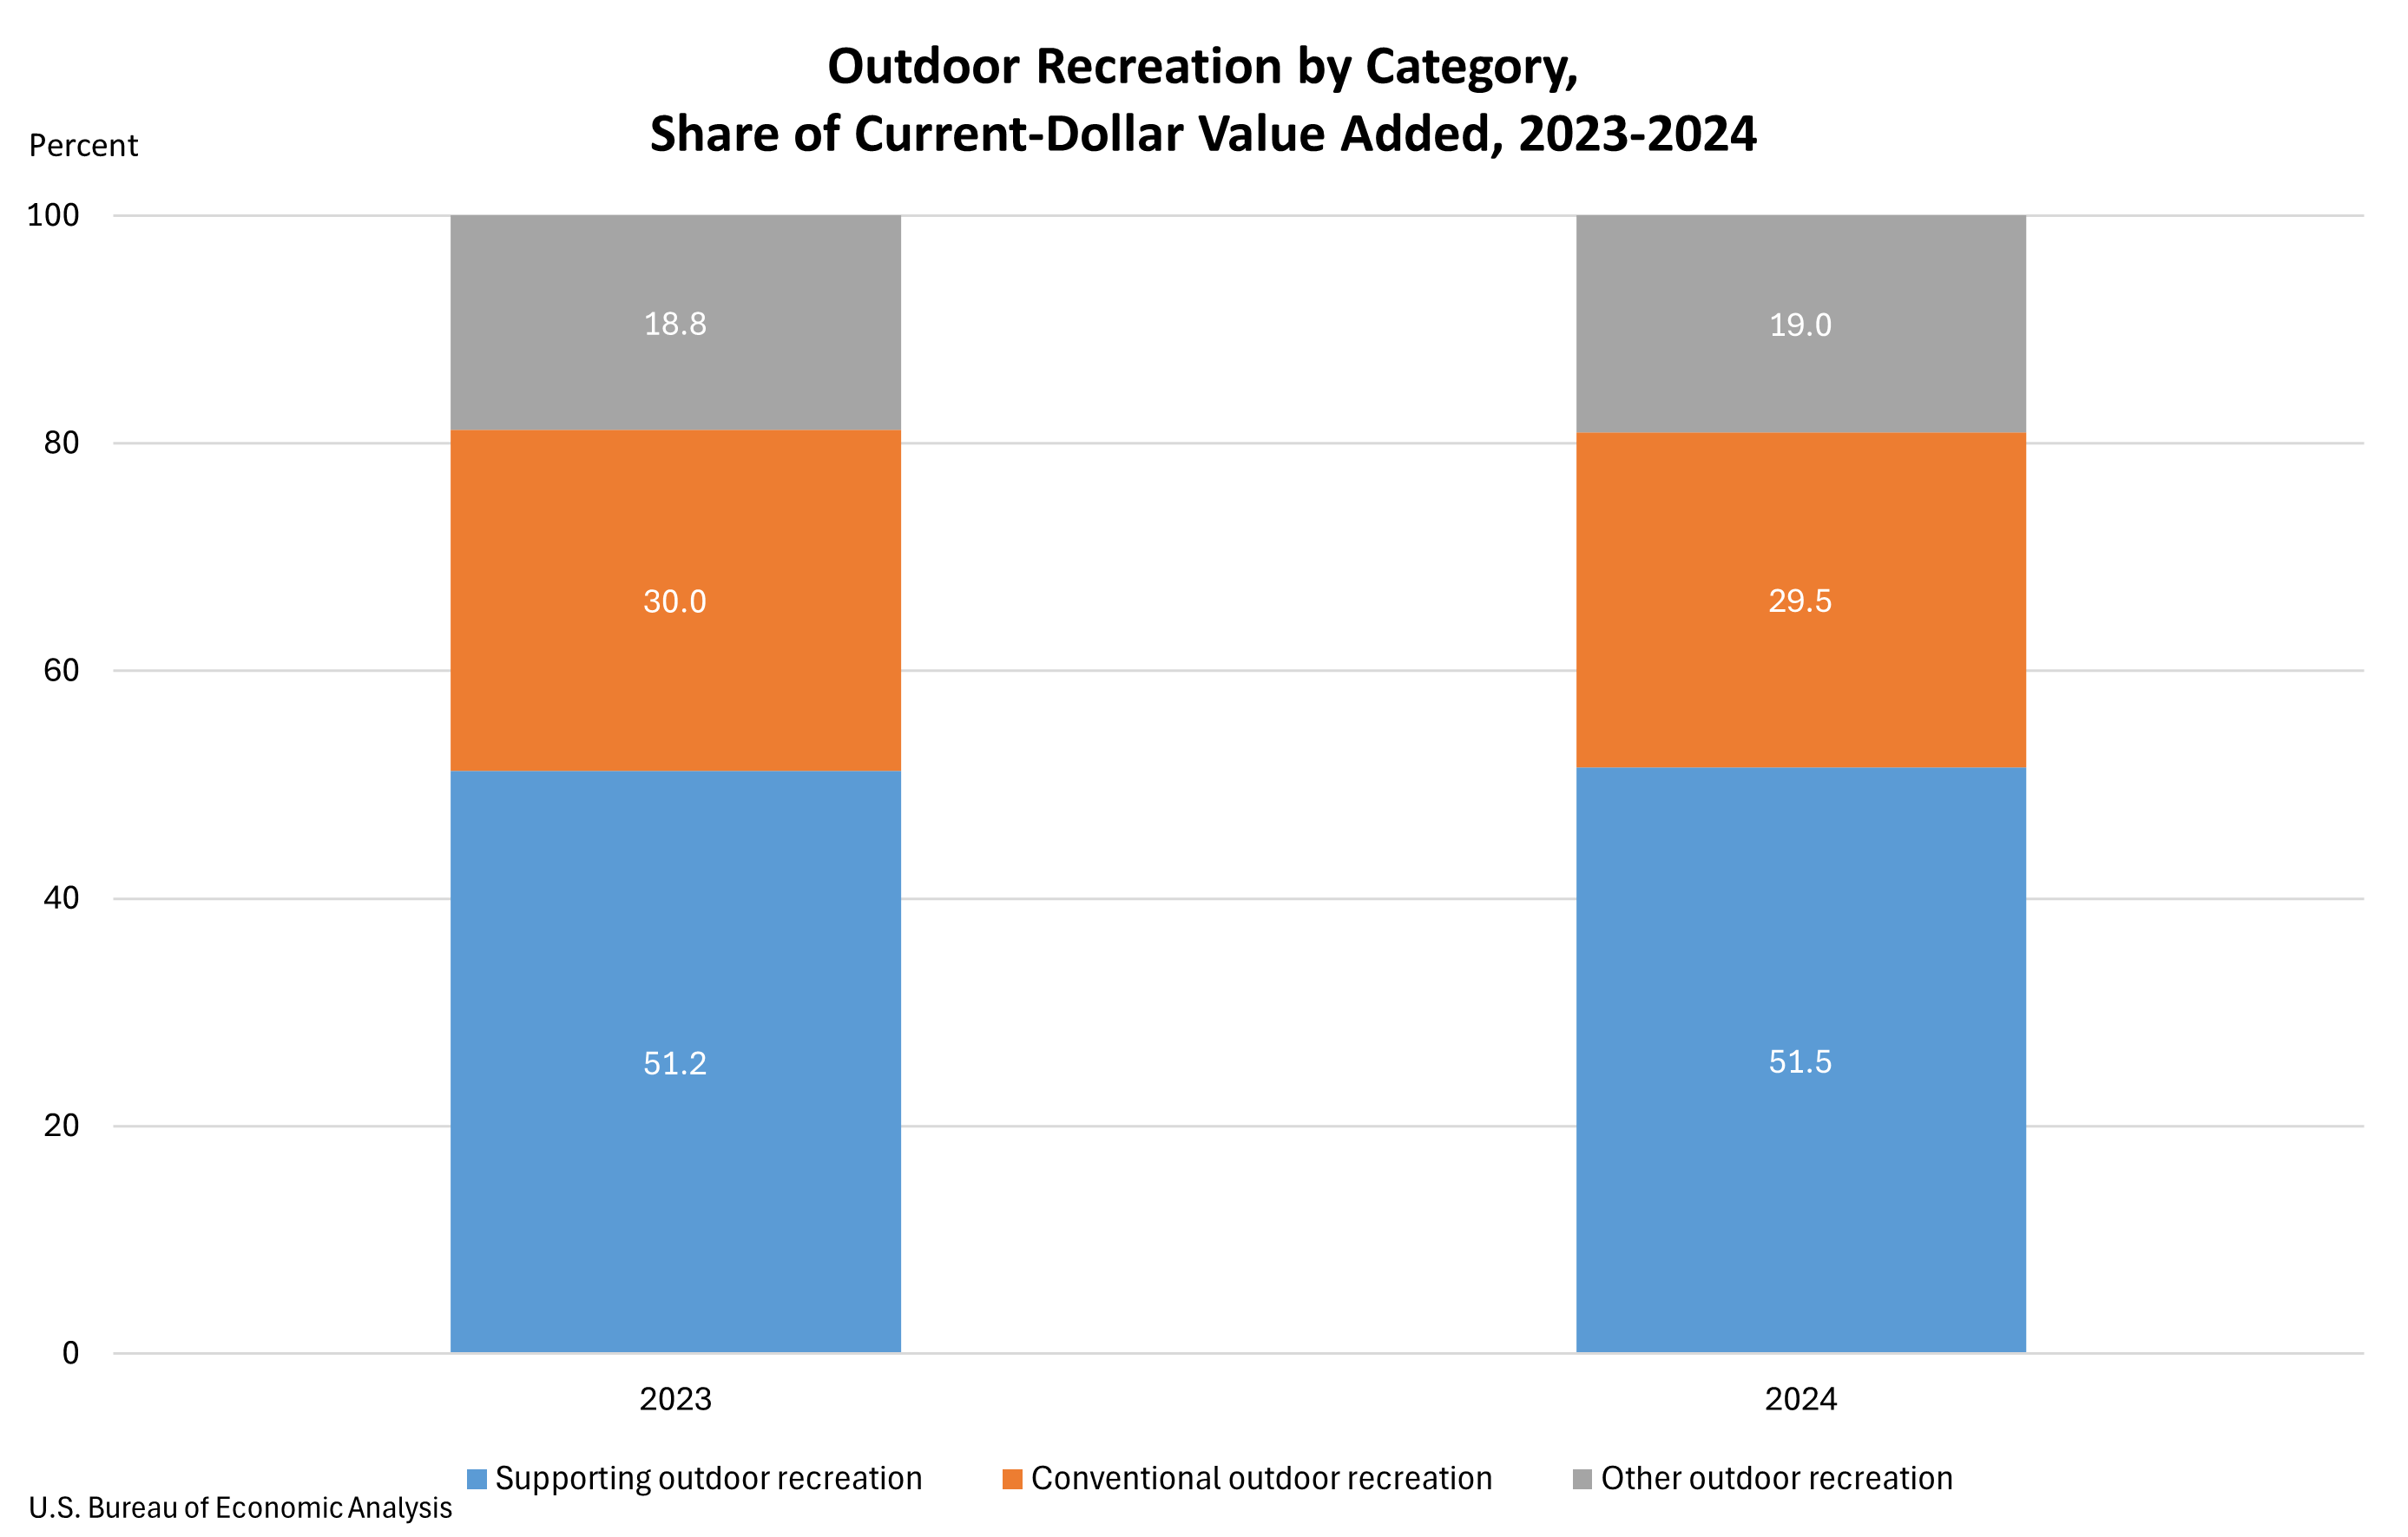
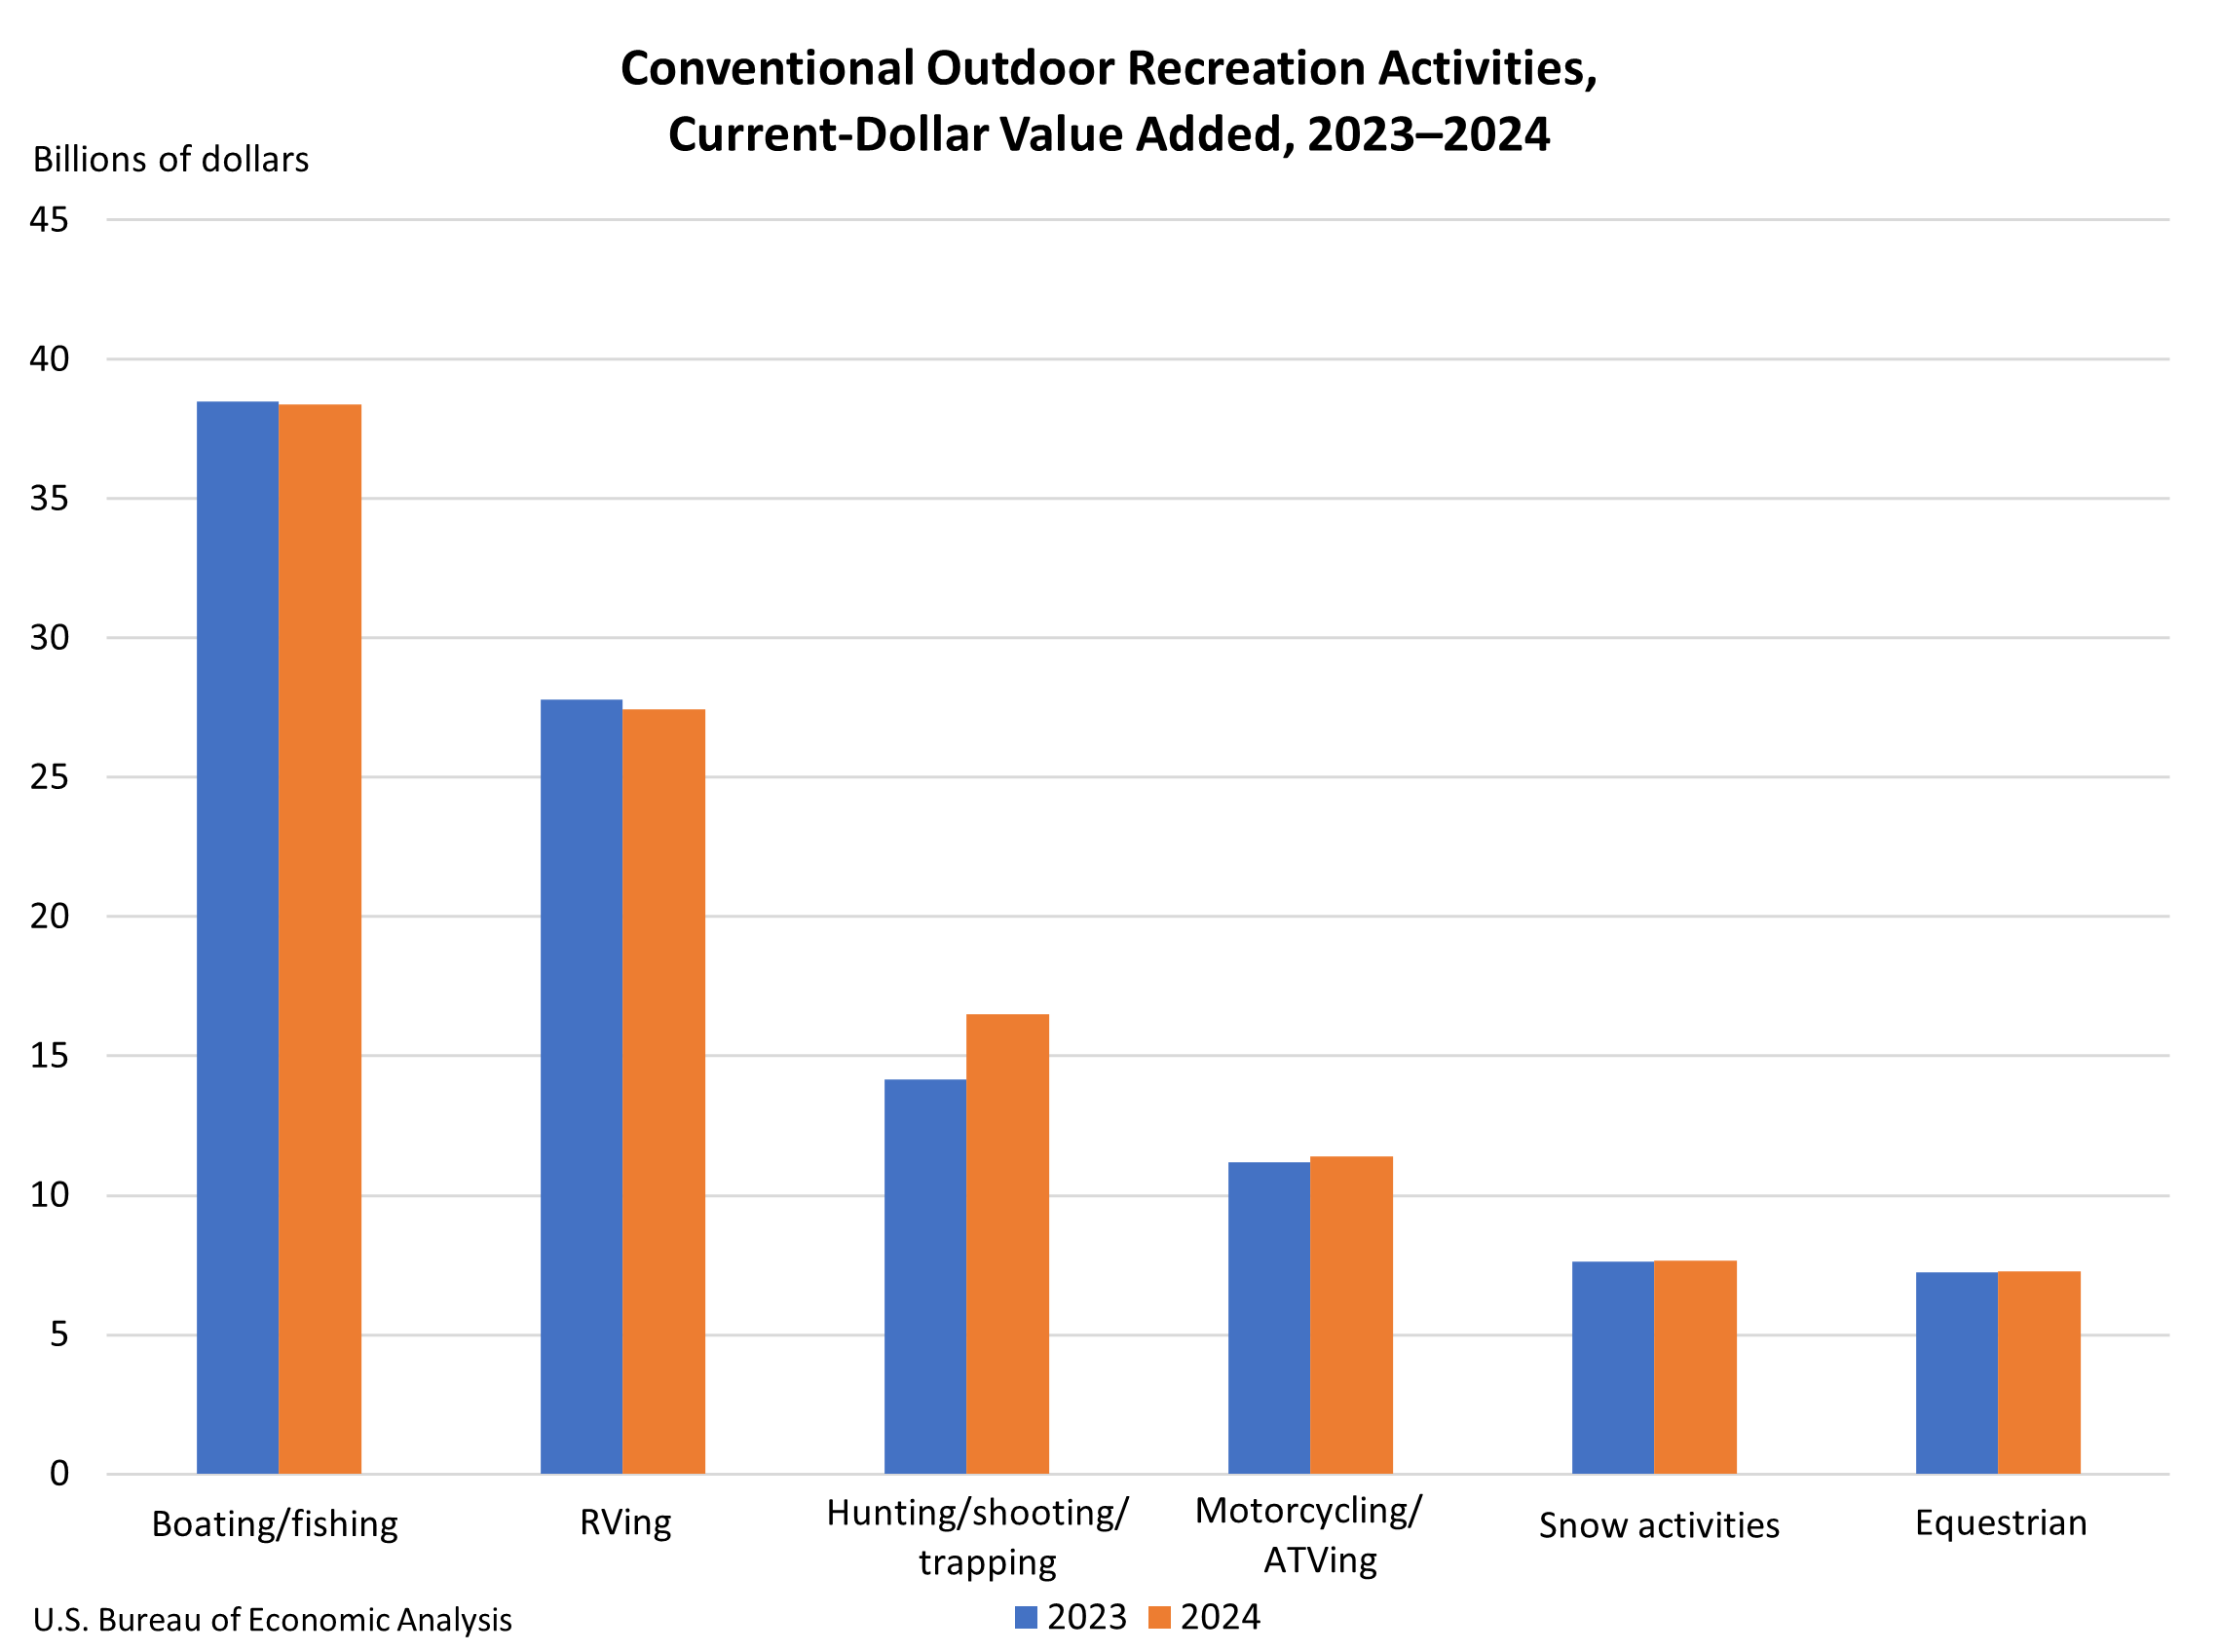
- Conventional Activities: These encompass traditional outdoor pursuits such as bicycling, boating, hiking, hunting, fishing, camping, and climbing. In 2024, this category accounted for 29.5 percent of the U.S. outdoor recreation value added, a slight decrease from 30.0 percent in 2023.
- Other Activities: This group includes a broader range of leisure pursuits that take place outdoors, such as gardening, outdoor concerts, festivals, and other cultural events. In 2024, "other outdoor recreation" represented 19.0 percent of value added, a marginal increase from 18.8 percent in the previous year.
- Supporting Activities: This is the largest and most economically impactful category, comprising activities that facilitate and enable outdoor recreation. This includes construction of outdoor recreation infrastructure, travel and tourism services (transportation, lodging, food services), local trips and excursions, and government expenditures on public lands and resources. In 2024, supporting activities constituted 51.5 percent of value added, up from 51.2 percent in 2023.
The growth within supporting activities was notably driven by travel and tourism. This surge reflects increased consumer spending on transportation, accommodations, and dining out, all of which are integral to accessing and enjoying outdoor recreational opportunities. This highlights the interconnectedness of the outdoor recreation sector with broader service industries.
Industry Contributions to the Outdoor Recreation Economy
The BEA’s analysis also breaks down the economic contributions of various industries to the outdoor recreation sector. This provides insight into which sectors are most directly and indirectly benefiting from outdoor activities.
-
Arts, Entertainment, Recreation, Accommodation, and Food Services: This industry group emerged as the largest contributor to U.S. outdoor recreation value added in 2024, accounting for $174.4 billion, or 25.0 percent of the total. At the state level, this sector was the primary driver of outdoor recreation value added in 23 states and the District of Columbia. California, with $24.1 billion, Florida with $22.7 billion, and New York with $11.8 billion, reported the largest contributions from this sector. This underscores the critical role of hospitality and entertainment services in the outdoor recreation ecosystem.
-
Retail Trade: Ranking as the second-largest contributor nationally, retail trade generated $169.1 billion, or 24.3 percent of outdoor recreation value added. This sector was the leading contributor in 24 states. California ($19.3 billion), Texas ($14.4 billion), and Florida ($13.4 billion) led in retail contributions to outdoor recreation. This signifies the importance of retail sales of outdoor gear, apparel, and equipment.
-
Manufacturing: The manufacturing sector contributed $91.3 billion, or 13.1 percent of national value added. This sector was the largest contributor in two states: Indiana and Louisiana. Texas ($13.1 billion), California ($11.6 billion), and Indiana ($9.1 billion) demonstrated the largest manufacturing contributions. This segment includes the production of vehicles, sporting goods, and other equipment used in outdoor recreation.
Annual Updates and Data Revisions
The release of these statistics is part of the BEA’s ongoing commitment to providing up-to-date economic data. Estimates for the years 2020 through 2023 have been revised as part of this release. These updates incorporate the results of the 2025 annual update of the National Economic Accounts, which includes the National Income and Product Accounts and the Industry Economic Accounts. The incorporation of newly available and revised source data ensures the accuracy and comprehensiveness of the figures.
Similarly, state-level statistics have been updated to reflect these revised national data, as well as the 2025 annual update of the Regional Economic Accounts and updated regional source data. This rigorous process of data collection, revision, and integration ensures that policymakers, businesses, and researchers have access to the most reliable economic intelligence.
Implications and Future Outlook
The BEA’s comprehensive report on the outdoor recreation economy provides invaluable insights for a wide range of stakeholders. For policymakers, the data highlights the significant economic impact of investing in public lands, trails, and recreational infrastructure. These investments not only enhance quality of life but also serve as powerful economic drivers, attracting tourism and supporting local businesses. The strong growth in compensation within the sector also points to its potential as a source of well-paying jobs.
For businesses operating within or adjacent to the outdoor recreation sector, the detailed industry breakdowns offer strategic guidance. Understanding which activities and industries are driving growth can inform investment decisions, marketing strategies, and product development. The continued strength of travel and tourism as a supporting activity suggests ongoing opportunities for businesses in hospitality and transportation to cater to outdoor enthusiasts.
The slight deceleration in real GDP growth for outdoor recreation compared to the overall economy in 2024 warrants continued observation. While the sector remains a vital economic engine, factors such as inflation, changing consumer spending patterns, and potential shifts in leisure preferences could influence future growth trajectories. However, the underlying trend of increasing employment and compensation suggests a resilient sector with sustained long-term potential.
The BEA’s commitment to annual updates ensures that these economic trends are continuously monitored, providing an essential foundation for informed decision-making and strategic planning in this dynamic and increasingly important segment of the American economy. The next release, scheduled for Fall 2026, will provide an update for the 2025 outdoor recreation economic statistics, offering further insights into the sector’s evolving landscape.