Lana Rhoades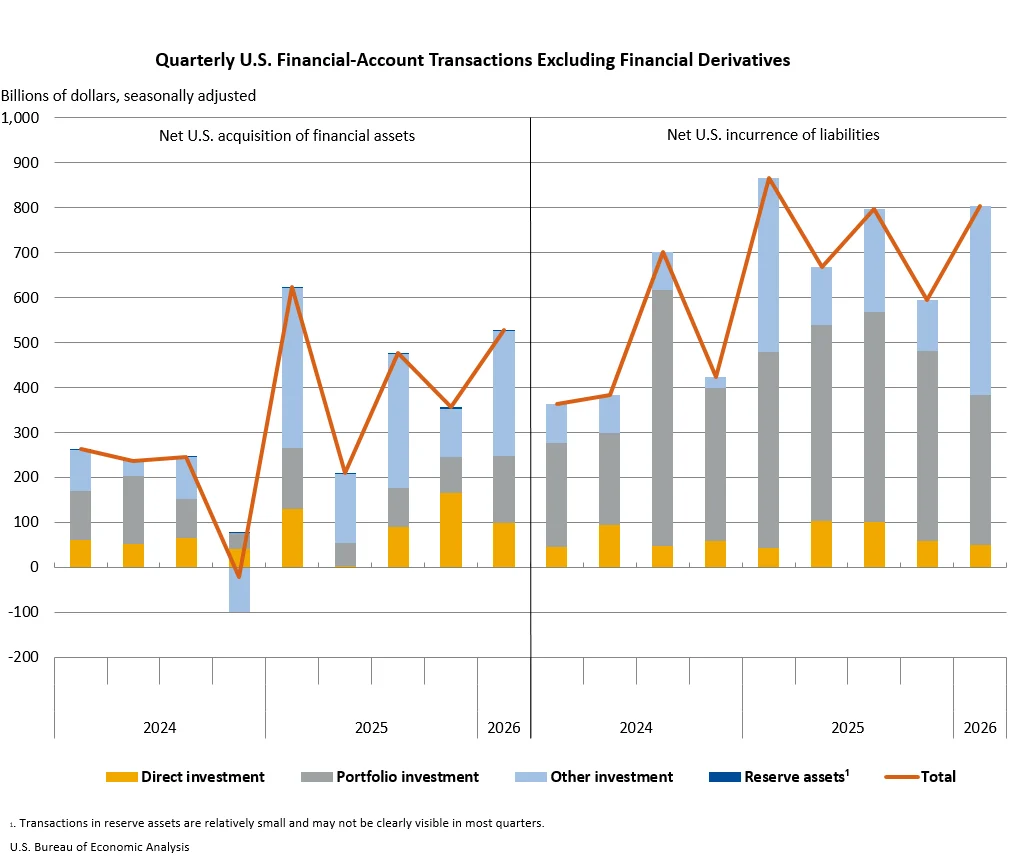
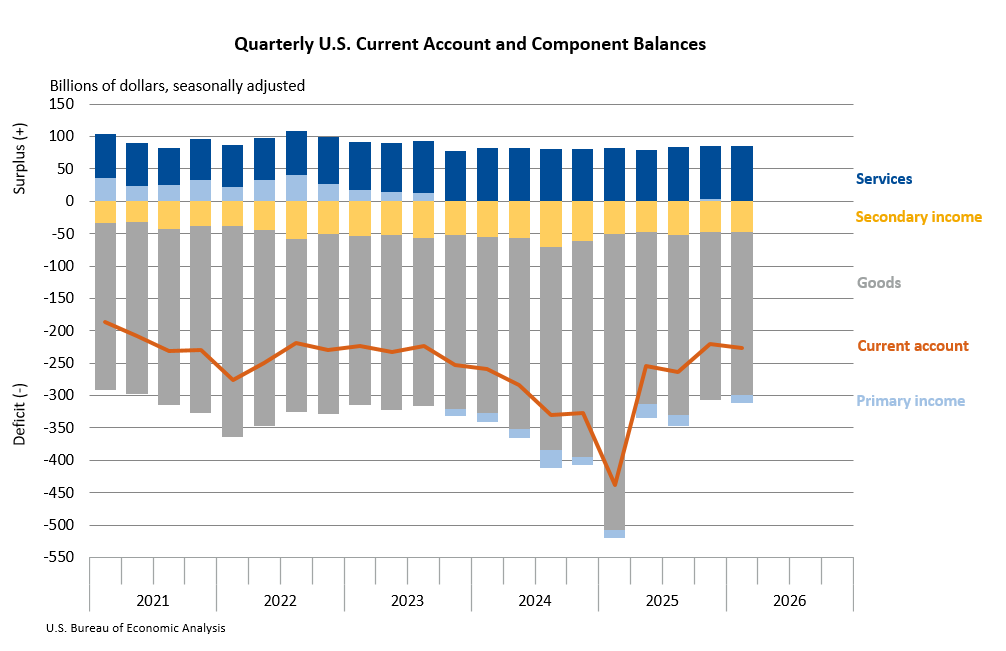
The U.S. current-account deficit, a key measure of a nation’s international economic transactions, expanded by $5.8 billion, or 2.6 percent, to reach $226.8 billion in the first quarter of 2026. This widening, as reported by the U.S. Bureau of Economic Analysis (BEA) on June 20, 2026, reflects a complex interplay of shifting income balances and a recalibration in the trade of goods. The revised deficit for the preceding fourth quarter of 2025 stood at $221.1 billion, indicating a notable acceleration in the current-account imbalance during the initial months of 2026.
This latest figures place the first-quarter deficit at 2.9 percent of current-dollar gross domestic product (GDP), a marginal uptick from the 2.8 percent recorded in the final quarter of 2025. This percentage of GDP serves as a crucial indicator of the deficit’s magnitude relative to the overall size of the U.S. economy, suggesting a growing reliance on foreign capital to finance domestic spending and investment.
The primary driver behind the first-quarter deficit’s expansion was a significant swing in the balance on primary income. This component, which includes earnings from foreign direct investments, portfolio investments, and compensation of employees, shifted from a surplus in the fourth quarter of 2025 to a deficit in the first quarter of 2026. While the exact composition of this shift will be detailed in subsequent BEA releases, it suggests a reduction in income flowing into the U.S. from its overseas assets or an increase in income flowing out to foreign investors holding U.S. assets. This income imbalance was partially counteracted by a reduction in the deficit on goods, indicating an improvement in the U.S. trade balance for physical products.
Understanding the Components of the Current Account
The current account is a broad measure of a nation’s international transactions, encompassing trade in goods and services, primary income, and secondary income.
- Goods Balance: This reflects the difference between the value of U.S. exports of physical goods and U.S. imports of physical goods. A deficit in goods means the U.S. imports more goods than it exports.
- Services Balance: This captures the trade in services, such as tourism, transportation, financial services, and intellectual property.
- Primary Income Balance: This includes income earned by U.S. residents from their foreign investments (e.g., dividends, interest, reinvested earnings) and income earned by foreign residents from their U.S. investments. It also includes compensation of employees working abroad.
- Secondary Income Balance: This comprises unilateral transfers, such as foreign aid, grants, and remittances, where no goods or services are exchanged.
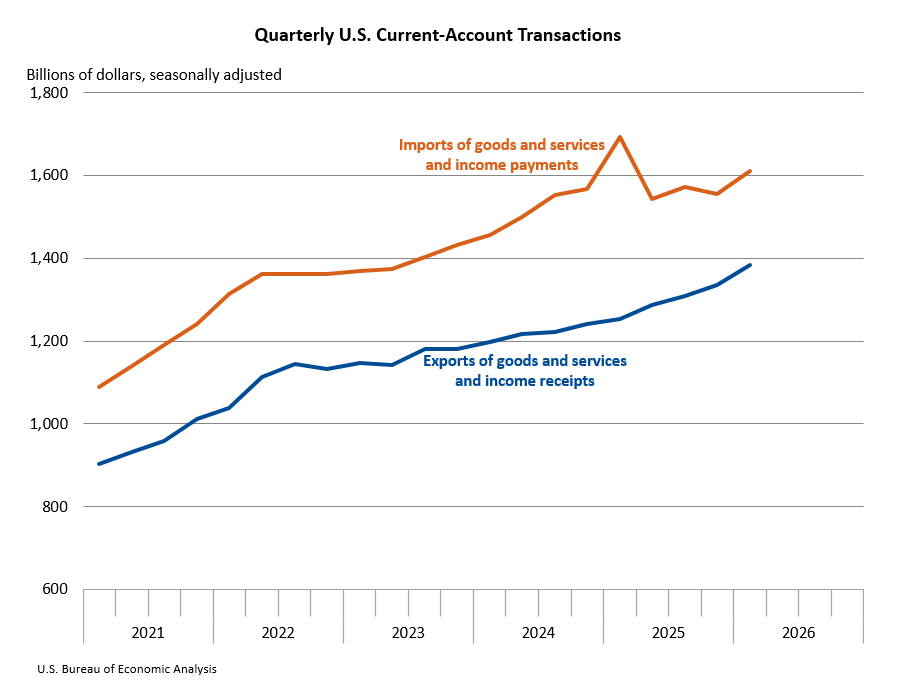
The BEA’s data release highlighted that total exports of goods and services, along with income received from foreign residents, saw a substantial increase of $50.0 billion, bringing the total to $1.38 trillion in the first quarter. This overall rise was largely propelled by an expansion in goods exports. However, this positive momentum was tempered by a decrease in primary income receipts, suggesting that while the U.S. sold more goods abroad, the earnings derived from its foreign investments declined during the period.
Conversely, imports of goods and services, and income paid to foreign residents, surged by $55.8 billion, reaching $1.61 trillion. This increase was driven by higher imports of goods and a notable rise in primary income payments. The widening gap between exports and imports of goods, coupled with increased income outflows, collectively contributed to the widening current-account deficit.
The secondary income balance also saw a shift, though its impact on the overall current account was less pronounced. While not detailed in the initial summary, the table of revised fourth-quarter data indicates a reduction in the secondary income deficit from $54.6 billion to $47.2 billion.
Errata Clarification and Financial Account Dynamics
The BEA also issued a clarification regarding a typographical error that affected a single data point in its release. The net financial transactions figure of -$209.0 billion was updated on June 30, 2026, to correctly include a negative sign, which had been inadvertently omitted. This error was isolated to this specific number and did not impact the accuracy of the data available through BEA’s Interactive Data Application or Application Programming Interface.
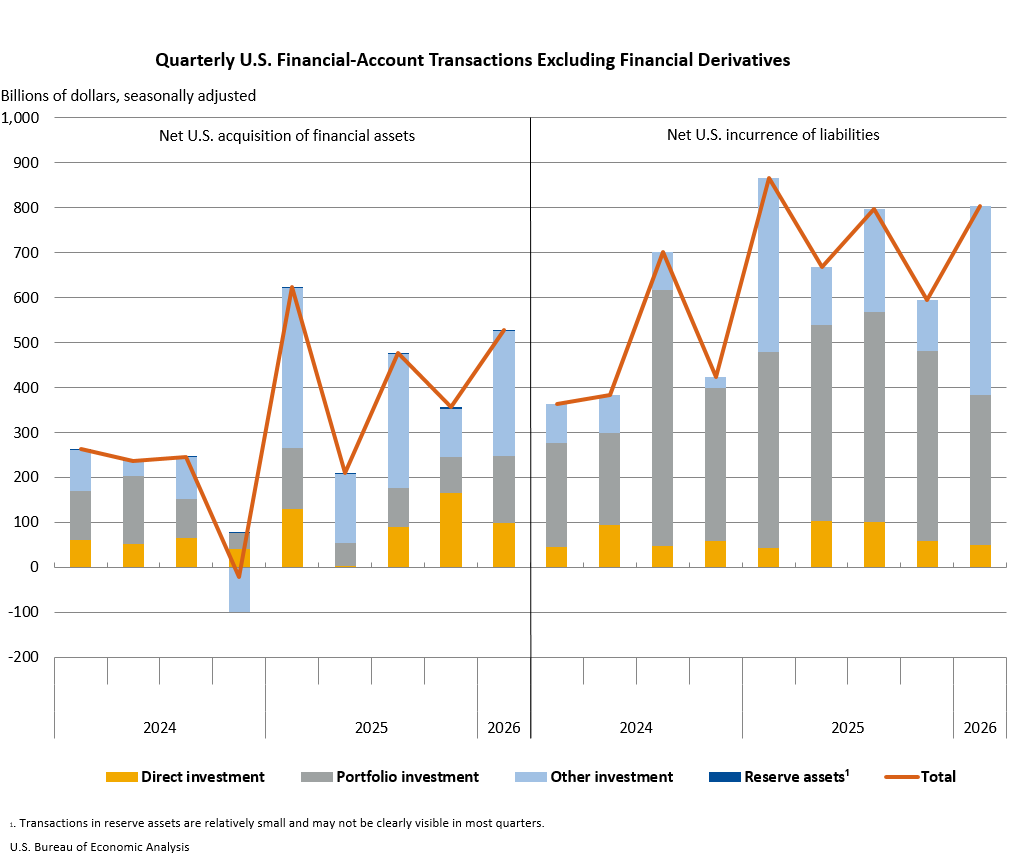
The U.S. financial account, which tracks the flow of investments across borders, recorded net financial-account transactions of -$209.0 billion in the first quarter of 2026. This figure signifies net U.S. borrowing from foreign residents. During this period, U.S. residents increased their holdings of foreign financial assets by $527.3 billion, while simultaneously increasing their liabilities to foreign residents by a larger margin of $803.7 billion. This net outflow of capital, driven by increased foreign borrowing, is directly linked to the current-account deficit, as a country typically finances a current-account deficit by attracting foreign investment or reducing its own foreign assets.
U.S. International Investment Position at Quarter-End
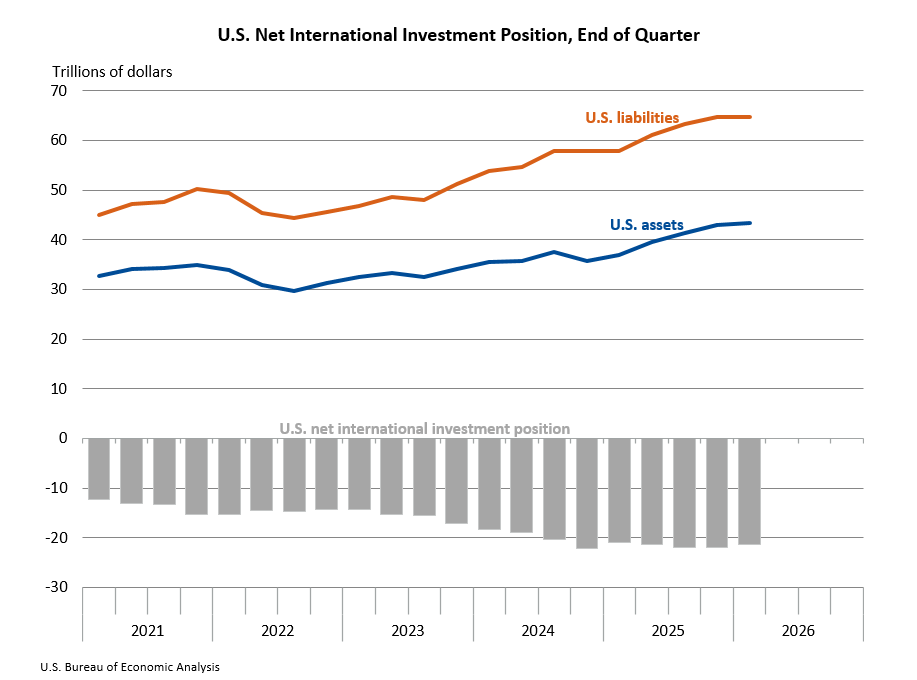
At the close of the first quarter of 2026, the U.S. net international investment position, which represents the difference between U.S. residents’ foreign financial assets and liabilities, stood at -$21.27 trillion. This negative position indicates that U.S. liabilities to foreign residents exceeded U.S. assets abroad. Total U.S. foreign assets amounted to $43.37 trillion, while U.S. liabilities to foreign residents totaled $64.64 trillion. This marks an improvement from the revised position at the end of the fourth quarter of 2025, which was -$21.87 trillion.
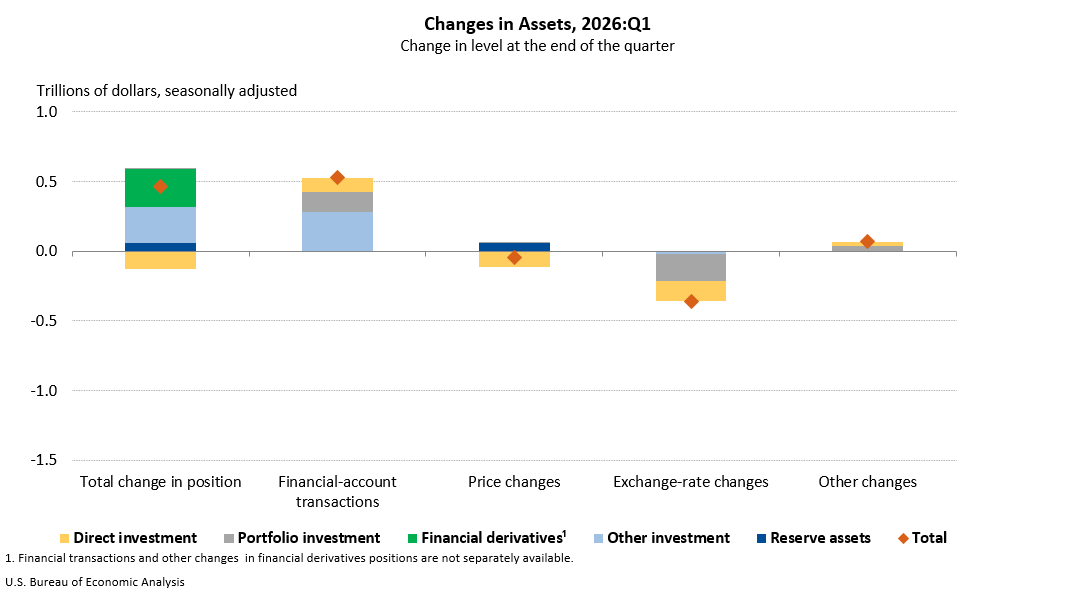
The changes in the U.S. international investment position during the first quarter were influenced by both financial transactions and valuation changes. U.S. assets saw an increase of $462.9 billion. This growth was primarily fueled by financial transactions totaling $527.3 billion, which were partially offset by unfavorable exchange-rate movements amounting to -$357.1 billion.
In contrast, U.S. liabilities decreased by $140.4 billion during the same period. This reduction was largely driven by price changes, which resulted in a decline of $1.18 trillion in the value of U.S. liabilities held by foreigners. This significant price effect more than compensated for the increase in liabilities due to financial transactions, which amounted to $803.7 billion.
Annual Updates Incorporate Extensive Data Revisions
The statistics released for the first quarter of 2026 are part of the BEA’s annual updates to the U.S. International Transactions Accounts (ITAs) and the International Investment Position (IIP) Accounts. These comprehensive updates involve the incorporation of newly available and revised source data, as well as recalculated seasonal and trading-day adjustments. The BEA has been integrating these updates for statistics beginning with 1999.
Key sources of revised data include surveys conducted by the BEA itself, such as benchmark and quarterly insurance services surveys (2019-2025), quarterly international services surveys (2023-2025), and benchmark, annual, and quarterly direct investment surveys (2022-2025). Additionally, the U.S. Census Bureau provided revised source data for Census-basis goods (2023-2025), and the U.S. Department of the Treasury contributed revised data from annual portfolio investment surveys (2024-2025) and quarterly and monthly portfolio and other investment surveys (2023-2025).
These extensive revisions are crucial for maintaining the accuracy and reliability of the U.S. international economic accounts, reflecting the dynamic nature of global trade and finance. Further details on these annual updates are available in the "Survey of Current Business," with additional information anticipated in the July 2026 edition. The BEA’s "U.S. International Economic Accounts: Concepts and Methods" publication will also be updated in September 2026 to reflect these changes.
Broader Economic Context and Implications
The widening U.S. current-account deficit in the first quarter of 2026 underscores ongoing trends in the global economy. A persistent current-account deficit implies that a nation is spending more on foreign goods, services, and investments than it is earning from abroad. This imbalance must be financed through net capital inflows, meaning foreign entities are investing more in the deficit country than the deficit country is investing abroad.
The shift in the primary income balance from a surplus to a deficit is a particularly noteworthy development. It could signal several underlying economic shifts, such as a decrease in the profitability of U.S. investments abroad, an increase in dividend or interest payments made by U.S. companies to foreign shareholders, or a rise in compensation paid to foreign workers in the U.S. Understanding the precise drivers of this income shift will be critical for policymakers and market analysts.
The increase in the deficit as a percentage of GDP, while modest, contributes to a growing national debt and reliance on foreign creditors. This can have implications for U.S. economic sovereignty, exchange rates, and interest rates. A larger deficit can put downward pressure on the U.S. dollar, making imports more expensive and exports cheaper, which in theory should help to correct the imbalance over time. However, the dollar’s role as a global reserve currency and the intricate web of global financial flows can complicate these adjustment mechanisms.
Analysis of Financial Account Transactions
The significant increase in U.S. liabilities to foreign residents, coupled with a substantial increase in U.S. foreign asset holdings, paints a picture of robust international financial activity. The fact that liabilities increased more than assets resulted in net borrowing from abroad. This can be attributed to a variety of factors, including foreign demand for U.S. Treasury securities, corporate bonds, equities, and direct investment.
The impact of valuation changes, particularly exchange rates and asset prices, on both assets and liabilities cannot be overstated. The -$357.1 billion impact of exchange-rate changes on U.S. assets suggests a weakening of foreign currencies relative to the U.S. dollar, which reduces the dollar value of U.S. holdings abroad. Conversely, the large positive impact of financial transactions on liabilities ($803.7 billion) indicates strong inflows of foreign capital into the U.S.
The BEA’s updated disclosure avoidance method, which includes rounding, aggregation, and the use of ranges, aims to enhance data publication while safeguarding respondent confidentiality. This methodological adjustment is part of the ongoing effort by statistical agencies to balance data transparency with privacy concerns.
Looking Ahead
The next release of U.S. International Transactions and Investment Position statistics, scheduled for September 24, 2026, will provide data for the second quarter of 2026. These upcoming figures will offer a more current snapshot of the U.S. economic relationship with the rest of the world and will supersede the first-quarter data presented here. Market participants and economists will be closely watching these subsequent releases to discern whether the trends observed in the first quarter are sustained or reversed, providing further insights into the trajectory of the U.S. current-account balance and its implications for the broader economy. The detailed analysis of these quarterly reports is crucial for understanding the complex and ever-evolving landscape of international economic integration.