

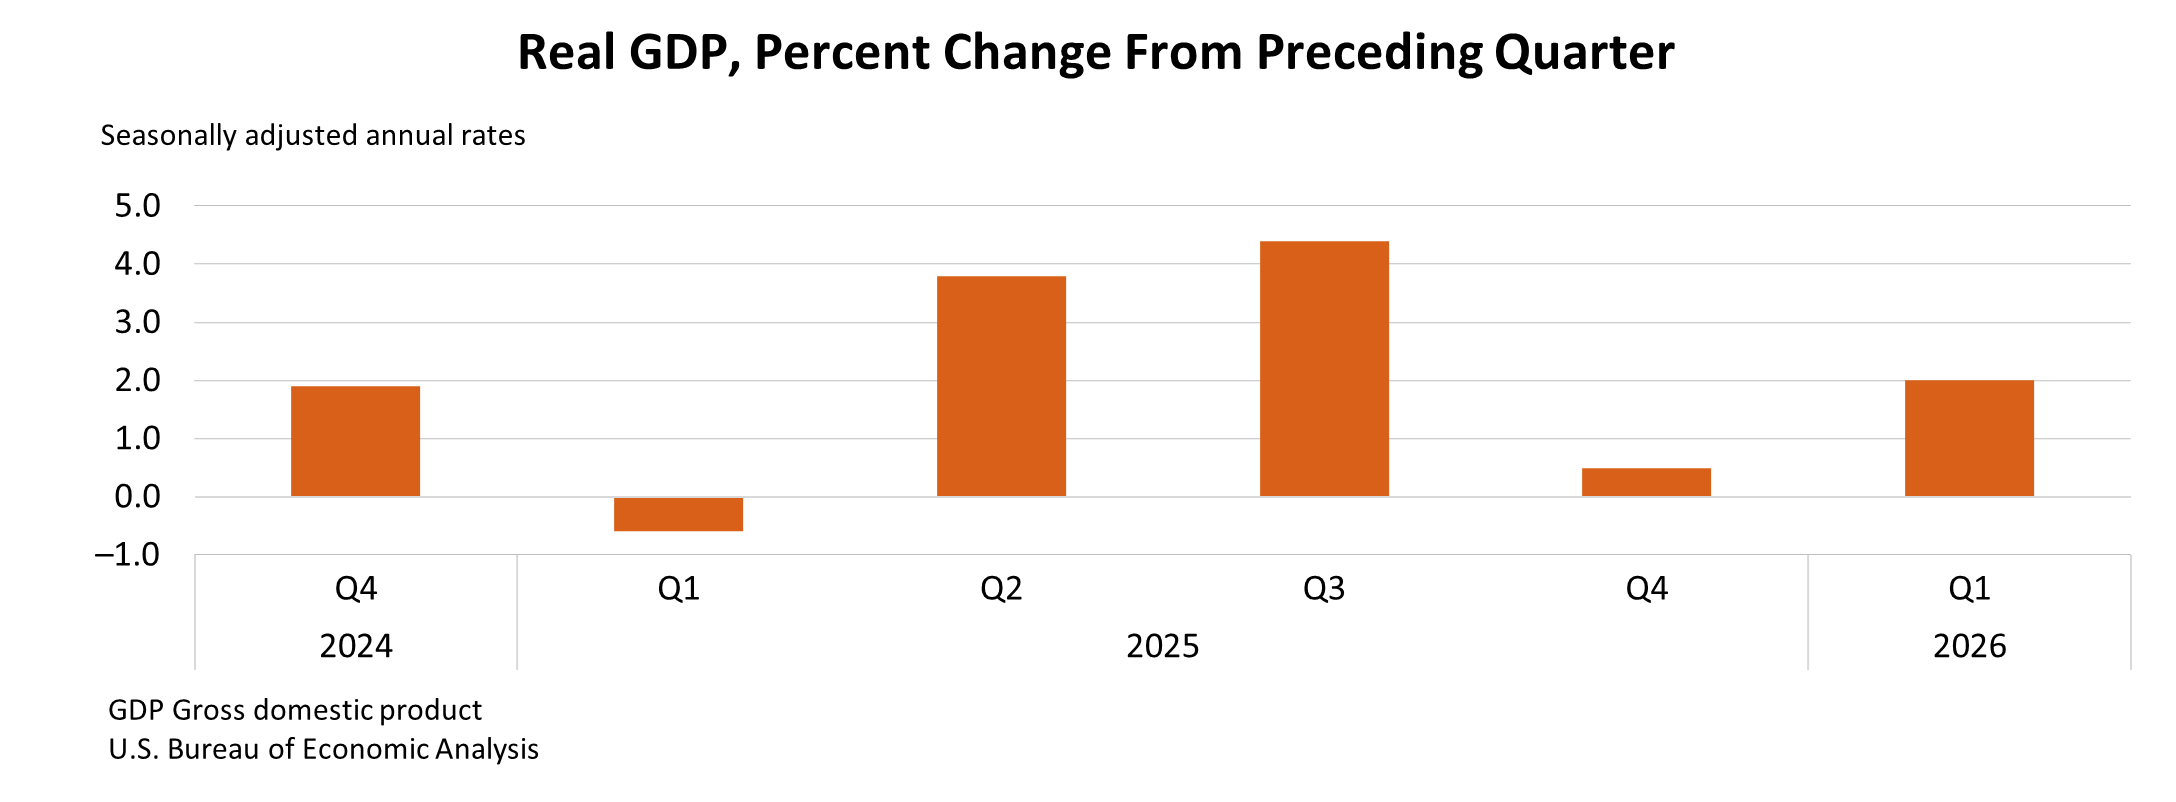
The United States economy demonstrated a robust rebound in the first quarter of 2026, with real gross domestic product (GDP) accelerating to an annual rate of 2.0 percent, according to the advance estimate released by the U.S. Bureau of Economic Analysis (BEA). This significant uptick marks a notable improvement from the 0.5 percent growth recorded in the final quarter of 2025, signaling a renewed vigor in economic activity as the year commenced. The expansion was primarily fueled by a confluence of strengthening investment, increased exports, consistent consumer spending, and a surge in government outlays, even as imports, which are subtracted in GDP calculations, also saw an upward trend.
This preliminary assessment of first-quarter performance paints a picture of a dynamic economic landscape, where key sectors contributed positively to the overall expansion. The BEA’s figures indicate that the acceleration from the previous quarter was driven by a combination of upturns in government spending and exports, coupled with a more vigorous pace of investment. While consumer spending, a perennial engine of U.S. economic growth, experienced a deceleration, its continued positive contribution, alongside the other growth drivers, ensured a net positive expansion.
The BEA’s comprehensive data also highlighted the performance of real final sales to private domestic purchasers, a critical metric that gauges the strength of consumer and business spending on goods and services for final use. This measure, representing the sum of consumer spending and gross private fixed investment, surged by 2.5 percent in the first quarter, a notable increase from the 1.8 percent growth observed in the fourth quarter of 2025. This indicates that underlying private sector demand remained strong, even with the slight moderation in the pace of consumer spending’s contribution to overall GDP growth.
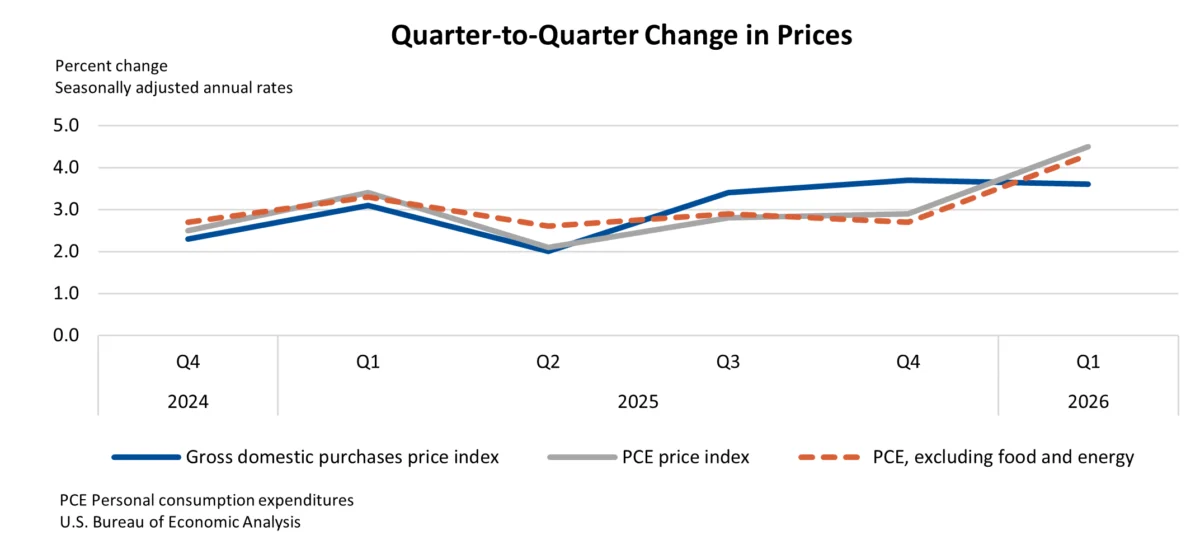
On the inflation front, the price index for gross domestic purchases, which measures price changes for goods and services purchased by consumers, businesses, and government, saw a marginal easing. It increased by 3.6 percent in the first quarter, a slight decrease from the 3.7 percent rise in the preceding quarter. However, the personal consumption expenditures (PCE) price index, a key inflation gauge closely watched by the Federal Reserve, registered a more pronounced increase, rising by 4.5 percent. This acceleration in the PCE index, particularly the core PCE index (excluding food and energy) which climbed 4.3 percent, suggests a potential undercurrent of inflationary pressures that may warrant continued monitoring by policymakers.
Key Drivers of First-Quarter Growth
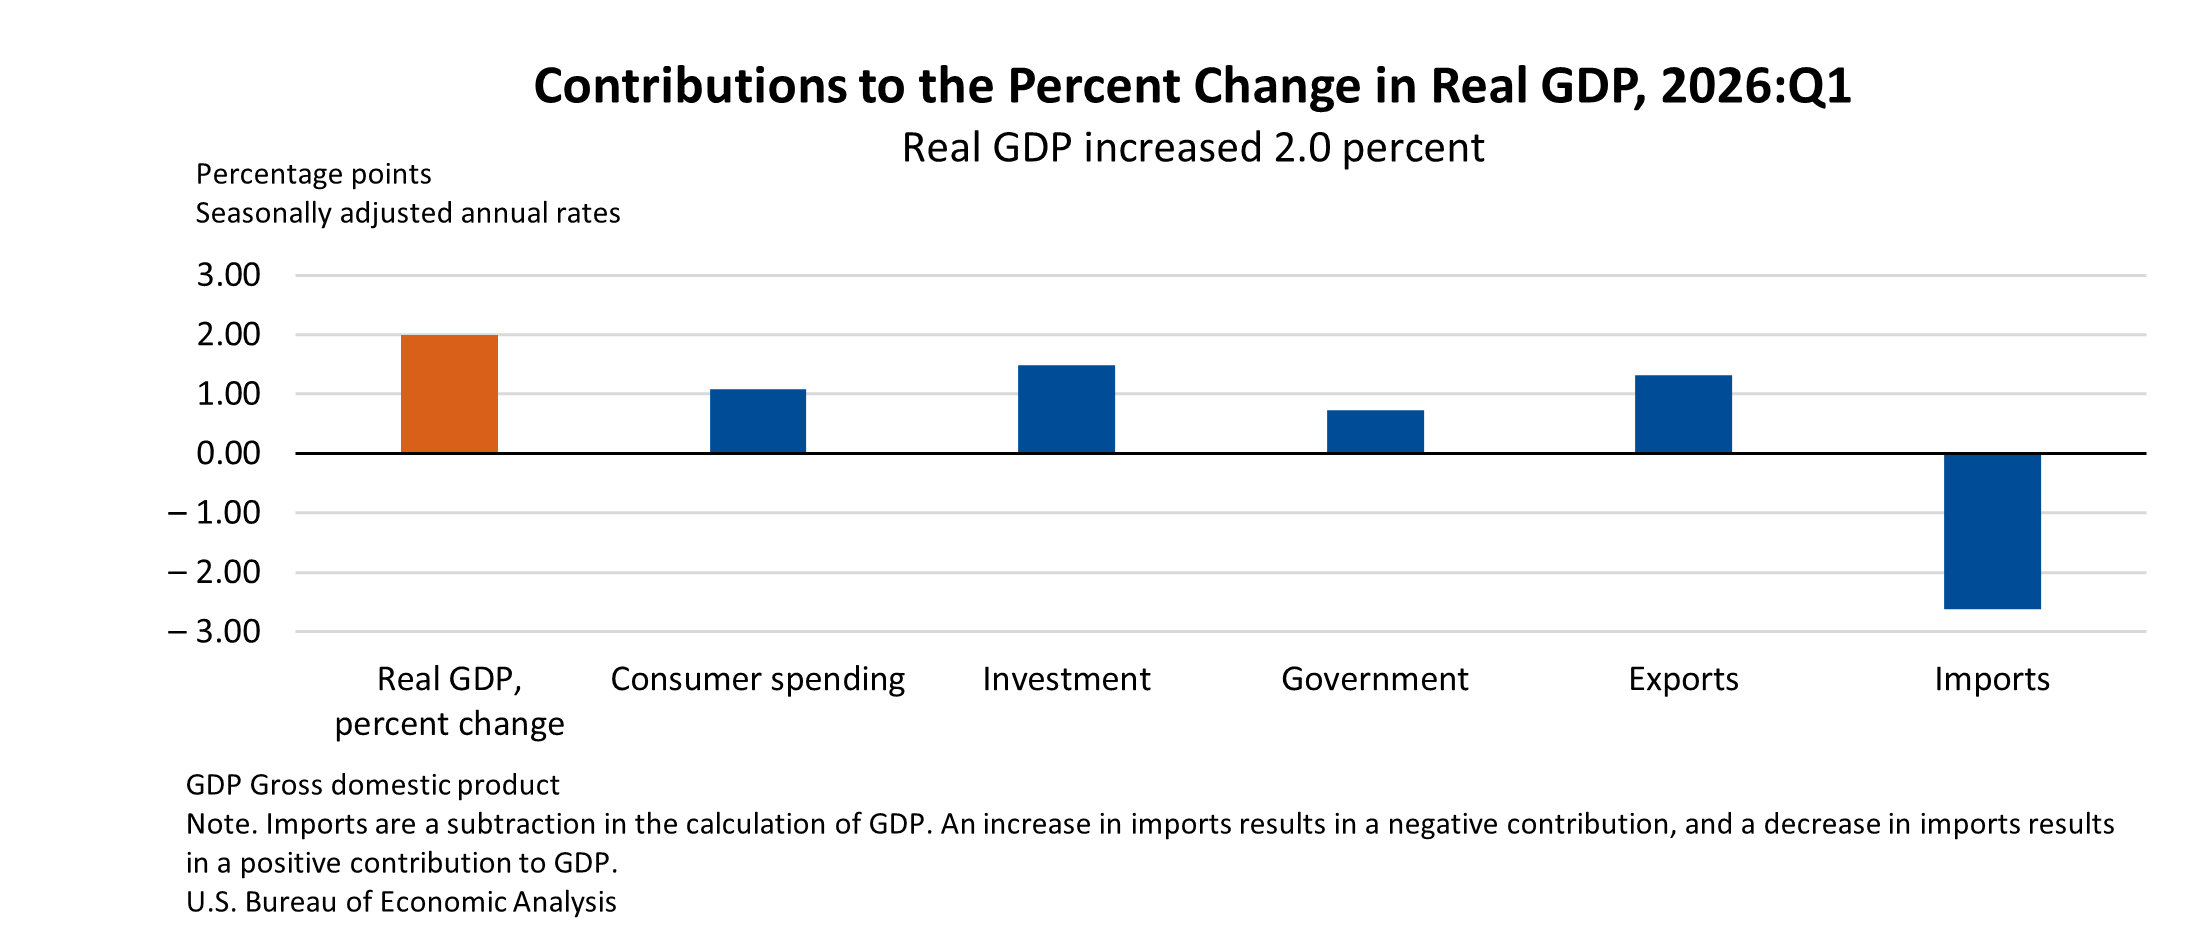
The detailed breakdown of contributors to the first-quarter GDP increase reveals a multifaceted economic expansion. Investment played a significant role, showing an acceleration that bolstered overall growth. This category often encompasses business spending on equipment, structures, and intellectual property products, as well as residential investment. A strong performance in investment can signal business confidence in future economic prospects and a commitment to expanding productive capacity.
Exports also demonstrated a healthy upturn, contributing positively to GDP. An increase in exports means that U.S.-produced goods and services are in higher demand internationally, which can boost domestic production and employment. Conversely, imports, which represent goods and services purchased from abroad and are subtracted in GDP calculations, also increased. The net effect of exports and imports, known as net exports, is a crucial component of GDP, and its movement in the first quarter reflects both global demand for U.S. products and domestic demand for foreign goods.
Consumer spending, while decelerating in its contribution to the overall GDP acceleration compared to the previous quarter, remained a positive force. This component typically constitutes the largest portion of U.S. GDP, and its continued growth, even at a moderated pace, underscores the resilience of household consumption. Government spending, encompassing federal, state, and local government outlays on goods and services, experienced an upturn, providing an additional impetus to economic activity.
A Shift from the Previous Quarter
The transition from the fourth quarter of 2025 to the first quarter of 2026 illustrates a shift in the dynamics of economic growth. The acceleration in real GDP in the first quarter was characterized by a more robust performance in government spending and exports, alongside a re-energized investment sector. This contrasts with the fourth quarter of 2025, where these components may have had a different trajectory. The deceleration in consumer spending’s contribution, while still positive, suggests that other sectors stepped up to drive the overall expansion. The turnaround in imports also indicates a potential increase in domestic demand for foreign-produced goods, which can be a double-edged sword, reflecting both consumer and business activity while simultaneously acting as a drag on the net GDP calculation.
Inflationary Signals and Policy Considerations
The BEA’s report also sheds light on the evolving inflation landscape. While the broader measure of inflation for goods and services purchased domestically saw a slight moderation, the PCE price index, particularly its core component, indicated a more persistent inflationary trend. The increase in the PCE price index, excluding volatile food and energy prices, suggests that underlying price pressures may be building in the economy. This data point is of particular importance to the Federal Reserve, as the PCE price index is its preferred measure of inflation. Persistent inflation, especially above the Fed’s target of 2 percent, could influence future monetary policy decisions, potentially leading to adjustments in interest rates aimed at tempering price growth.
The BEA’s advance estimate provides an initial snapshot of economic performance, and further revisions are anticipated. The second estimate for the first quarter of 2026, which will include more comprehensive data, is scheduled for release on May 28, 2026. These subsequent releases allow economists and policymakers to refine their understanding of the economic trajectory and make more informed decisions.
Context and Historical Perspective
The 2.0 percent GDP growth in the first quarter of 2026 represents a significant acceleration from the 0.5 percent growth seen in the fourth quarter of 2025. This rebound suggests that the economic headwinds experienced in late 2025 may have begun to dissipate, giving way to a more expansionary environment. To fully appreciate the significance of this figure, it is useful to consider it within a broader historical context. Typically, a sustained GDP growth rate of 2-3 percent is considered indicative of a healthy, growing economy. Rates significantly above this can signal overheating, while rates below this may point to sluggishness or a potential recession.
The preceding quarters leading up to the first quarter of 2026 likely witnessed a more subdued economic performance. Understanding the factors that contributed to the slowdown in late 2025, such as potential supply chain disruptions, shifts in consumer confidence, or evolving global economic conditions, would provide further depth to the analysis of the current acceleration. For instance, if the slowdown in late 2025 was primarily due to temporary factors, the rebound in early 2026 could be seen as a return to a more normal growth path. However, if it was indicative of deeper structural issues, the current acceleration might be viewed with more caution.
Broader Economic Implications and Expert Outlook
The acceleration in GDP growth has several potential implications for the U.S. economy. A stronger economy typically translates into job creation, rising household incomes, and increased business investment. For consumers, this could mean greater purchasing power and improved confidence. For businesses, it could signal opportunities for expansion, innovation, and increased profitability.
However, the simultaneous rise in core inflation also presents a complex scenario for policymakers. The Federal Reserve faces the delicate task of balancing economic growth with price stability. If inflation continues to trend upwards, the central bank may need to consider tighter monetary policy, which could, in turn, temper economic growth. Conversely, if the inflationary pressures prove to be transitory, the Fed may be able to maintain a more accommodative stance, allowing the economy to continue its expansionary path.
Economists will be closely scrutinizing the upcoming revisions to the GDP data and closely watching a range of other economic indicators, such as employment figures, retail sales, and manufacturing output, to gain a more comprehensive understanding of the economic landscape. The BEA’s release of the second estimate on May 28, 2026, will be a critical event for economic forecasting and policy planning.
Technical Notes and Data Refinements
The Bureau of Economic Analysis (BEA) employs a rigorous methodology to compile its GDP estimates, relying on a vast array of source data from government agencies and private sector entities. The advance estimate is based on incomplete data, and subsequent releases incorporate more comprehensive and up-to-date information.
The BEA also provides detailed technical notes to explain the methodologies and assumptions underlying its estimates. For instance, the report mentions adjustments made to the PCE price index for legal services in January and March 2026, explaining that such adjustments are sometimes necessary to ensure the accuracy of the national accounts. Furthermore, the report clarifies how refunds related to International Emergency Economic Powers Act (IEEPA) tariffs are treated in the National Economic Accounts, noting that these refunds are considered capital transfers and do not impact first-quarter GDP. These technical details are crucial for a thorough understanding of the data and its limitations.
The BEA’s commitment to transparency is further evidenced by its provision of links to related data tables and archived historical data. This allows researchers, analysts, and the public to delve deeper into the specifics of the GDP estimates and track economic trends over time. The interactive data application on the BEA website serves as a valuable resource for accessing and analyzing this wealth of economic information.
In conclusion, the advance estimate of 2.0 percent real GDP growth in the first quarter of 2026 signals a positive and accelerating economic environment. The contributions from investment, exports, consumer spending, and government spending paint a picture of broad-based economic activity. However, the accompanying uptick in core inflation suggests that policymakers will need to navigate a complex economic landscape, balancing the imperative of sustained growth with the need for price stability. The upcoming second estimate will provide further clarity on the strength and sustainability of this economic expansion.


