Lana Rhoades
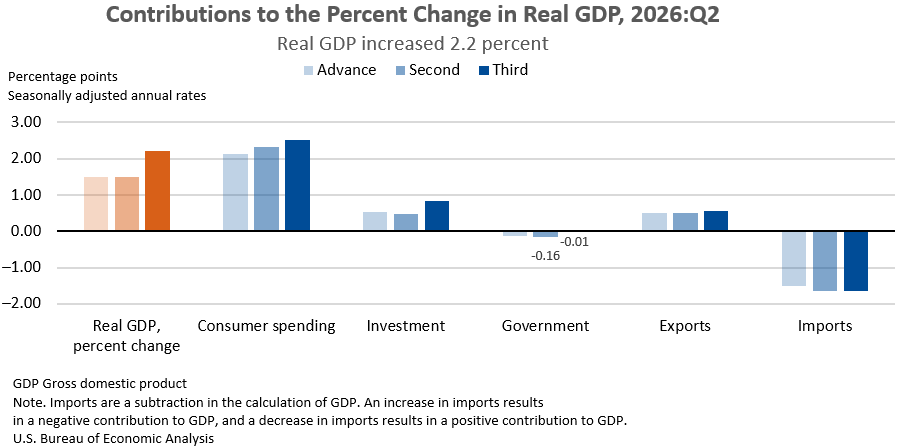
The United States economy demonstrated a steady pace of expansion in the second quarter of 2026, with real gross domestic product (GDP) increasing at an annualized rate of 2.2 percent. This upward revision, from 1.5 percent in the second estimate, signifies a more robust performance than initially reported, according to the third and final estimate from the U.S. Bureau of Economic Analysis (BEA). This marks a slight deceleration from the 2.5 percent growth observed in the first quarter of 2026, indicating a period of sustained but moderating economic activity. The upward revision to the second quarter’s GDP was primarily fueled by stronger-than-anticipated contributions from investment, consumer spending, and government expenditures.
Key Economic Drivers and Revisions
The latest BEA figures reveal that consumer spending, investment, and exports were the principal engines propelling the second-quarter GDP growth. Conversely, imports, which are subtracted in the calculation of GDP, experienced an increase, acting as a slight drag on the overall growth rate. The upward revisions to investment, consumer spending, and government spending suggest a broad-based strengthening across key sectors of the economy, painting a more optimistic picture of the economic landscape.
Analysis of the BEA’s data indicates that real final sales to private domestic purchasers, a measure that excludes inventory fluctuations and focuses on direct demand from consumers and businesses, surged by 4.6 percent in the second quarter. This represents a significant upward revision from the previous estimate of 4.2 percent and underscores the underlying strength of private sector demand. This metric is often seen as a more reliable indicator of sustainable economic growth, as it reflects actual spending on goods and services rather than changes in business inventories.
Industry-Specific Performance
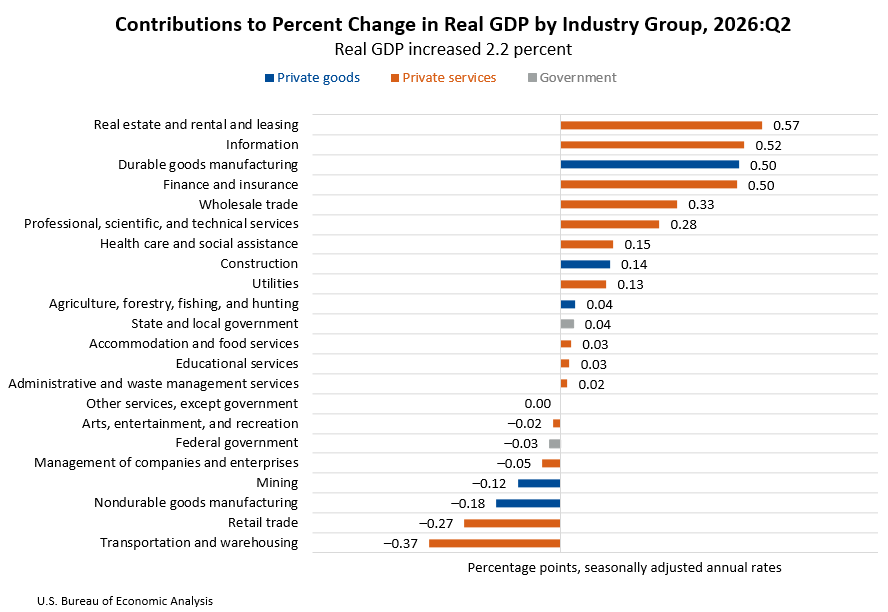
On an industry-by-industry basis, the nation’s economic output was broadly distributed. The real value added for private services-producing industries saw a healthy increase of 2.5 percent. Similarly, private goods-producing industries posted a 2.3 percent rise in real value added, indicating a broad-based expansion across both service and manufacturing sectors. The government sector also contributed, albeit at a more modest pace of less than 0.1 percent.
Several industries emerged as leading contributors to the overall GDP increase. Real estate and rental and leasing activities played a significant role, alongside notable growth in the information sector, durable goods manufacturing, and finance and insurance. These sectors collectively showcase a dynamic economy with diverse areas of strength. However, certain sectors acted as offsets to this growth. Declines were observed in transportation and warehousing, retail trade, and nondurable goods manufacturing, suggesting potential headwinds or sector-specific challenges within these areas.
Broader Economic Indicators
Beyond GDP, other key economic measures provided further insights into the second quarter’s performance. Real gross output, a measure of the total value of goods and services produced by the economy, increased by 5.0 percent. This was driven by robust growth in private services-producing industries (6.0 percent) and private goods-producing industries (3.0 percent), with government also contributing 2.6 percent.
Real gross domestic income (GDI), which measures the income earned by all sectors of the economy, also showed positive momentum, increasing by 2.6 percent. This figure was revised upward from the previous estimate, suggesting that the income generated by economic activity kept pace with the production of goods and services. The average of real GDP and real GDI, often considered a more comprehensive measure of economic performance, rose by 2.4 percent, reflecting a solid and broadly aligned economic expansion.
Corporate profits from current production saw a substantial increase of $384.0 billion in the second quarter, though this figure was revised downward slightly from initial estimates. This indicates that businesses continued to generate significant profits, a positive sign for investment and job creation.
Inflationary Trends
On the inflation front, the price index for gross domestic purchases, a broad measure of inflation for goods and services purchased by U.S. residents, increased by 5.6 percent. While still elevated, this figure was revised downward from previous estimates, suggesting a slight moderation in price pressures. The personal consumption expenditures (PCE) price index, a closely watched inflation metric by the Federal Reserve, rose by 5.0 percent. The core PCE price index, which excludes volatile food and energy prices, increased by 3.3 percent. These figures, also revised downward, indicate a gradual easing of inflationary pressures, though they remain above the Federal Reserve’s target.
Regional Economic Performance
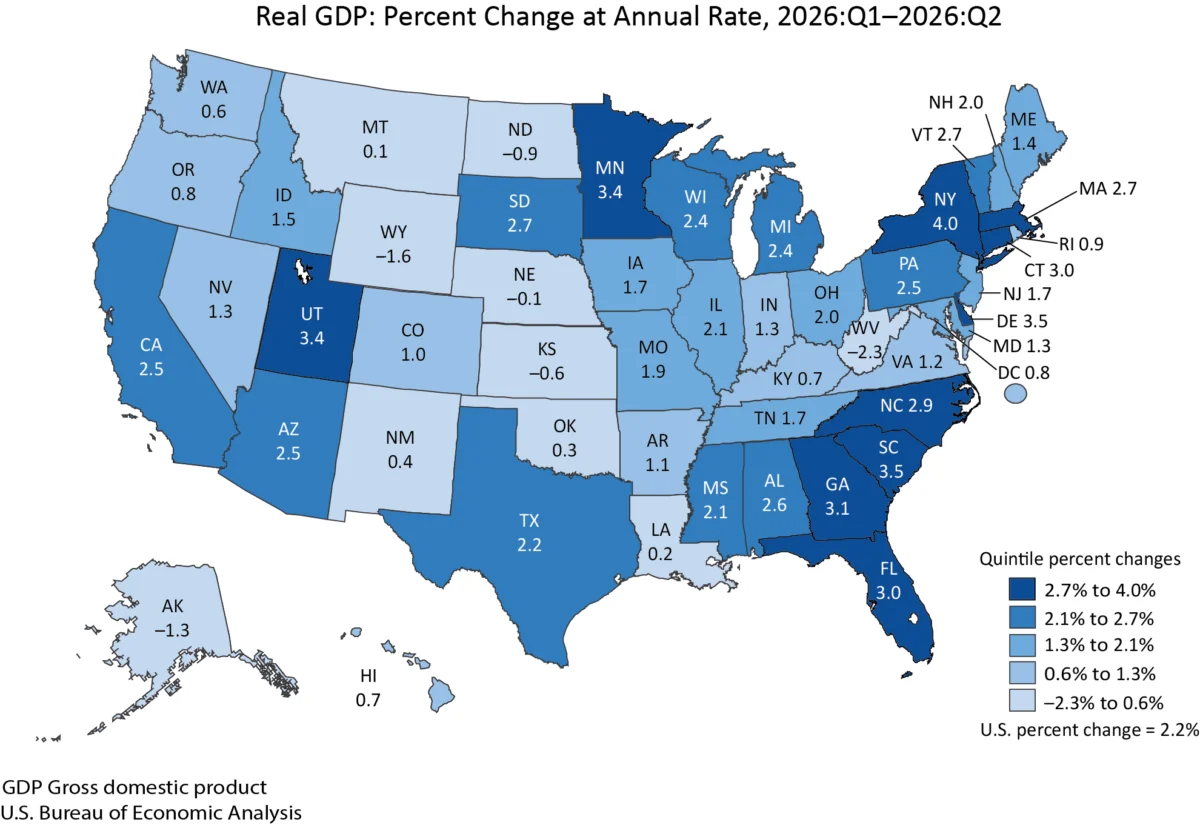
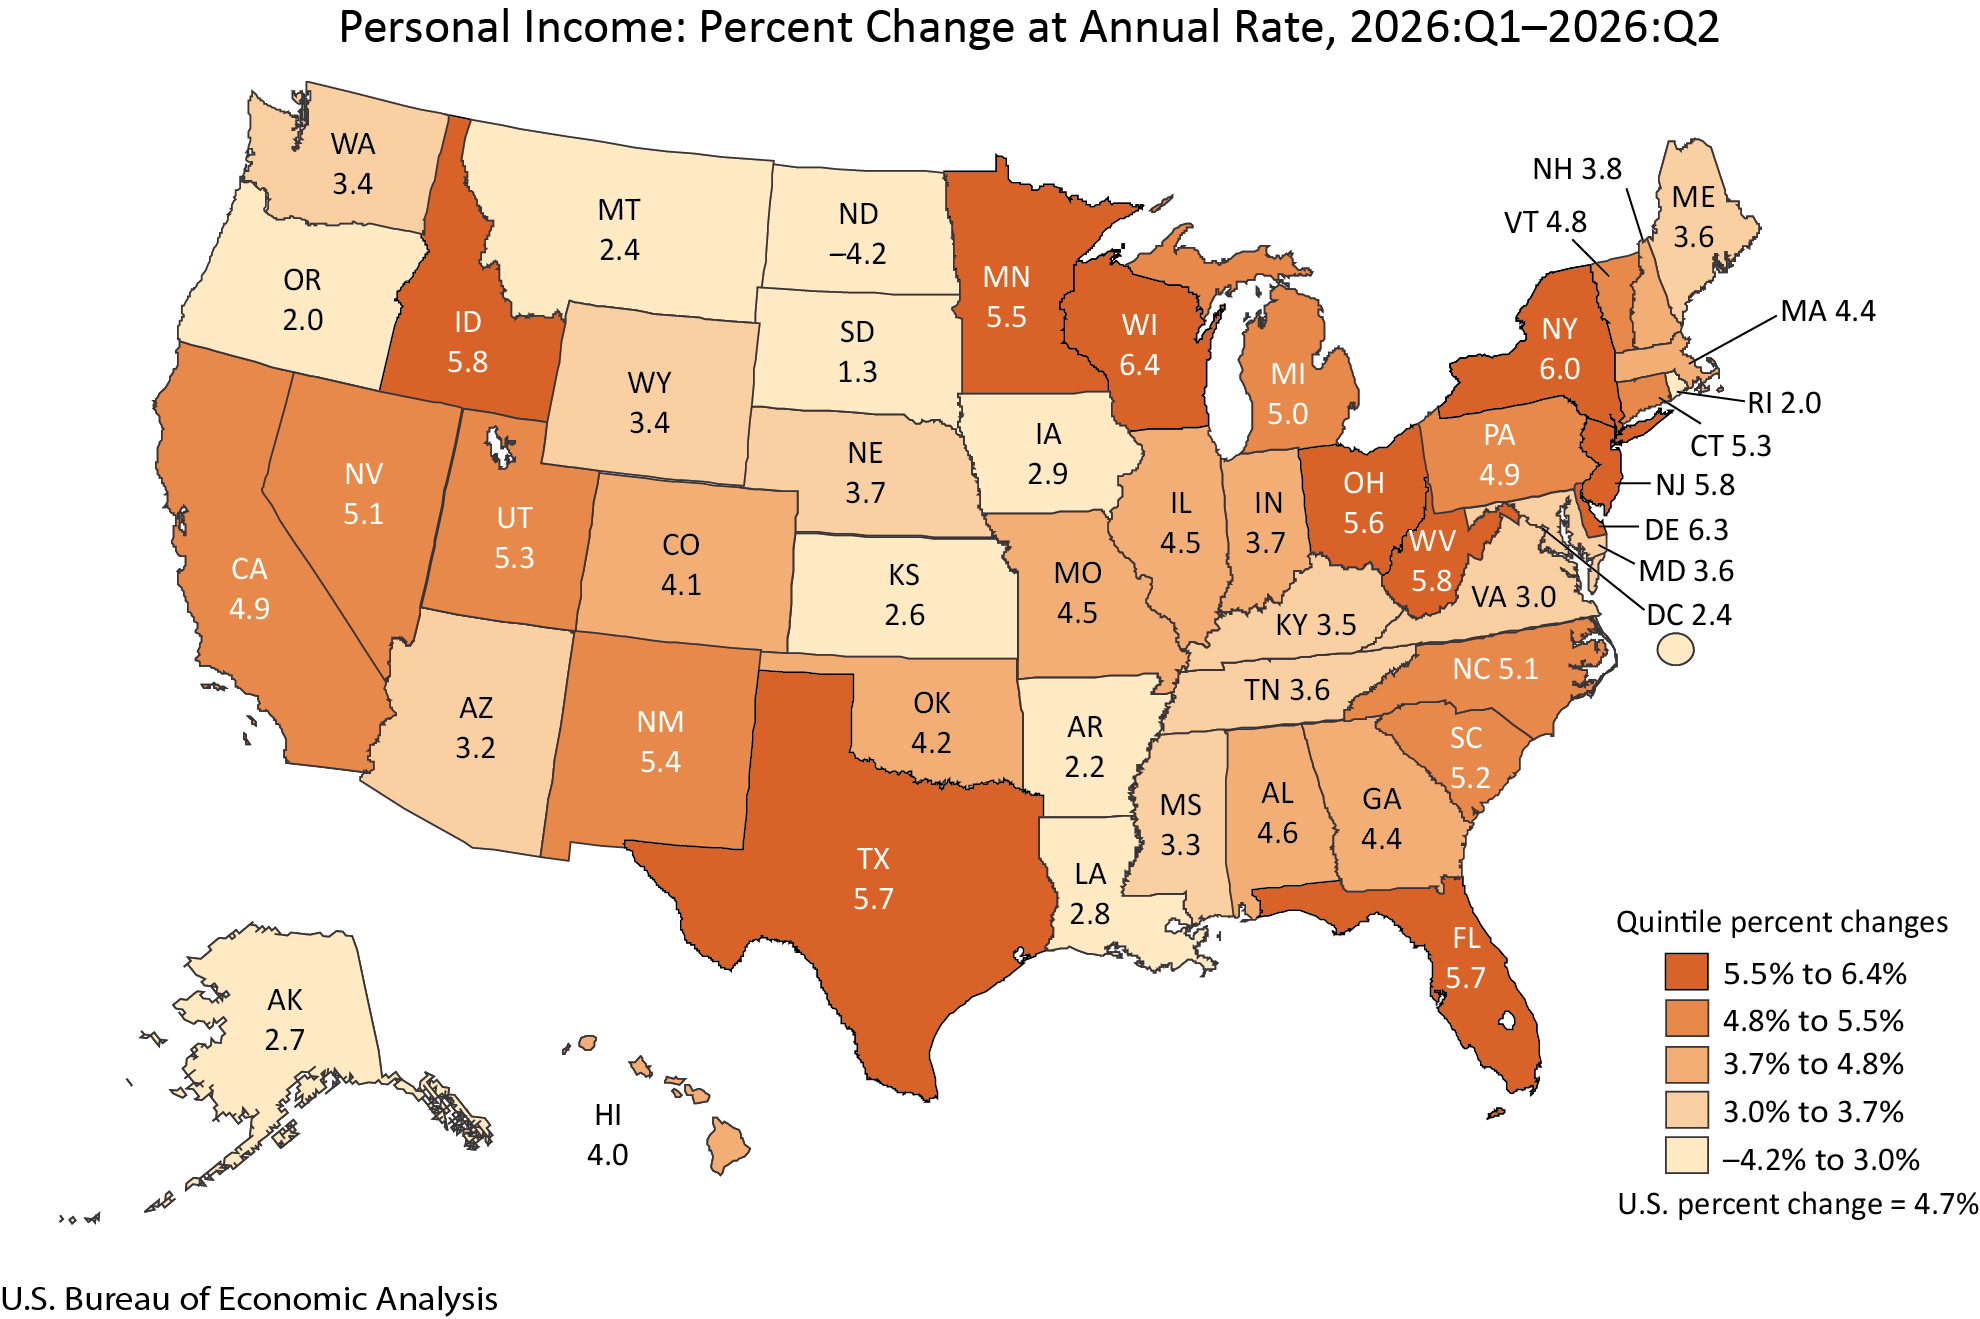
The economic expansion in the second quarter was not uniform across the nation, with varying growth rates observed at the state level. Real GDP increased in 44 states and the District of Columbia. New York led the nation in growth, with its real GDP expanding at an impressive 4.0 percent annual rate. Conversely, West Virginia experienced a contraction in its real GDP, declining by 2.3 percent.
In New York and Delaware, the finance and insurance sector was a primary driver of GDP growth. Meanwhile, mining activities were identified as the leading contributor to the economic downturn in West Virginia and Wyoming. This highlights the diverse economic structures and sector-specific influences at play across different regions of the United States.
Personal Income and Consumer Spending by State
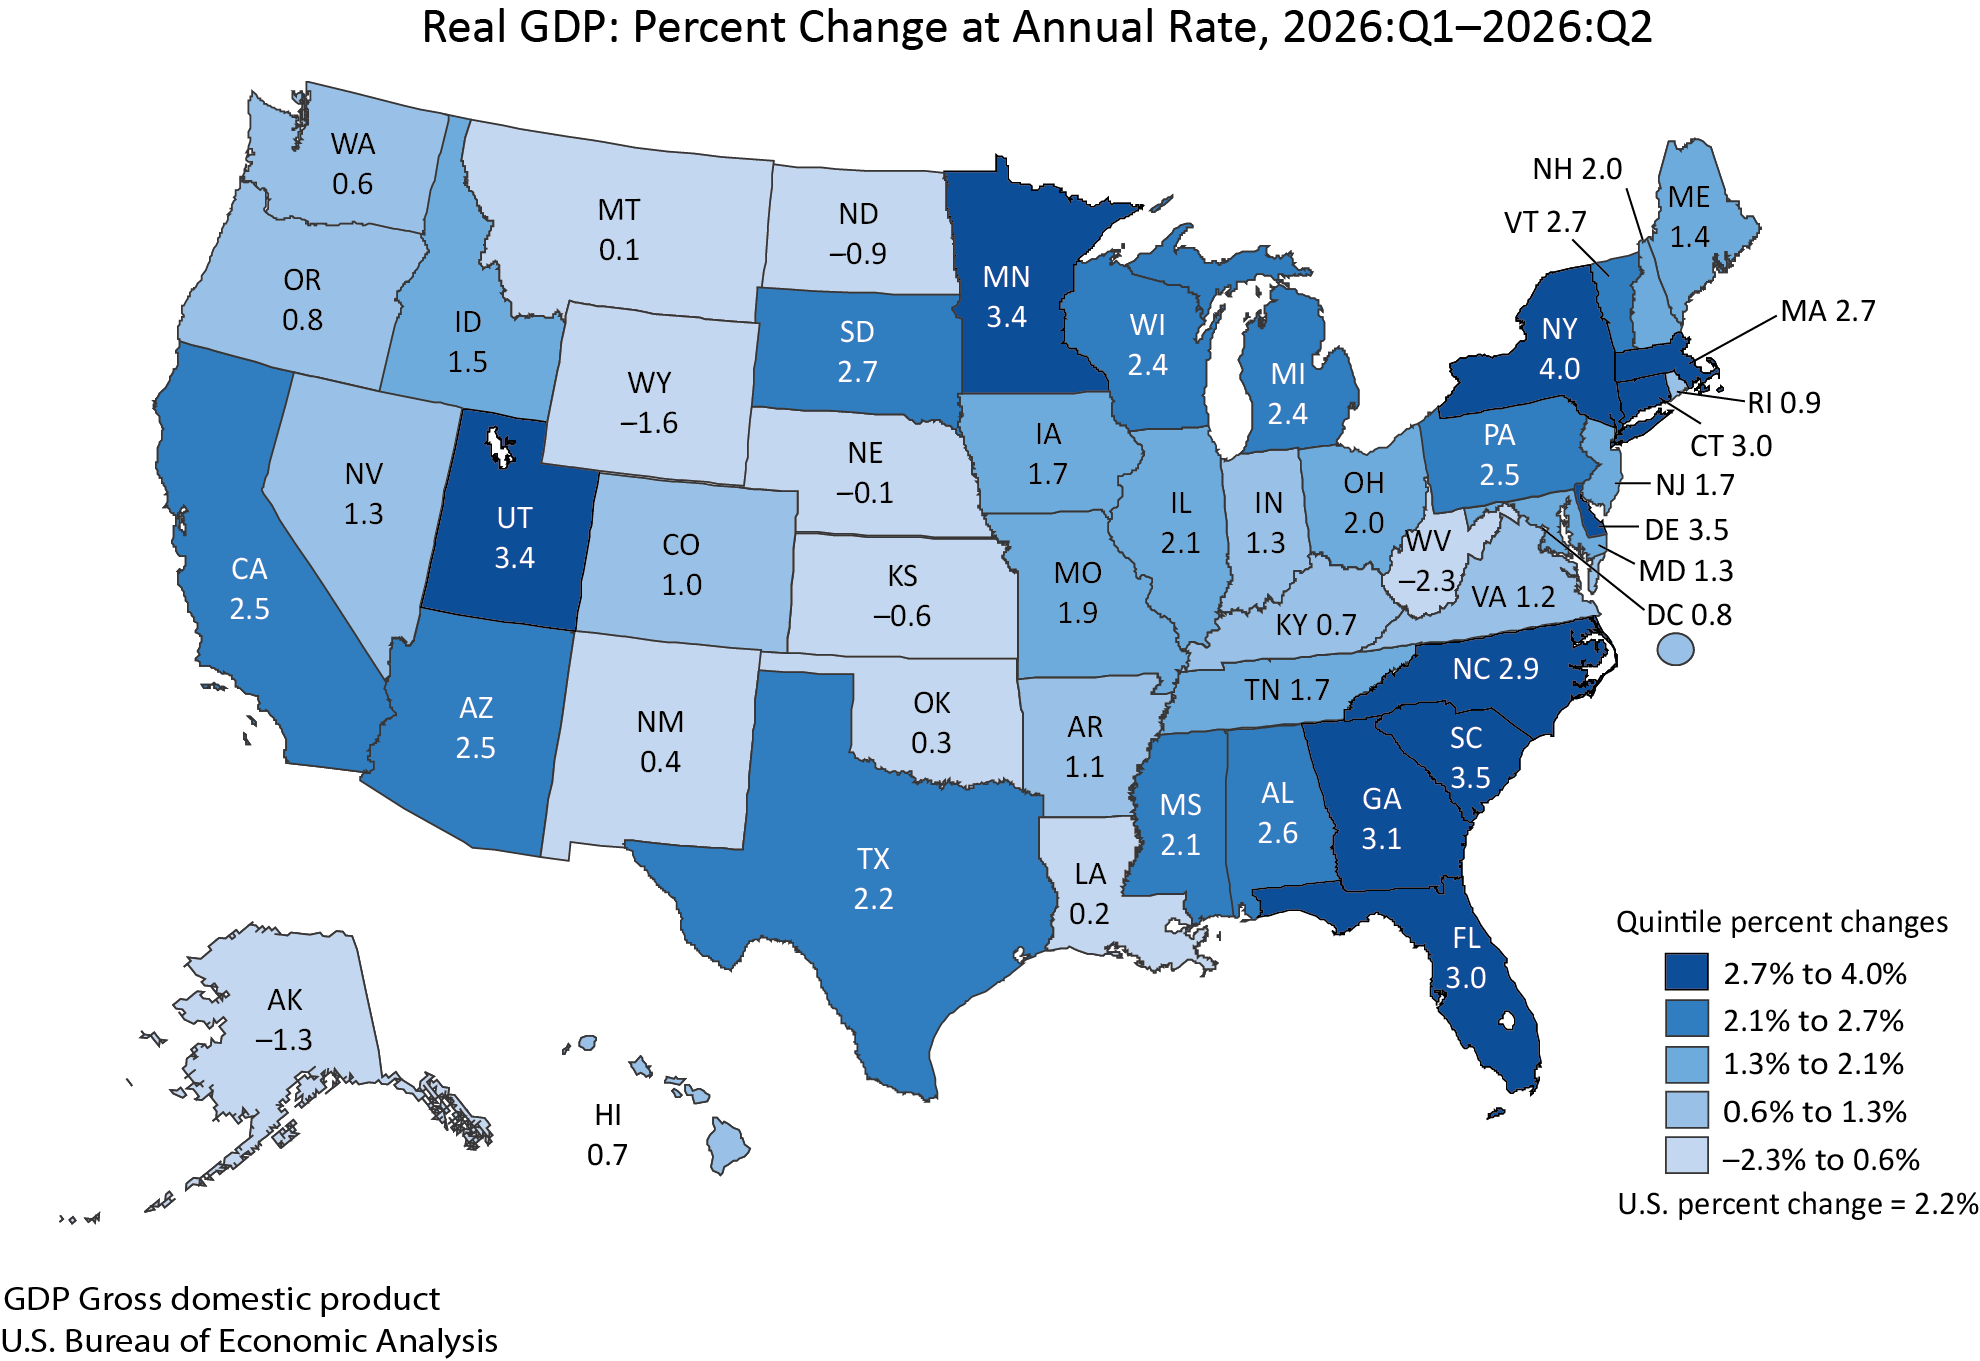
Personal income across the nation also saw an upward trend in the second quarter of 2026. Current-dollar personal income increased by $314.3 billion, or 4.7 percent at an annual rate. This growth was widespread, with 49 states and the District of Columbia experiencing increases. Wisconsin recorded the highest growth rate in personal income at 6.4 percent annually, while North Dakota saw a decline of 4.2 percent.
Earnings, which comprise compensation and proprietors’ income, also showed broad-based increases, rising in 48 states and the District of Columbia. Minnesota posted the strongest earnings growth at 7.3 percent, while North Dakota experienced a significant contraction of 9.3 percent. Personal current transfer receipts, such as government benefits, increased in 48 states, with Wisconsin leading at 13.0 percent growth. Property income, including dividends, interest, and rent, saw increases in all 50 states and the District of Columbia, indicating a stable and growing investment income landscape.
Personal consumption expenditures (PCE) by state also reflected varied growth patterns. In 2025, PCE increased by 5.3 percent nationally. By state, PCE growth ranged from 7.0 percent in Florida to 4.2 percent in California. Health care and housing and utilities were identified as the primary drivers of PCE increases in most states, underscoring their consistent importance in household budgets.
Annual Updates and Revisions
This release also incorporated the results of the 2026 annual update of the National Economic Accounts, which cover data from the first quarter of 2021 through the first quarter of 2026. These updates led to revisions in GDP, GDP by industry, GDI, and their major components. The reference year for these accounts remains 2017.
For the first quarter of 2026, real GDP was revised upward to a 2.5 percent increase, a notable upward adjustment from the previously estimated 2.1 percent. This revision was primarily attributed to stronger-than-expected exports of services and increased consumer spending on both goods and services. Real final sales to private domestic purchasers for the first quarter were also revised upward to 1.8 percent.
Industry-level revisions for the first quarter showed mixed results. Private goods-producing industries experienced a downward revision to their real value added, while private services-producing industries saw an upward revision. The government sector’s real value added was revised downward.
Economic Context and Implications
The sustained, albeit moderating, growth in GDP for the second quarter of 2026 suggests that the U.S. economy is navigating a complex global environment with resilience. The upward revisions indicate that the economy’s underlying momentum was stronger than initially assessed. The robust performance of consumer spending and investment is a positive signal for continued economic expansion, as these are key drivers of demand and job creation.
However, the continued presence of elevated inflation, even with downward revisions, remains a key concern. The Federal Reserve will likely closely monitor these inflation figures as it considers its monetary policy path. The divergence in regional economic performance also highlights the importance of state-specific economic policies and the need for targeted support in areas experiencing contractions.
The annual updates to the national and regional economic accounts provide a more accurate historical picture of economic performance. These revisions help economists, policymakers, and businesses make more informed decisions by offering a refined understanding of past trends and their implications for future economic trajectories.
The BEA’s comprehensive data releases, including GDP by industry, personal income, and PCE by state, offer a granular view of economic activity. This detailed information is crucial for understanding the diverse economic landscape of the United States and for formulating effective economic strategies at both the national and sub-national levels. The next release, scheduled for October 29, 2026, will provide the advance estimate for third-quarter 2026 GDP, offering further insights into the economy’s ongoing performance.