

 Lana Rhoades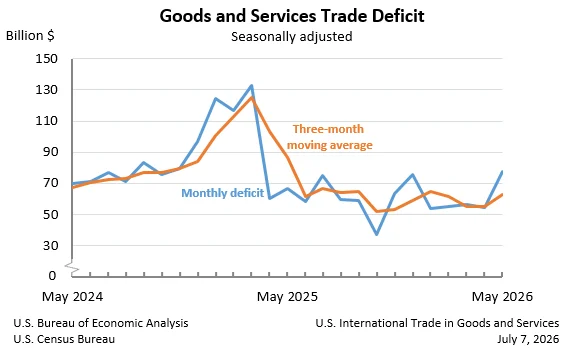
The United States experienced a significant expansion in its trade deficit in May, with the gap between exports and imports of goods and services reaching $77.6 billion. This marks a substantial increase of $23.0 billion from the revised $54.6 billion deficit recorded in April, according to joint data released today by the U.S. Census Bureau and the U.S. Bureau of Economic Analysis. This widening deficit underscores persistent challenges in the nation’s trade balance, particularly within the goods sector, while the services surplus provided a partial offset.
Key Figures and Trends in May Trade Data
The latest report reveals a complex picture of U.S. international trade. Total exports in May stood at $317.7 billion, a decrease of $10.5 billion from the previous month. Conversely, imports surged to $395.3 billion, an increase of $12.5 billion compared to April. This divergence in export and import performance directly contributed to the ballooning deficit.
Digging deeper into the components of the trade balance, the goods deficit saw a notable deterioration, expanding by $23.6 billion to reach $106.5 billion. This significant rise in the goods deficit was partially mitigated by a modest increase in the services surplus, which grew by $0.6 billion to $28.9 billion. The services sector has historically been a bright spot for the U.S. economy, and its continued surplus offers a degree of resilience amidst the challenges in goods trade.
Analysis of the May Trade Imbalance
The 42.2% increase in the overall goods and services deficit from April to May is a stark indicator of shifting trade dynamics. This substantial jump suggests that the U.S. economy is importing more goods and exporting fewer, a trend that can have far-reaching implications for domestic industries, employment, and the broader economic landscape.
Underlying Drivers of the Widening Deficit
The report provides a granular view of the factors contributing to this widening gap. Exports of goods, a crucial component of U.S. economic activity, declined by $11.3 billion to $210.6 billion in May. This decline was reflected in both Census basis exports, which fell by $11.6 billion, and a slight increase of $0.3 billion in net balance of payments adjustments. The decrease in goods exports signals potential challenges for U.S. manufacturers and agricultural producers in accessing international markets or a reduction in global demand for American-made products.
On the import side, the picture is reversed. Imports of goods climbed by $12.3 billion to $317.0 billion. This increase was driven by a $12.1 billion rise in imports of goods on a Census basis, with net balance of payments adjustments contributing an additional $0.2 billion. The surge in imports suggests a robust domestic demand for foreign-produced goods, potentially reflecting consumer spending patterns, business investment in imported capital goods, or supply chain dynamics.
Exports of services, while increasing by $0.8 billion to $107.1 billion, were not enough to offset the decline in goods exports and the rise in goods imports. Similarly, imports of services also saw a slight increase of $0.2 billion, reaching $78.2 billion.
Real Goods Deficit: A Deeper Dive
When adjusting for price changes, the real goods deficit, measured in 2017 dollars on a Census basis, also increased significantly. In May, the real goods deficit expanded by $15.8 billion, or 18.7 percent, to $100.0 billion. This is a notable increase, even when compared to the 28.8 percent rise in the nominal deficit. The fact that the real deficit is growing at a substantial pace indicates that the widening gap is not solely attributable to inflation but also to a genuine increase in the volume of imported goods relative to exported goods.
Year-to-Date Trends Offer a Different Perspective
While the monthly figures paint a concerning picture, a look at the year-to-date data reveals a more nuanced trend. For the period from January to May, the goods and services deficit has actually decreased by $203.9 billion, or 40.6 percent, compared to the same period in 2025. This substantial year-to-date improvement is a result of significant increases in exports, which rose by $164.7 billion, or 11.7 percent, and a decrease in imports, which fell by $39.2 billion, or 2.1 percent.
This divergence between monthly and year-to-date trends suggests that the May figures might represent a temporary setback or a seasonal fluctuation within a broader pattern of improving trade performance. However, the sharp increase in the deficit in May warrants close monitoring to determine if it signifies a reversal of the year-to-date positive trend.
Three-Month Moving Averages Provide Smoothed Outlook
To account for monthly volatility, the report also provides data on three-month moving averages. The average goods and services deficit for the three months ending in May increased by $7.5 billion to $62.9 billion. This indicates that while the May figure was a significant jump, the trend over the preceding months was also trending upwards, albeit at a less dramatic pace.
Year-over-year, the average goods and services deficit has decreased by $23.8 billion for the three months ending in May 2026 compared to the same period in the previous year. This suggests that, on average, the trade deficit remains smaller than it was a year ago, reinforcing the year-to-date improvement.
Trade Balances with Key Trading Partners
The report also details trade balances with specific countries and regions. In May, the U.S. recorded surpluses with several trading partners, including the Netherlands ($9.1 billion), Hong Kong ($5.6 billion), South and Central America ($4.8 billion), Australia ($1.9 billion), and the United Kingdom ($1.4 billion). Surpluses were also noted with Brazil ($1.1 billion), Singapore ($0.9 billion), Belgium ($0.7 billion), and Saudi Arabia ($0.3 billion).
Conversely, significant deficits were observed with Vietnam ($20.6 billion), Mexico ($20.1 billion), Taiwan ($19.4 billion), and China ($14.5 billion). Other notable deficits included those with the European Union ($9.3 billion), Canada ($7.0 billion), Germany ($5.7 billion), and Japan ($2.0 billion). These figures highlight the concentration of trade imbalances with specific economies, often reflecting complex supply chain relationships and differing economic structures.
Context and Background: The Persistent Trade Deficit Challenge
The United States has historically run a trade deficit in goods, meaning it imports more goods than it exports. This has been a subject of ongoing economic and political debate, with concerns raised about its impact on domestic manufacturing, job creation, and national debt. Factors contributing to this persistent deficit include a strong U.S. dollar (making imports cheaper and exports more expensive), relatively higher consumer demand for imported goods, and global economic conditions.
The services sector, on the other hand, has typically shown a surplus for the U.S., driven by strong performance in areas like financial services, tourism, and intellectual property exports. The interplay between these two sectors—a widening goods deficit and a growing services surplus—has been a defining characteristic of U.S. international trade in recent decades.
Implications of the Widening Deficit
The significant increase in the May trade deficit could have several implications:
- Impact on Domestic Industries: A rising deficit, particularly in goods, can put pressure on domestic manufacturers as they face increased competition from imports. This could potentially lead to reduced production, slower job growth in manufacturing sectors, or even job losses if domestic industries are unable to compete effectively.
- Economic Growth: While imports can satisfy domestic demand and contribute to economic activity, a persistently large and growing deficit can signal an over-reliance on foreign production. It can also lead to a net outflow of capital from the country.
- Currency Valuation: A widening trade deficit can, over time, put downward pressure on the U.S. dollar as the country needs to sell more dollars to buy foreign currency to pay for its imports. However, other factors, such as global capital flows and monetary policy, also heavily influence currency valuation.
- Government Policy: The trade deficit is often a key consideration for policymakers. A widening deficit could prompt discussions about trade policy, tariffs, export promotion initiatives, and efforts to encourage domestic production.
Revisions to Previous Data
The report also includes revisions to April data. While specific details on the magnitude of these revisions were not elaborated upon in the provided text, it is standard practice for the Census Bureau and BEA to release revised figures as more complete data becomes available. These revisions are crucial for providing the most accurate picture of trade flows.
Looking Ahead: Next Release and Future Trends
The next release of U.S. International Trade in Goods and Services data is scheduled for August 4, 2026, covering the trade figures for June 2026. Market participants and economic analysts will be closely watching these future reports to ascertain whether the sharp increase in the May deficit is an anomaly or the beginning of a new trend. Understanding the drivers behind these monthly fluctuations, as well as the longer-term trajectories of exports and imports, will be critical for assessing the health and competitiveness of the U.S. economy in the global marketplace. The continued strength of the services sector will remain a key factor in buffering the impact of goods trade imbalances.








