Lana Rhoades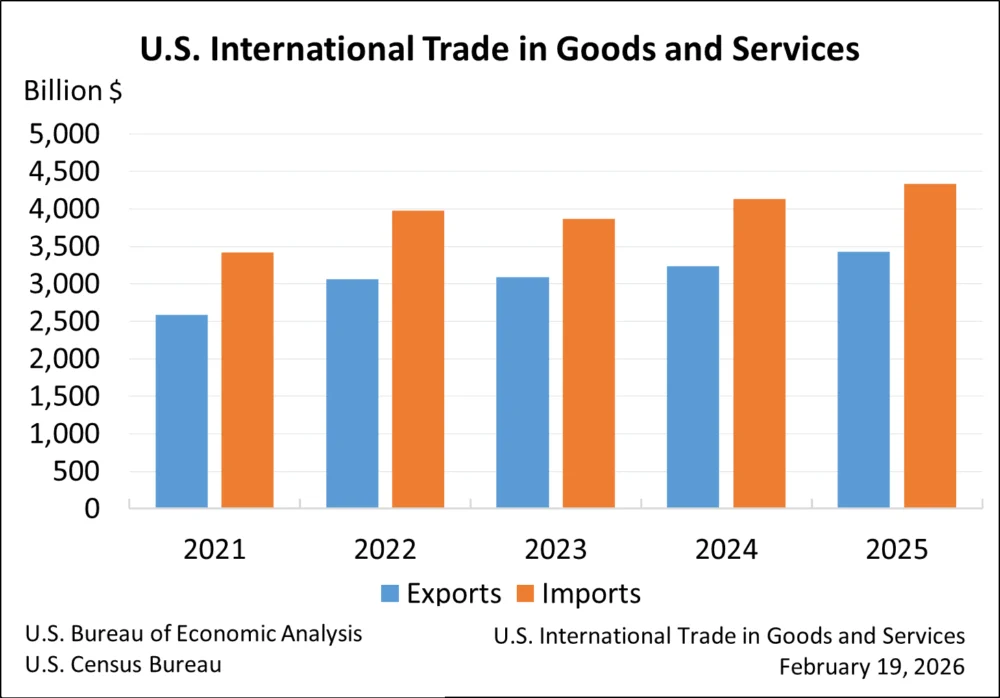
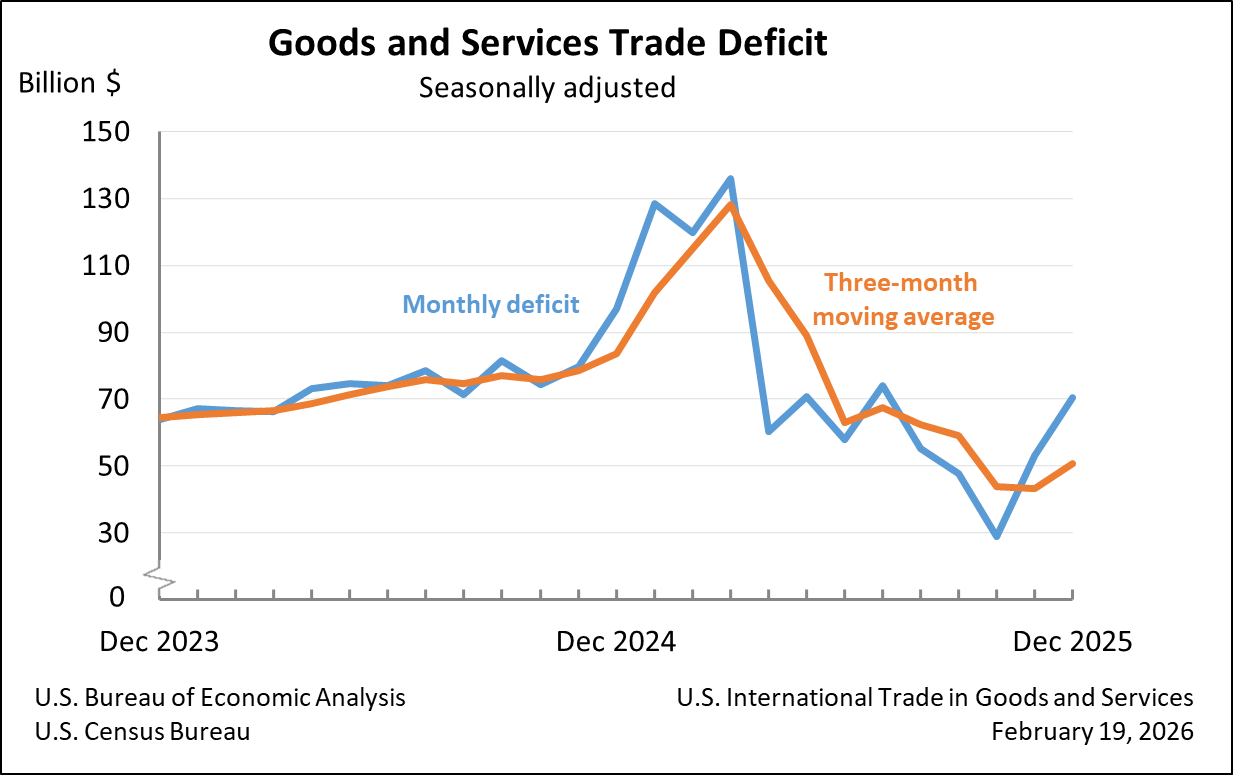
The United States experienced a substantial widening of its trade deficit in December, as announced today by the U.S. Census Bureau and the U.S. Bureau of Economic Analysis. The goods and services deficit reached $70.3 billion for the month, marking a significant increase of $17.3 billion from the revised $53.0 billion deficit recorded in November. This surge was primarily fueled by a notable rise in imports of goods, even as exports saw a modest decline.
December Trade Picture: A Sharper Imbalance
The December data reveals a more pronounced imbalance in U.S. international trade. Exports for the month totaled $287.3 billion, a decrease of $5.0 billion from November. Conversely, imports surged by $12.3 billion to $357.6 billion, underscoring the primary driver of the expanded deficit.
Digging deeper into the components of the trade balance, the goods deficit alone escalated by $15.7 billion to $99.3 billion in December. This adverse movement in goods trade was partially offset by a decrease in the surplus from services trade, which shrank by $1.6 billion to $29.0 billion. The combination of a worsening goods balance and a less robust services surplus contributed directly to the overall widening of the deficit.
When viewed on a real, inflation-adjusted basis (in 2017 dollars, on a Census basis), the deficit in goods trade also saw a significant uptick. The real goods deficit increased by $12.5 billion, or 14.8 percent, to $97.1 billion in December. This real-terms increase was even more pronounced than the nominal deficit’s rise, suggesting a substantial increase in the volume of goods imported relative to exported.
Annual Review: A Mixed Picture for 2025
Looking at the full year 2025, the U.S. goods and services deficit stood at $901.5 billion. While this represents a slight decrease of $2.1 billion, or 0.2 percent, from the 2024 deficit of $903.5 billion, the underlying trends reveal a dynamic shift.
For the entirety of 2025, total exports saw a robust increase of $199.8 billion, or 6.2 percent, reaching $3,432.3 billion. Imports also grew, albeit at a slightly slower pace, increasing by $197.8 billion, or 4.8 percent, to $4,333.8 billion. The annual figures indicate a growing volume of international trade overall, with imports outpacing exports in absolute dollar terms, contributing to the persistent, albeit slightly reduced, overall deficit.
The annual breakdown further highlights the divergence between goods and services. The goods deficit for 2025 widened by $25.5 billion, or 2.1 percent, to $1,240.9 billion. In contrast, the services surplus expanded by $27.6 billion, or 8.9 percent, to $339.5 billion. This contrast suggests that while the U.S. continues to experience a growing surplus in services, the expanding deficit in goods trade is a persistent challenge to achieving a more balanced trade position.
On a real, inflation-adjusted basis (in 2017 dollars, Census basis), the annual goods deficit saw a more significant increase. The real goods deficit for 2025 climbed by $64.4 billion, or 5.7 percent, to $1,197.1 billion. This contrasts with the 2.1 percent increase in the nominal goods deficit for the same period, indicating that the real volume of imported goods has outpaced exported goods considerably over the year.
Key Drivers: Shifting Trade Flows
Exports:
In December, the decline in total exports was primarily attributed to a $5.5 billion decrease in goods exports, bringing them down to $180.8 billion. On a Census basis, goods exports fell by $5.6 billion, with a minor upward adjustment of $0.1 billion from net balance of payments adjustments. Conversely, exports of services demonstrated resilience, increasing by $0.5 billion to $106.5 billion in December.
For the full year 2025, goods exports saw a substantial increase of $117.7 billion, reaching $2,197.5 billion. This growth on a Census basis was $123.5 billion, though net balance of payments adjustments led to a decrease of $5.8 billion in the overall reported goods exports. Services exports also experienced significant growth throughout 2025, rising by $82.1 billion to $1,234.9 billion.
Imports:
The surge in imports during December was heavily concentrated in goods. Imports of goods rose by $10.2 billion to $280.2 billion, with this increase mirrored precisely in imports of goods on a Census basis. Net balance of payments adjustments added a negligible amount to this figure. Services imports also contributed to the widening deficit, increasing by $2.0 billion to $77.4 billion in December.
Over the course of 2025, imports of goods saw a substantial expansion of $143.2 billion, totaling $3,438.4 billion. Imports of goods on a Census basis increased by $149.3 billion, with a downward adjustment of $6.1 billion from net balance of payments adjustments. Imports of services also grew considerably, by $54.5 billion, to $895.4 billion in 2025.
Trade Balances by Region and Country
The December trade figures also provide a snapshot of bilateral trade relationships. The U.S. recorded trade surpluses with several countries and regions, including the Netherlands ($5.6 billion), South and Central America ($4.3 billion), the United Kingdom ($3.7 billion), Hong Kong ($2.5 billion), and Brazil ($2.1 billion). Significant surpluses were also noted with Belgium ($1.4 billion), Singapore ($1.1 billion), Saudi Arabia ($0.2 billion), Australia ($0.2 billion), and Switzerland ($0.1 billion).
Conversely, substantial deficits were observed with key trading partners. Taiwan led the list with a deficit of $19.8 billion, followed by Vietnam ($17.6 billion), Mexico ($14.5 billion), China ($12.4 billion), and the European Union ($11.1 billion). Other countries with notable deficits included Germany ($6.9 billion), South Korea ($5.8 billion), Japan ($5.3 billion), India ($5.2 billion), and Canada ($4.9 billion).
The annual data for 2025 further illustrates these patterns. The U.S. maintained significant surpluses with the Netherlands ($60.7 billion), South and Central America ($52.4 billion), the United Kingdom ($32.2 billion), Hong Kong ($28.5 billion), and Brazil ($14.4 billion).
However, the annual deficits were more pronounced. The largest annual deficits were recorded with the European Union ($218.8 billion), China ($202.1 billion), Mexico ($196.9 billion), Vietnam ($178.2 billion), and Taiwan ($146.8 billion). Other countries with substantial annual deficits included Ireland ($114.2 billion), Germany ($73.0 billion), Thailand ($71.9 billion), Japan ($63.9 billion), and India ($58.2 billion).
Economic Context and Implications
The widening trade deficit in December, particularly the surge in goods imports, occurs against a backdrop of a complex global economic environment. While strong consumer demand in the U.S. can contribute to import growth, persistent supply chain issues and inflationary pressures can also play a role. The increase in the real goods deficit suggests that the volume of goods being imported is growing at a faster rate than exports, which could have implications for domestic industries and employment.
Economists often view a persistent trade deficit as a signal that a country is consuming more than it produces. This can be financed through foreign investment, but a continually expanding deficit can raise concerns about long-term debt and economic stability. The strength of the U.S. dollar also plays a crucial role, making imports cheaper for domestic consumers and businesses, while making U.S. exports more expensive for foreign buyers.
The services sector, which has been a bright spot for the U.S. trade balance, continues to show strength. The growing surplus in services, driven by areas such as travel, financial services, and intellectual property, partially cushions the impact of the goods deficit. However, the magnitude of the goods deficit means that the services surplus is not sufficient to offset it entirely.
Revisions and Data Integrity
The U.S. Census Bureau and the Bureau of Economic Analysis also noted revisions to previous data. The seasonally adjusted goods data for January through November were updated to ensure that the monthly totals align with annual figures. These revisions underscore the ongoing process of refining economic data to ensure accuracy and consistency.
Outlook and Future Considerations
The report indicated that the next release of the U.S. International Trade in Goods and Services report is to be determined, a delay attributed to a recent lapse in federal funding. This notice highlights the vulnerability of critical economic data collection and dissemination to government operations.
Furthermore, an upcoming change to the "Euro Area" grouping in trade statistics, effective with the January 2026 release, will include Bulgaria following its adoption of the euro. This adjustment, while technical, is important for consistent and accurate regional trade analysis.
The data released today provides a crucial, albeit concerning, update on the U.S. trade position. The significant widening of the deficit in December, coupled with the persistent imbalance in goods trade throughout 2025, suggests that policymakers and businesses will need to carefully monitor international trade dynamics. The interplay of global demand, currency valuations, supply chain resilience, and domestic economic policies will continue to shape the U.S. trade landscape in the months and years ahead. The ability of the U.S. to manage its trade deficit will be a key factor in its broader economic health and international competitiveness.