Lana Rhoades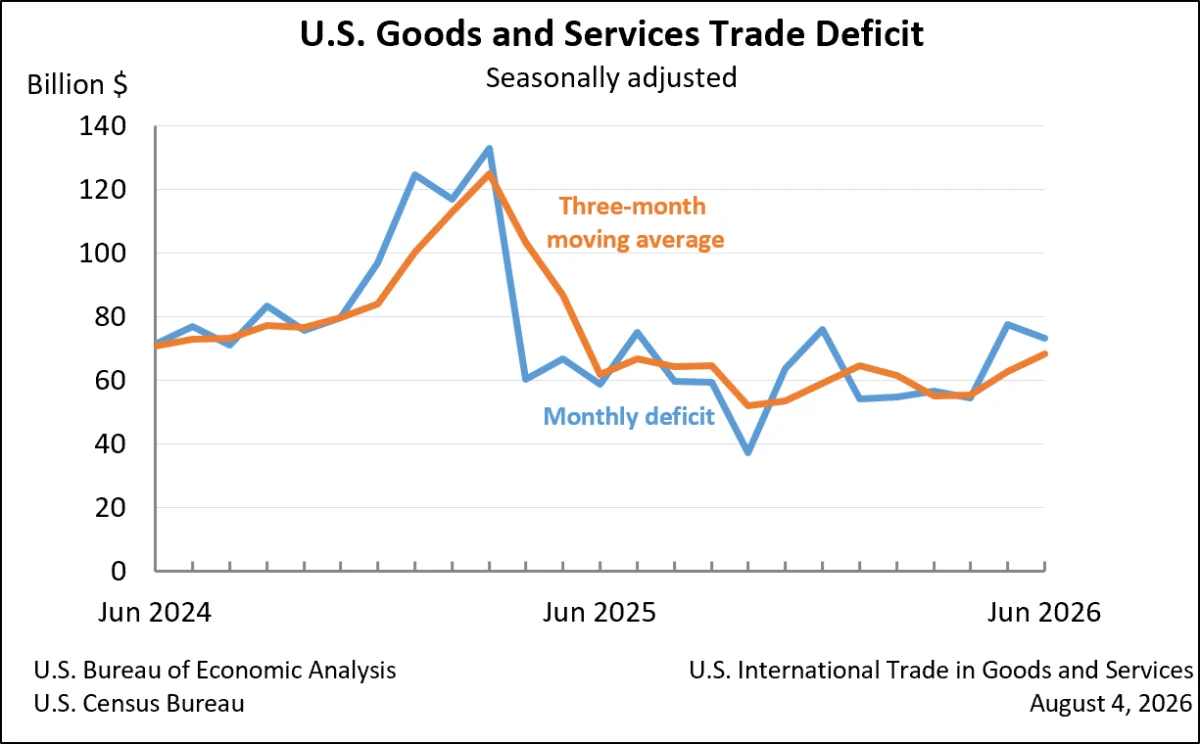
The United States experienced a notable contraction in its goods and services deficit in June, with the gap narrowing to $73.3 billion. This represents a significant decrease of $4.4 billion from the revised $77.6 billion deficit recorded in May, according to the latest joint report released today by the U.S. Census Bureau and the U.S. Bureau of Economic Analysis. This downward trend in the deficit, driven by a simultaneous dip in both exports and imports, suggests a recalibration of global trade flows and potentially points to evolving consumer and business demand patterns within the U.S. economy.
The June figures reveal a trade landscape where exports totaled $314.7 billion, a decline of $2.9 billion from the previous month, while imports also saw a reduction, falling by $7.3 billion to $388.0 billion. This synchronized decrease in both outward and inward trade, while contributing to a smaller deficit, also indicates a potential cooling in overall trade activity during the month.
Detailed Breakdown of June Trade Performance
The overall reduction in the goods and services deficit was a composite of two key movements: a decrease in the goods deficit and an increase in the services surplus. The goods deficit, which represents the imbalance between exported and imported physical products, shrank by $3.9 billion to $102.1 billion. Concurrently, the services surplus, reflecting the excess of services exported over imported, grew by $0.5 billion to $28.8 billion. This dual effect underscores a nuanced picture of U.S. international trade, with goods trade experiencing a more pronounced contraction than the services sector.
Year-to-Date Trends: A Wider Perspective
Looking at the broader economic picture, the year-to-date figures offer a more substantial narrative. For the period from January through June, the cumulative goods and services deficit has decreased by an impressive $189.3 billion, marking a 33.8 percent reduction compared to the same period in 2025. This significant improvement is attributed to a substantial surge in exports, which climbed by $198.3 billion, or 11.7 percent, year-over-year. In contrast, imports saw a much more modest increase of $9.0 billion, or 0.4 percent, over the same timeframe. This divergence between export growth and import stagnation suggests a potentially stronger demand for U.S. products abroad or a more restrained U.S. appetite for foreign goods and services.
Analysis of the June Trade Data
The June report presents a complex interplay of factors influencing U.S. trade. The decrease in both exports and imports, while reducing the deficit, could be interpreted in several ways. It might reflect a global economic slowdown impacting demand for U.S. goods, or it could signal a U.S. consumer base that is becoming more price-sensitive or shifting spending priorities. The decline in the goods deficit is a positive sign for domestic manufacturing and producers, suggesting a potential improvement in the balance of trade for tangible products. However, the simultaneous decrease in exports warrants further investigation to understand the underlying causes, such as global geopolitical shifts, currency valuations, or changes in international demand.
Three-Month Moving Averages: Smoothing Out Volatility
To account for the inherent month-to-month volatility in trade data, the report also provides three-month moving averages. For the three months ending in June, the average goods and services deficit experienced an increase of $5.6 billion, reaching $68.5 billion. This contrasts with the monthly figures and suggests that while June saw a narrowing of the deficit, the broader trend over the preceding quarter indicates a widening gap. Year-over-year, the average goods and services deficit for the three months ending in June 2026 has increased by $6.6 billion compared to the same period in 2025. This suggests that, despite the positive monthly movement in June, the overall trade deficit trend over a slightly longer horizon may be less favorable.
Deeper Dive into Exports
Goods Exports Decline, Services Exports Show Resilience
In June, exports of goods saw a decrease of $4.0 billion, bringing the total to $206.9 billion. This decline was reflected in both goods on a Census basis, which fell by $3.8 billion, and net balance of payments adjustments, which decreased by $0.2 billion. This contraction in goods exports could be influenced by a variety of factors, including reduced demand from key trading partners, supply chain disruptions impacting U.S. production capacity, or shifts in global commodity prices.
Conversely, exports of services demonstrated resilience, increasing by $1.1 billion to reach $107.8 billion in June. This growth in services exports is a positive indicator for sectors such as technology, finance, tourism, and professional services, which are increasingly vital components of the U.S. economy. The continued strength in services exports suggests that U.S. service providers remain competitive on the global stage, even as goods trade faces headwinds.
Analysis of Export Trends: The disparity between the performance of goods and services exports in June highlights a potential bifurcation in the U.S. trade landscape. While demand for U.S. manufactured goods and commodities may be softening internationally, the demand for U.S. expertise and service offerings appears to be holding steady or even growing. This could signify a long-term structural shift in the global economy, with services playing an increasingly dominant role in international trade.
Imports Show Similar Contraction
Goods Imports Decline Sharply, Services Imports Edge Up
The trend of declining trade activity extended to imports as well. Imports of goods saw a significant decrease of $7.9 billion, totaling $309.0 billion in June. Similar to exports, this decline was observed in goods on a Census basis, which fell by $7.7 billion, with net balance of payments adjustments accounting for a further $0.2 billion reduction. The sharp drop in goods imports could be attributed to several factors, including a slowdown in U.S. consumer spending on imported goods, businesses reducing their inventories of foreign-made products, or a strengthening dollar making imports more expensive for U.S. buyers.
Imports of services, however, experienced a modest increase of $0.6 billion, reaching $79.0 billion in June. While this indicates a slight uptick in the cost or volume of imported services, it remains a much smaller movement compared to the decline in goods imports.
Analysis of Import Trends: The substantial decrease in goods imports is a key driver behind the narrowing of the overall deficit. This reduction could signal a recalibration of U.S. supply chains, a greater reliance on domestic production, or a response to inflationary pressures that make imported goods less attractive. The modest increase in services imports, while not a significant factor in the overall deficit reduction, suggests that U.S. demand for foreign services, such as business consulting or software licenses, remains relatively stable.
Real Goods Deficit: Adjusting for Inflation
Real Goods Deficit Shrinks More Than Nominal Deficit
When adjusting for price changes, the real goods deficit (measured in 2017 dollars) saw a more substantial contraction than its nominal counterpart. The real goods deficit decreased by $5.3 billion, or 5.3 percent, in June. This is a more pronounced decline than the 3.7 percent decrease observed in the nominal goods deficit. This suggests that a portion of the reduction in the nominal goods deficit was due to falling prices of imported goods, rather than solely a reduction in the volume of trade. This inflationary adjustment provides a clearer picture of the underlying shifts in the physical flow of goods.
Revisions to Previous Month’s Data
The report also includes revisions to the May trade figures, though specific details of these revisions were not elaborated upon in the provided summary. These adjustments are a standard part of economic data releases and reflect the incorporation of new or updated information. Such revisions are crucial for providing the most accurate assessment of trade performance and can sometimes alter the perception of month-over-month trends.
Trade Balances with Key Trading Partners
The monthly data also sheds light on U.S. trade relationships with individual countries and regions. In June, the U.S. recorded trade surpluses (exports exceeding imports) with a number of key partners, including the Netherlands ($7.2 billion), South and Central America ($5.6 billion), Hong Kong ($3.2 billion), Switzerland ($2.9 billion), the United Kingdom ($2.2 billion), Singapore ($1.8 billion), Saudi Arabia ($1.8 billion), Brazil ($1.7 billion), Australia ($1.3 billion), and Belgium ($0.9 billion).
Conversely, the U.S. experienced trade deficits with several significant trading nations. The largest deficits were recorded with Vietnam ($21.6 billion), Mexico ($20.3 billion), China ($15.3 billion), and Taiwan ($14.9 billion). Other notable deficits were observed with the European Union ($10.9 billion), South Korea ($7.4 billion), Canada ($7.2 billion), Germany ($7.1 billion), India ($4.5 billion), Malaysia ($4.4 billion), Japan ($3.3 billion), Ireland ($2.7 billion), Italy ($2.5 billion), France ($1.5 billion), and Israel ($1.2 billion).
Implications and Future Outlook
The narrowing of the U.S. goods and services deficit in June, while a positive development in the short term, is part of a larger, more complex economic picture. The synchronized decline in both exports and imports suggests a potential slowdown in global economic activity and domestic demand. The year-to-date trend of a significantly reduced deficit, driven by strong export growth, offers a more optimistic outlook for U.S. trade performance. However, the recent increase in the three-month moving average deficit indicates that the improvement may not be as robust or sustained as the single-month figures suggest.
Economists will be closely monitoring future reports to ascertain whether the June trends represent a temporary fluctuation or the beginning of a more sustained shift in U.S. trade dynamics. Factors such as global inflation, geopolitical stability, and the monetary policies of major economies will continue to play a crucial role in shaping the future trajectory of the U.S. trade balance. The continued resilience of U.S. services exports offers a bright spot, highlighting the growing importance of the knowledge-based economy in international commerce.
The next release of U.S. International Trade in Goods and Services data, covering July 2026, is scheduled for September 3, 2026, providing further insights into these evolving economic trends.