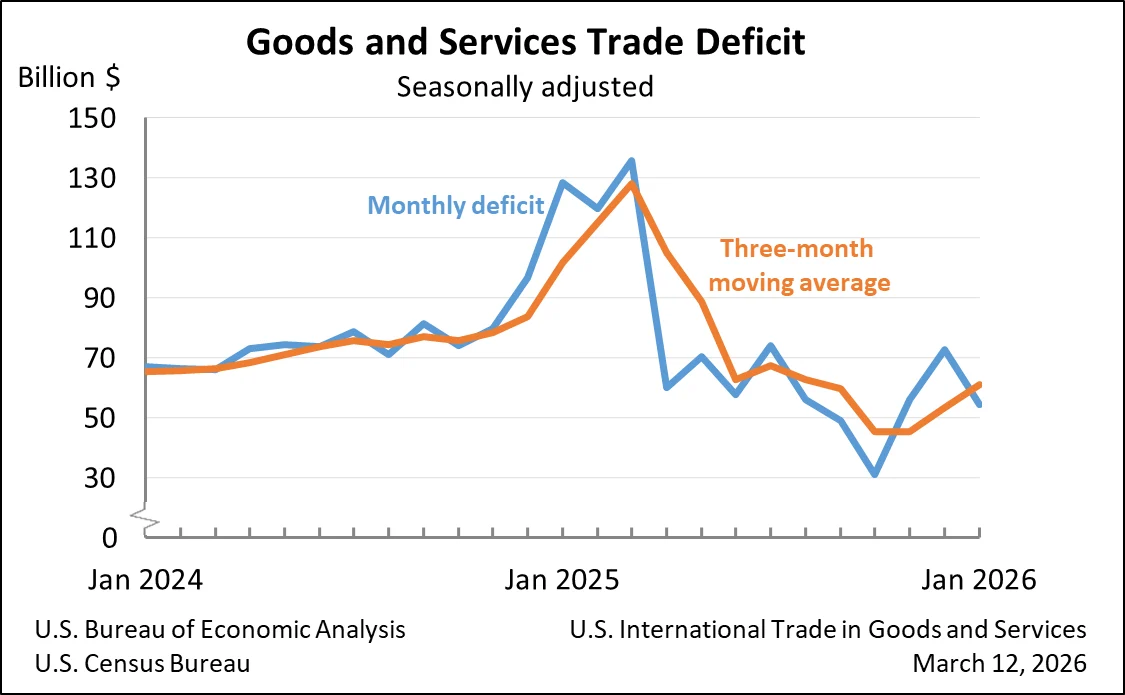
The United States experienced a notable contraction in its trade deficit for goods and services in January, a positive development that signals shifting dynamics in international commerce. According to a joint announcement by the U.S. Census Bureau and the U.S. Bureau of Economic Analysis, the deficit for the month stood at $54.5 billion, marking a substantial decrease of $18.4 billion from the revised $72.9 billion deficit recorded in December. This represents a 25.3% reduction in the trade imbalance month-over-month, a significant swing that warrants closer examination of the underlying trade flows.
Key Figures and Monthly Performance
The January data reveals a robust performance in U.S. exports, which surged by 5.5% to reach $302.1 billion. This increase of $15.8 billion compared to December’s figures indicates a strengthening demand for American goods and services on the global stage. Conversely, imports saw a slight dip of 0.7%, totaling $356.6 billion, a decrease of $2.6 billion from the previous month. This combination of rising exports and declining imports is a primary driver behind the shrinking trade deficit.
Breaking down the overall deficit, the goods deficit alone narrowed by $17.5 billion to $81.8 billion. Simultaneously, the services surplus, a consistent area of strength for the U.S. economy, expanded by $1.0 billion to $27.3 billion. This dual movement—a reduced goods deficit and an enlarged services surplus—contributed to the overall improvement in the trade balance.
Year-Over-Year Trends and Context
The January figures also paint a compelling picture when viewed against the backdrop of the previous year. On a year-over-year basis, the goods and services deficit has decreased by an impressive $73.9 billion, or 57.6%, from January 2025. This substantial improvement reflects a more sustained positive trend. Exports have seen a healthy increase of $28.4 billion, or 10.4%, while imports have contracted by $45.5 billion, or 11.3%. These year-over-year statistics suggest that the recent improvement in the trade balance is not merely a short-term fluctuation but may indicate more enduring shifts in trade patterns.
Examining the Components of Trade
Exports: The $15.8 billion increase in total exports from December to January was largely driven by a $14.6 billion rise in exports of goods, bringing the total to $195.5 billion. This growth reflects a broad-based strengthening across various export categories. On a Census basis, which provides a more granular view of goods traded, exports saw an increase of $14.8 billion, with net balance of payments adjustments contributing a minor decrease of $0.1 billion. In parallel, exports of services also demonstrated resilience, climbing by $1.2 billion to $106.7 billion in January. This indicates a sustained global appetite for American expertise and services, ranging from financial and professional services to tourism and intellectual property.
Imports: The slight contraction in overall imports was primarily due to a decrease in goods imports. Imports of goods fell by $2.8 billion to $277.3 billion in January. On a Census basis, this decline was slightly larger at $3.0 billion, with net balance of payments adjustments showing a small increase of $0.1 billion. Meanwhile, imports of services experienced a marginal increase of $0.2 billion, reaching $79.3 billion in January. While the overall trend in goods imports is downward, the slight uptick in services imports suggests continued foreign demand for American markets and consumer offerings.
Real Goods Trade and Inflationary Impact
The report also provides insights into the trade of real goods, adjusted for price changes, using 2017 dollars. The real goods deficit narrowed by $14.0 billion, or 14.3%, to $83.9 billion in January. This decrease in real terms is slightly less pronounced than the 18.0% decrease observed in the nominal deficit, suggesting that while trade volumes improved, some price effects may have moderated the overall reduction. This distinction is important for understanding the true extent of the improvement in trade dynamics, separating volume changes from value changes influenced by inflation or currency fluctuations.
Revisions and Data Integrity
The Census Bureau and the Bureau of Economic Analysis also announced revisions to trade data for July through December 2025. These revisions are a routine part of the statistical process, incorporating more comprehensive and up-to-date quarterly and monthly data. Furthermore, seasonally adjusted data for all of 2025 has been revised to ensure that the monthly totals align with the annual totals. Such revisions are critical for maintaining the accuracy and reliability of economic indicators, providing policymakers and the public with the most precise picture of economic activity.
Trade Balances with Key Partners
The monthly data on trade in goods by selected countries and areas offers a snapshot of bilateral trade relationships. In January, the U.S. recorded trade surpluses with several key partners, including the United Kingdom ($7.0 billion), the Netherlands ($6.4 billion), South and Central America ($4.5 billion), Switzerland ($3.0 billion), Hong Kong ($3.0 billion), Saudi Arabia ($2.2 billion), Brazil ($1.8 billion), Singapore ($1.7 billion), Australia ($1.7 billion), and Belgium ($0.9 billion). These surpluses indicate that U.S. exports to these regions exceeded imports from them.
Conversely, significant deficits were observed with other trading partners. The largest deficits were with Vietnam ($19.0 billion), Taiwan ($17.3 billion), Mexico ($12.8 billion), and China ($12.5 billion). Other notable deficits include those with the European Union ($6.1 billion), South Korea ($6.0 billion), Japan ($5.5 billion), and Germany ($4.9 billion). These figures highlight areas where the U.S. imports substantially more than it exports, contributing to the overall trade imbalance.
Quarterly data, which provides a broader view of trade in goods and services by country and area on a balance of payments basis, revealed additional insights. For the fourth quarter of 2025, surpluses were recorded with Switzerland ($24.1 billion), the Netherlands ($21.0 billion), South and Central America ($19.6 billion), and the United Kingdom ($15.9 billion). However, substantial deficits persisted with Taiwan ($50.7 billion), Mexico ($49.5 billion), Vietnam ($47.7 billion), and China ($31.7 billion).
Moving Averages and Short-Term Trends
The report also includes a section on three-month moving averages, which helps to smooth out monthly volatility and identify underlying trends. The average goods and services deficit increased by $7.8 billion to $61.1 billion for the three months ending in January. This increase in the moving average, despite the significant monthly improvement, suggests that the January decline might be part of a more complex adjustment rather than a definitive reversal of the recent upward trend in the average deficit. However, year-over-year, the average goods and services deficit has decreased by $40.6 billion compared to the three months ending in January 2025, reinforcing the notion of a broader improvement over the longer term.
Implications and Future Outlook
The significant reduction in the U.S. trade deficit in January is a positive economic signal. A smaller deficit can contribute to a stronger domestic economy by reducing the outflow of capital and potentially supporting domestic employment and production. The robust growth in exports suggests that U.S. businesses are increasingly competitive in international markets, a trend that could be further bolstered by favorable trade policies and a stable global economic environment.
The decrease in imports, while potentially reflecting a softening of domestic demand in some sectors, also indicates a shift in consumption patterns or a move towards domestically produced goods. The persistent deficits with certain Asian economies, notably China and Taiwan, continue to be a focus for trade policymakers, highlighting ongoing challenges in rebalancing trade relationships.
The upcoming releases of trade data and scheduled revisions will be closely watched for confirmation of these trends. The announcement of a change to the Euro Area grouping to include Bulgaria, effective January 1, 2026, is a technical adjustment that will refine future reporting of trade statistics with that region.
The U.S. Census Bureau and the U.S. Bureau of Economic Analysis will release the next report on U.S. International Trade in Goods and Services for February 2026 on April 2, 2026. This subsequent report will provide further clarity on whether the positive momentum observed in January is sustained. Economic analysts and policymakers will be keenly observing these figures to gauge the ongoing health of U.S. international trade and its implications for the broader economy. The detailed data available through the Census Bureau and BEA websites offers a comprehensive resource for understanding the intricacies of U.S. global commerce.