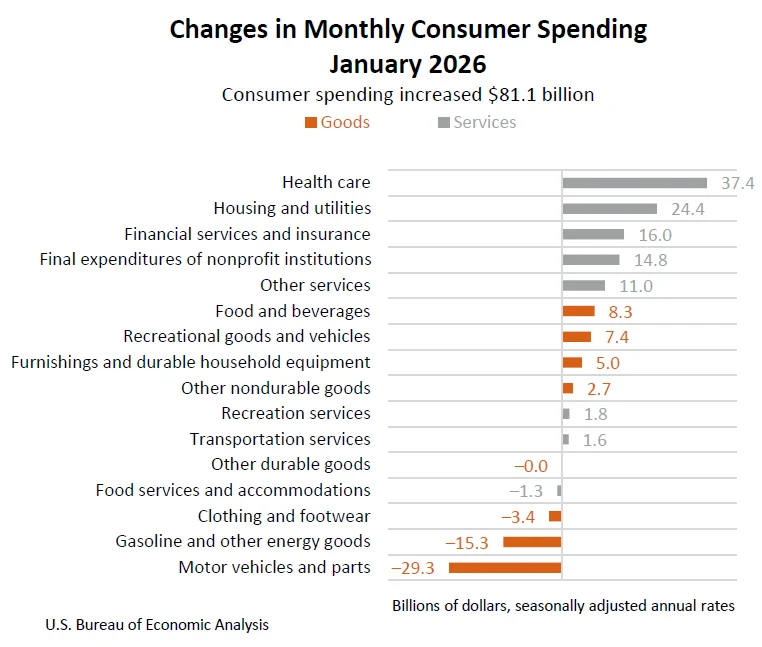
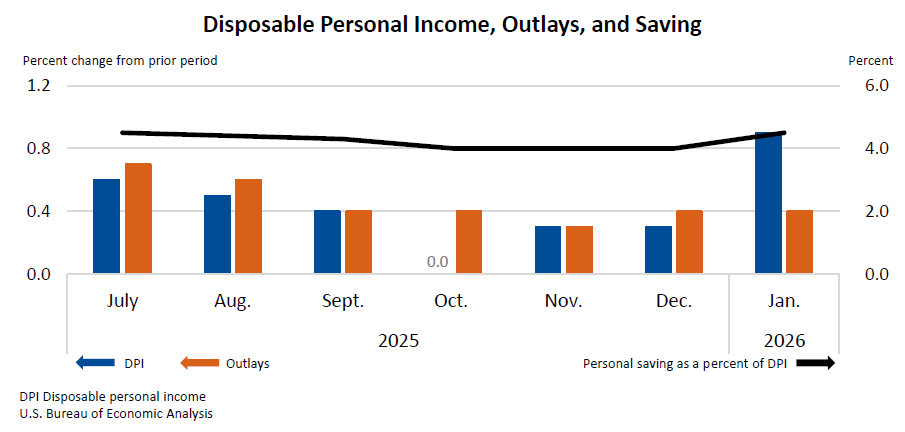
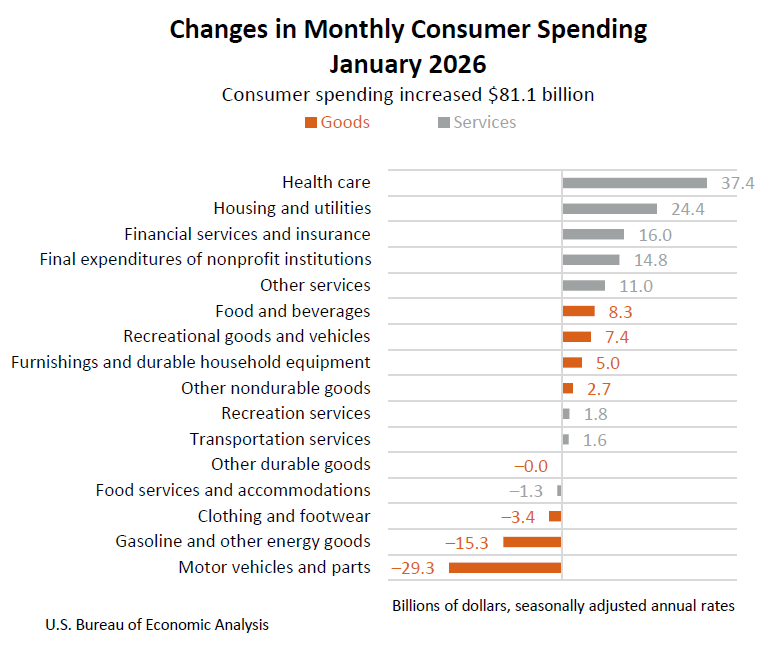
Personal income in the United States experienced a notable increase of $113.8 billion, or 0.4 percent at a monthly rate, in January. This figure, released by the U.S. Bureau of Economic Analysis (BEA), reflects a healthy uptick in the nation’s earnings capacity. Simultaneously, disposable personal income (DPI), which represents income after taxes, surged by a more substantial $219.9 billion, or 0.9 percent. This divergence between overall personal income and disposable income suggests a significant reduction in personal current taxes during the month, providing consumers with more spendable funds. Personal consumption expenditures (PCE), a key indicator of consumer spending, also saw a rise, increasing by $81.1 billion, or 0.4 percent. This indicates that a considerable portion of the increased disposable income was channeled back into the economy through consumer purchases.
The release of these critical economic figures for January 2026 was originally slated for February 26, 2026. However, the data compilation and dissemination were subject to a delay, rescheduled due to the prolonged October-November 2025 government shutdown. This shutdown, a period of federal government operational disruption caused by a failure to pass appropriations legislation, had a ripple effect across various government agencies, including the BEA, impacting the timely release of economic data. The interruption in data collection and analysis during the shutdown period necessitated a revised timeline for the January report, underscoring the sensitive interdependencies within government functions and their impact on economic transparency.
Further analysis of the January report reveals that personal outlays, which encompass personal consumption expenditures, personal interest payments, and personal current transfer payments, expanded by $85.8 billion. This growth in outlays, while positive, was outpaced by the increase in disposable personal income, leading to an accumulation of personal savings. In January, personal saving amounted to $1.05 trillion, with the personal saving rate standing at 4.5 percent of disposable personal income. This saving rate, while not at historic highs, indicates a continued inclination among consumers to set aside a portion of their income, potentially reflecting a cautious outlook or a desire to build financial buffers amidst evolving economic conditions.
The primary drivers behind the current-dollar personal income increase in January were robust gains in compensation, personal dividend income, and personal current transfer receipts. Compensation, which includes wages, salaries, and benefits, often serves as the most significant component of personal income, and its growth signals a strengthening labor market or wage increases. The rise in personal dividend income suggests that corporate profits may have been favorable, leading to higher payouts to shareholders. Personal current transfer receipts, which include government social benefits like Social Security and unemployment insurance, also contributed to the overall income growth, indicating continued support from social safety net programs.
Consumer spending, as measured by personal consumption expenditures (PCE), demonstrated a balanced performance across different categories. The $81.1 billion increase in current-dollar PCE was largely propelled by a substantial $105.7 billion surge in spending on services. This significant uplift in service sector expenditures is often indicative of increased consumer confidence and a willingness to engage in activities such as travel, entertainment, and dining out. However, this growth was partially tempered by a decrease of $24.6 billion in spending on goods. This dip in goods spending could be attributed to various factors, including shifts in consumer preferences away from durable goods, inventory adjustments by retailers, or a maturation of demand following earlier surges in goods purchases.
The real PCE, which adjusts for inflation, saw a more modest increase of $17.0 billion, or 0.1 percent at a monthly rate. This real spending growth is a more accurate reflection of the actual volume of goods and services consumed by individuals, free from the distorting effects of price changes. The difference between the nominal PCE increase and the real PCE increase highlights the impact of inflation on consumer purchasing power.
Inflationary pressures, as measured by the Personal Consumption Expenditures (PCE) price index, also showed movement in January. The overall PCE price index rose by 0.3 percent from the preceding month. When volatile food and energy prices are excluded, the core PCE price index, often a closely watched indicator by central bankers, increased by 0.4 percent. These figures suggest that while inflation is present, its pace may be moderating in some areas, although core inflation remains a point of attention for policymakers concerned about underlying price pressures.
On a year-over-year basis, the PCE price index for January increased by 2.8 percent. The core PCE price index, excluding food and energy, saw a more pronounced rise of 3.1 percent compared to the same month in the previous year. These annual figures provide a broader perspective on the inflationary environment, indicating that while monthly price increases might be fluctuating, the cumulative effect of inflation over the past year remains a significant factor for consumers and the broader economy. The persistent rise in core inflation, in particular, can signal underlying demand-side pressures or supply chain issues that are contributing to sustained price increases.
The BEA’s commitment to modernizing its data dissemination practices was also highlighted in this release. The agency has been streamlining its news release packages, with improvements including direct links to its online Interactive Data Tables. This move signifies a shift away from providing traditional PDF and Excel tables, aiming to reduce duplication, enhance efficiency, and provide users with more direct access to the most up-to-date and comprehensive data. This initiative is part of a broader effort to make economic data more accessible and user-friendly for researchers, policymakers, and the public.
Background on the Government Shutdown’s Impact on Economic Data
The government shutdown that preceded the January 2026 economic data release was a significant event with tangible consequences for the timely dissemination of crucial economic indicators. Spanning from October through November 2025, the shutdown resulted from a partisan impasse in Congress over federal spending priorities. This hiatus in government operations led to the furlough of thousands of federal employees and the suspension of non-essential government services. For statistical agencies like the BEA, the shutdown meant a halt in data collection, analysis, and publication.
Economic data, such as personal income and consumption, are compiled through ongoing surveys and administrative data sources. When these data collection processes are interrupted, it creates backlogs and necessitates adjustments to release schedules. The BEA, in its notification regarding the January report, explicitly cited the October-November 2025 government shutdown as the reason for the rescheduling. This underscores the vulnerability of economic reporting to political disruptions and the importance of sustained government funding for maintaining economic transparency. The delay, while ultimately overcome, serves as a reminder of the intricate mechanisms that underpin the production of vital economic statistics.
Analysis of Key Economic Indicators
The January personal income report paints a picture of a resilient U.S. economy, albeit one facing ongoing inflationary pressures. The 0.4 percent rise in personal income, driven by compensation and dividends, suggests continued strength in the labor market and corporate profitability. This is a positive sign for consumer spending power. The even more substantial increase in disposable personal income, coupled with a reduction in personal taxes, provided households with a significant boost in their ability to spend.
The 0.9 percent jump in disposable personal income is particularly noteworthy. This could be a result of several factors, including tax refunds being issued earlier than usual, legislative changes affecting tax liabilities, or adjustments in withholding. Regardless of the specific cause, this surge in spendable income is a potent stimulus for economic activity.
Consumer spending, as measured by PCE, increased by 0.4 percent. While this aligns with the nominal income growth, the fact that disposable income grew at a faster pace suggests that consumers are not spending every extra dollar they earn. The personal saving rate of 4.5 percent indicates a degree of financial prudence. This could be a strategic decision by households to save for future uncertainties, invest, or pay down debt. A healthy saving rate can contribute to economic stability by providing a buffer against unexpected shocks and funding for future investment.
The breakdown of PCE into services and goods offers further insight. The robust growth in services spending is a strong indicator of consumer confidence and a return to pre-pandemic spending patterns for many. This sector, which includes experiences like travel, dining, and entertainment, often benefits from increased disposable income and a sense of economic security. The slight contraction in goods spending, however, warrants attention. It could signal a recalibration of consumer demand after a period of elevated goods purchases during earlier phases of the pandemic, or it might reflect the impact of higher prices on the affordability of certain goods.
The PCE price index figures are critical for understanding the real purchasing power of the income and spending increases. The 0.3 percent monthly rise in the overall PCE price index, and 0.4 percent in the core PCE, suggests that inflation is still a present concern, even if the pace of monthly increases might be moderating. The year-over-year figures of 2.8 percent for the overall index and 3.1 percent for the core index confirm that inflationary pressures have been persistent over the past year. For consumers, this means that while their nominal incomes are rising, the cost of goods and services is also increasing, potentially eroding some of the gains in real purchasing power. The BEA’s inclusion of these inflation metrics is crucial for providing a comprehensive view of the economic landscape.
Revisions and Data Integrity
The BEA’s release also included important technical notes regarding revisions to previously published data. Estimates for July through December 2025 have been updated to incorporate more current information. Specifically, the compensation, personal taxes, and contributions for government social insurance for July through September reflect the incorporation of third-quarter wage and salary data from the Bureau of Labor Statistics (BLS) Quarterly Census of Employment and Wages (QCEW) program. For October through December, the updates are based on revised BLS Current Employment Statistics (CES) data. These revisions are a standard part of the BEA’s statistical process, ensuring that the published figures are as accurate and up-to-date as possible, reflecting the dynamic nature of the U.S. economy. The inclusion of these revisions highlights the iterative nature of economic data compilation and the BEA’s commitment to statistical accuracy.
Broader Economic Implications and Outlook
The January personal income and spending data provide a snapshot of an economy that is exhibiting continued growth, supported by rising incomes and consumer spending, particularly in the services sector. However, the persistent inflation, as indicated by the PCE price index, remains a key challenge. The interplay between income growth, consumer spending, and inflation will be closely monitored by economists and policymakers.
For the Federal Reserve, the data will offer further context as they calibrate monetary policy. While the income and spending figures suggest economic resilience, the elevated core inflation may warrant continued vigilance in their efforts to manage price stability. The Federal Reserve’s dual mandate of maximizing employment and maintaining price stability means they must balance the need to support economic growth with the imperative to control inflation.
The impact of the previous government shutdown on data dissemination also raises broader questions about the operational resilience of government institutions and their capacity to provide essential public services, including timely economic information. The delay, though resolved, serves as a cautionary tale about the potential consequences of political instability on economic transparency and decision-making.
Looking ahead, the trajectory of personal income and consumer spending will be influenced by a multitude of factors, including the evolution of inflation, the Federal Reserve’s monetary policy decisions, global economic conditions, and any potential new legislative or geopolitical developments. The BEA’s next release, scheduled for April 9, 2026, will provide an updated picture of February’s economic activity, offering further insights into these ongoing trends. The BEA’s transition to interactive data tables signifies a forward-looking approach to data delivery, aiming to serve the information needs of a diverse user base in an increasingly digital environment.