

Personal income in the United States saw a notable increase of $113.8 billion, or 0.4 percent at a monthly rate, in January, according to revised estimates released by the U.S. Bureau of Economic Analysis (BEA). This growth in overall income was accompanied by a more significant surge in disposable personal income (DPI), which climbed $219.9 billion, a robust 0.9 percent increase, indicating that households had more funds available after taxes. Personal consumption expenditures (PCE), a key indicator of consumer spending, also expanded by $81.1 billion, or 0.4 percent, reflecting continued economic activity.
This latest report, originally slated for release on February 26, 2026, experienced a delay, being rescheduled to its current publication date due to the prolonged October-November 2025 government shutdown. The shutdown had a ripple effect across federal agencies, impacting data collection and dissemination processes for various economic indicators, including those managed by the BEA. The rescheduling underscores the sensitivity of economic reporting to disruptions in government operations and highlights the critical role of federal agencies in providing timely and accurate economic data.
The increase in current-dollar personal income during January was primarily fueled by gains in compensation, personal dividend income, and personal current transfer receipts. Compensation, which includes wages and salaries, benefits, and other forms of payment for labor, is a fundamental driver of household income. The rise in dividend income suggests a positive performance in equity markets, benefiting shareholders. Furthermore, an increase in personal current transfer receipts, which encompass payments like government social benefits and other transfers to individuals, provided an additional boost to income.
Disposable Personal Income (DPI), a critical measure of the income available for spending and saving, demonstrated a particularly strong performance. The 0.9 percent increase in DPI outpaced the overall personal income growth, suggesting that personal current taxes either declined or grew at a slower rate than income. This widening gap between personal income and taxes effectively put more money into the hands of consumers.
Consumer Spending Shows Resilience
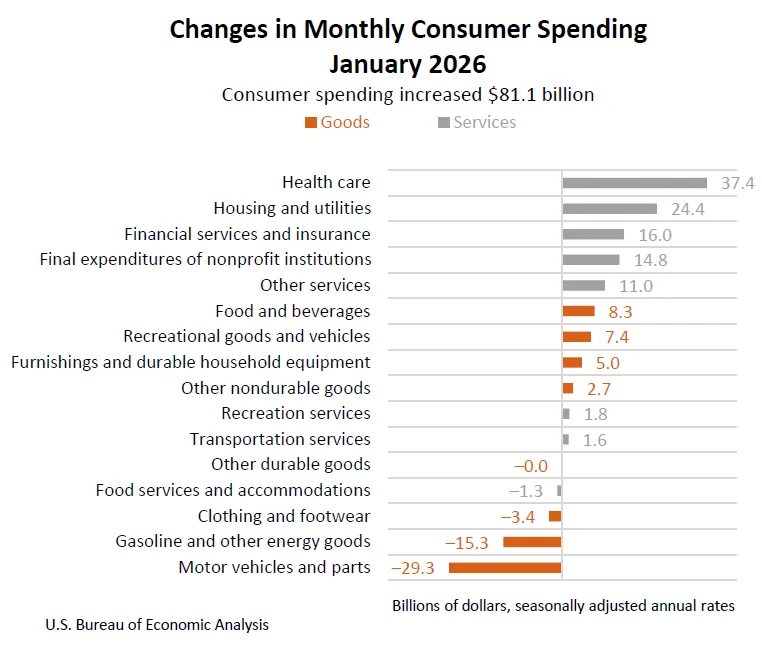
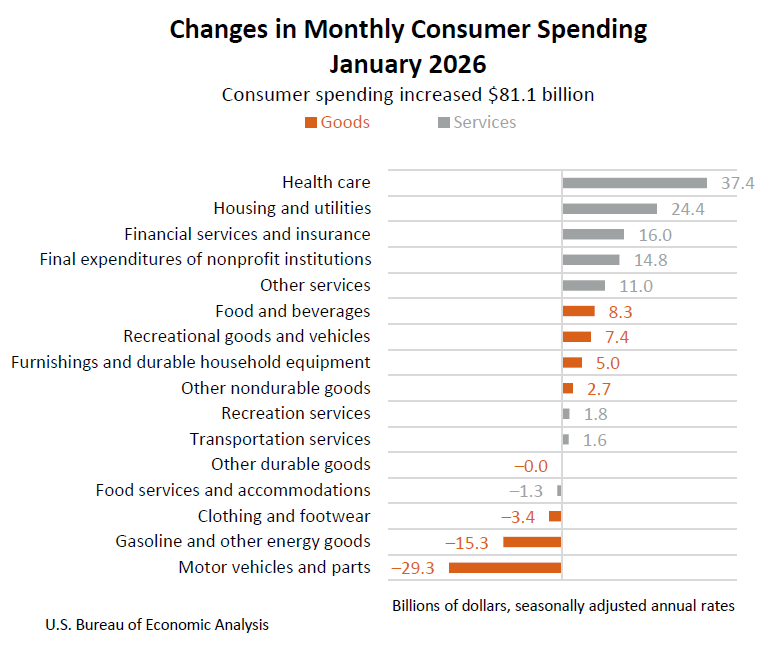
Personal consumption expenditures (PCE), a broad measure of consumer spending on goods and services, rose by $81.1 billion, or 0.4 percent, in January. This consistent growth in spending indicates that despite potential economic uncertainties, consumers continued to allocate their resources towards goods and services. The composition of this spending revealed a notable shift, with an increase of $105.7 billion in spending on services being partially offset by a decrease of $24.6 billion in spending on goods. This pattern suggests a continued preference for services, which can include expenditures on travel, entertainment, healthcare, and other non-tangible items, over physical goods.
Real PCE, which adjusts for inflation, also saw a modest increase of $17.0 billion, or 0.1 percent, in January. While the nominal increase in PCE was 0.4 percent, the smaller real increase indicates that inflation played a role in the overall rise in spending.
Inflationary Pressures and the PCE Price Index
The Personal Consumption Expenditures (PCE) price index, a key inflation gauge closely monitored by the Federal Reserve, registered an increase of 0.3 percent from the previous month in January. This indicates a moderate uptick in the general price level of goods and services consumed by individuals. When excluding the volatile categories of food and energy, the core PCE price index, which provides a clearer view of underlying inflation trends, increased by 0.4 percent in January. This suggests that inflationary pressures were present across a broader range of goods and services.
On a year-over-year basis, the PCE price index for January rose by 2.8 percent compared to the same month in the previous year. The core PCE price index, excluding food and energy, showed a more significant increase of 3.1 percent from one year ago. These figures provide context for the ongoing inflation environment, indicating that while monthly price increases may be moderate, the cumulative impact of inflation over the past year remains a significant economic factor. The Federal Reserve’s monetary policy decisions are heavily influenced by these inflation trends, with a persistent rise in core inflation potentially leading to considerations for interest rate adjustments.
Personal Saving Rate Holds Steady
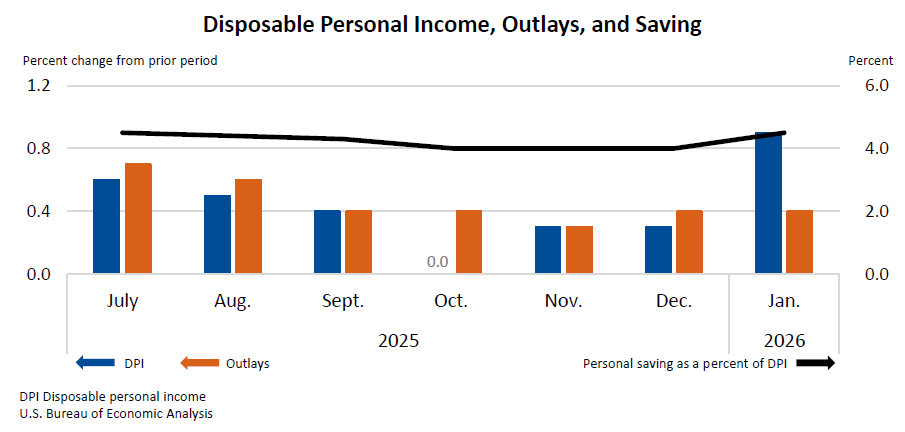
Personal outlays, which encompass PCE, personal interest payments, and personal current transfer payments, increased by $85.8 billion in January. This figure represents the total amount spent and paid out by individuals. Following these expenditures, personal saving was estimated at $1.05 trillion in January. The personal saving rate, calculated as personal saving as a percentage of disposable personal income, stood at 4.5 percent. This rate indicates that households were saving nearly half of every dollar of disposable income. While this rate is not exceptionally high by historical standards, it suggests a degree of financial prudence and a capacity for future spending or investment. The interplay between DPI, PCE, and the saving rate provides a comprehensive picture of household financial behavior.
Impact of the Government Shutdown on Data Dissemination
The U.S. government shutdown that occurred from October to November 2025 had a tangible impact on the release schedule of this critical economic data. Federal agencies, including the Bureau of Economic Analysis, rely on consistent operational funding and staffing to collect, process, and disseminate economic statistics. During a shutdown, many non-essential government functions are halted, leading to delays in data releases. This particular delay in the January Personal Income and Outlays report highlights the vulnerability of economic data collection to political and budgetary impasses. Such disruptions can create uncertainty for businesses, policymakers, and investors who depend on timely economic information for decision-making. The BEA’s communication regarding the rescheduled release demonstrates an effort to maintain transparency and inform stakeholders about the circumstances affecting data availability.
Revisions to Previous Estimates
In addition to the January data, the BEA also incorporated revisions to personal income estimates for the period spanning July through December 2025. These revisions are a standard part of the BEA’s statistical process, aimed at incorporating more comprehensive and up-to-date data as it becomes available. Specifically, estimates for compensation, personal taxes, and contributions for government social insurance from July through September 2025 were updated to reflect the incorporation of third-quarter wage and salary data from the Bureau of Labor Statistics’ (BLS) Quarterly Census of Employment and Wages program. For the period of October through December 2025, the revisions incorporated updated data from the BLS’s Current Employment Statistics (CES) program. These ongoing revisions are crucial for ensuring the accuracy and reliability of the national income and product accounts.
Future Data Release and Modernization Efforts
The BEA has also announced upcoming changes to its news release format, signaling a move towards greater digital integration and efficiency. Beginning with the February 2026 estimate, scheduled for release on April 9, 2026, the BEA will cease providing news release tables in PDF and Excel formats. Instead, users will be directed to BEA’s online Interactive Data Tables for the most current and comprehensive data. This modernization effort aims to reduce duplication, enhance efficiency, and provide users with direct access to the most up-to-date statistical information. This transition reflects a broader trend in government data dissemination towards digital-first approaches.
The next release of Personal Income and Outlays data, covering February 2026, is scheduled for April 9, 2026, at 8:30 a.m. Eastern Daylight Time. This upcoming release will supersede the data presented in this report, and the links provided in this release will be updated to reflect the latest available information. Data from previous releases can be accessed through the BEA’s Data Archive.
Analysis and Implications
The January Personal Income and Outlays report paints a picture of a resilient U.S. economy at the beginning of 2026. The increase in personal income, particularly disposable personal income, suggests that households had greater financial capacity. The continued growth in personal consumption expenditures, despite the moderating real PCE growth due to inflation, indicates that consumer demand remained a significant engine of economic activity.
The rise in compensation and dividend income points to a healthy labor market and potentially positive corporate earnings. The increase in transfer receipts may reflect ongoing government support programs or an increase in social security benefits.
However, the persistent moderate inflation, as indicated by the PCE price index, remains a key concern for economic policymakers. The 0.3 percent monthly increase in the overall PCE price index and the 0.4 percent increase in the core PCE price index suggest that inflationary pressures, while not accelerating rapidly, are still present. The year-over-year figures of 2.8 percent for the overall index and 3.1 percent for the core index underscore the ongoing challenge of bringing inflation fully in line with target levels. This sustained inflation could continue to influence the Federal Reserve’s monetary policy stance.
The personal saving rate of 4.5 percent suggests that while consumers are spending, they are also maintaining a reasonable level of saving. This could provide a buffer against future economic downturns or support future consumption.
The background context of the government shutdown serves as a reminder of the potential for political instability to impact economic data collection and dissemination. The delay in this report underscores the importance of stable government operations for maintaining economic transparency and confidence.
In broader economic terms, the January data provides a snapshot of the U.S. economy at a time when it is navigating a complex environment of moderate growth, persistent inflation, and the lingering effects of past government disruptions. The BEA’s commitment to modernizing its data dissemination practices indicates a forward-looking approach to serving the needs of data users in an increasingly digital world. The ongoing monitoring of these economic indicators will be crucial for understanding the trajectory of the U.S. economy throughout 2026.


