Lana Rhoades
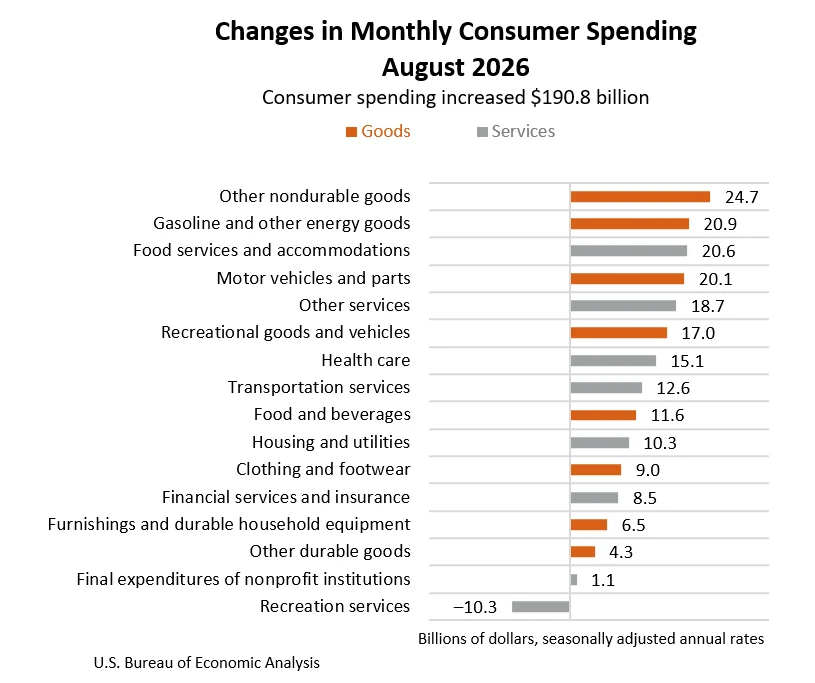
Personal income in the United States experienced a notable uptick in August, increasing by $66.6 billion, or 0.2 percent on a monthly basis, according to the latest estimates from the U.S. Bureau of Economic Analysis (BEA). This growth was primarily fueled by gains in compensation and government social benefits, signaling a steady, albeit measured, expansion of household finances. Concurrently, disposable personal income (DPI)—the amount of income left after taxes—rose by $68.6 billion, a 0.3 percent increase, suggesting that a larger portion of individuals’ earnings was available for spending or saving. This rise in disposable income coincided with a significant surge in personal consumption expenditures (PCE), which climbed by $190.8 billion, or 0.9 percent, indicating a robust acceleration in consumer spending during the month.
The interplay between income growth and consumer spending is a critical barometer of the U.S. economy’s health. The August data suggests that while personal income continued its upward trajectory, consumers significantly ramped up their spending, outstripping the pace of income growth. This dynamic has implications for inflation, economic output, and future monetary policy decisions.
August Economic Snapshot: Income, Spending, and Savings
The BEA’s comprehensive report detailed several key economic indicators for August. Personal outlays, which encompass PCE, personal interest payments, and personal current transfer payments, collectively rose by $190.7 billion. This broad measure of consumer spending highlights the significant commitment of household resources during the month. Despite the increased spending, personal saving remained substantial, totaling $990.2 billion. However, the personal saving rate—calculated as personal saving as a percentage of DPI—dipped to 4.1 percent. This decline in the saving rate suggests that a larger share of disposable income was channeled into consumption, a common characteristic of periods of economic expansion or when consumers feel confident about their financial prospects.
The composition of the income increase is also noteworthy. The primary drivers were boosts in compensation, which includes wages and salaries, and an increase in government social benefits. This suggests a multifaceted economic picture, with both labor market strength and government support contributing to the overall rise in household income. For businesses, the surge in consumer spending, particularly in PCE, points to sustained demand for both goods and services. This can translate into increased production, hiring, and investment, potentially creating a positive feedback loop for economic growth.
Deep Dive into Consumer Spending: Goods and Services Surge
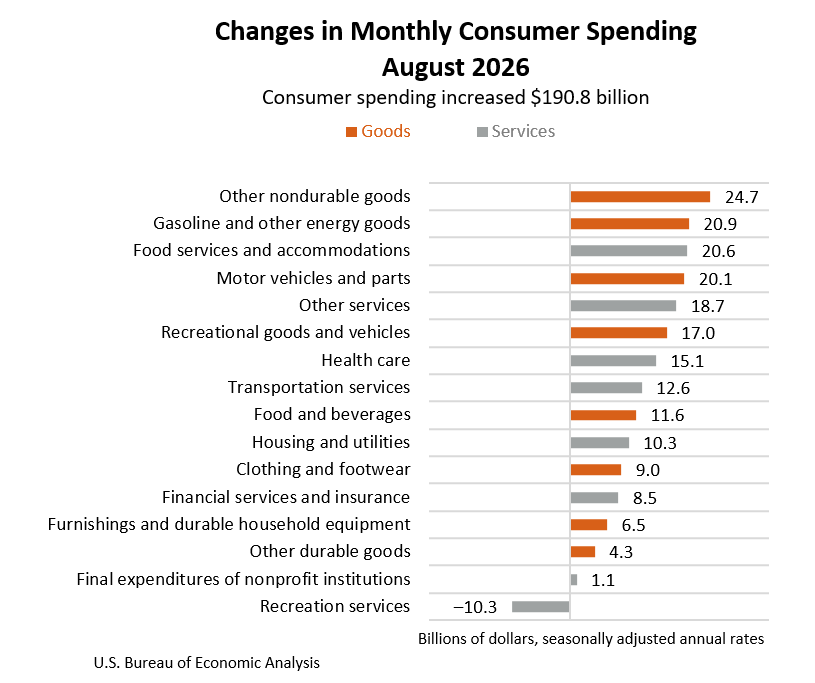
The $190.8 billion increase in current-dollar PCE was a significant driver of economic activity in August. This expansion was broadly distributed across both goods and services. Spending on goods saw a substantial increase of $114.1 billion, while spending on services rose by $76.7 billion. This dual growth indicates that consumers were actively purchasing a wide array of products and engaging in various service-related activities. The robust demand for goods could reflect a number of factors, including continued restocking by retailers, increased purchases of durable goods, or a seasonal uptick in specific categories. Simultaneously, the strong performance in services suggests a rebound or sustained activity in areas such as travel, entertainment, and personal care, which have been key indicators of consumer confidence and discretionary spending.
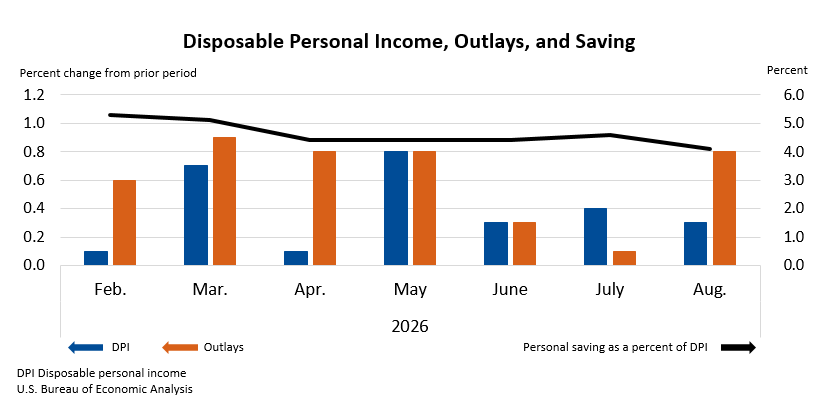
The BEA’s data also revealed that real PCE—which adjusts for inflation—increased by $92.8 billion, a 0.6 percent rise on a monthly basis. This indicates that the increase in consumer spending was not solely due to higher prices but also represented a genuine increase in the volume of goods and services consumed. The divergence between the nominal PCE increase (0.9%) and the real PCE increase (0.6%) underscores the role of inflation in the overall spending figures.
Inflationary Pressures and the PCE Price Index
The August report also provided crucial insights into inflationary trends through the Personal Consumption Expenditures (PCE) price index. The overall PCE price index increased by 0.3 percent from the previous month. More significantly, when excluding the volatile categories of food and energy, the core PCE price index—a key metric closely watched by the Federal Reserve for underlying inflation trends—rose by 0.2 percent. This suggests that inflationary pressures, while present, were somewhat contained within certain sectors.
On an annual basis, the PCE price index for August showed a 3.4 percent increase compared to the same month in the previous year. The core PCE price index, excluding food and energy, increased by 3.0 percent year-over-year. These figures provide a longer-term perspective on inflation. The annual inflation rate, particularly in the core measure, remains a critical consideration for monetary policy. While the monthly increases indicate a moderation or stabilization, the year-over-year figures highlight the cumulative impact of price changes on consumers and businesses. Central banks often aim for a specific inflation target, and the persistence of inflation above that target can lead to policy adjustments aimed at cooling the economy.
Revisions and Technical Considerations
The BEA’s report also included technical notes detailing revisions to previous data. Monthly estimates for compensation, including wages and salaries, for January through March 2026 were updated to incorporate first-quarter wage and salary data from the Bureau of Labor Statistics (BLS) Quarterly Census of Employment and Wages program. Furthermore, estimates for wages and salaries from April through July 2026 were adjusted based on revised monthly data from the BLS CES program. These revisions are a standard part of economic data reporting, ensuring accuracy and incorporating the latest available information. Additionally, revisions to Medicaid benefits were made to reflect updated information from the Centers for Medicare & Medicaid Services, underscoring the complex interplay of various government programs on personal income.
These revisions are crucial for maintaining the integrity of economic forecasting and analysis. By incorporating updated data, economists and policymakers can gain a more precise understanding of past economic performance, which in turn informs projections for future trends. The ongoing process of data refinement ensures that the BEA’s reports provide the most accurate picture of the U.S. economy.
Broader Economic Implications and Market Reactions
The August personal income and outlays report provides a nuanced view of the U.S. economy. The modest but steady growth in personal income, bolstered by compensation and government benefits, suggests a stable underlying economic foundation. The significant acceleration in consumer spending, however, points to a potentially more dynamic economic environment.
The increase in consumer spending, particularly in real terms, indicates sustained demand, which is generally positive for economic growth. However, the concurrent rise in the PCE price index, even if moderate on a monthly basis, raises questions about inflationary pressures. The Federal Reserve’s dual mandate of maximizing employment and maintaining price stability means that such data is closely scrutinized. If inflation persists or accelerates, it could prompt the Federal Reserve to consider further tightening of monetary policy, such as interest rate hikes, to curb demand and bring prices under control. Conversely, if the strong spending is seen as a sign of robust underlying economic health without significant inflationary fallout, it could support expectations of continued economic expansion.
The personal saving rate’s decline to 4.1 percent is also an area of interest. While a lower saving rate can stimulate economic activity in the short term, a sustained trend of low savings could raise concerns about households’ financial resilience in the face of unexpected economic shocks or a significant slowdown in income growth.
From a market perspective, the data would likely be analyzed for its implications on interest rates, corporate earnings, and overall investor sentiment. Strong consumer spending could be viewed positively by equity markets, suggesting healthy corporate revenues. However, any indication of rising inflation could lead to increased caution, as it might signal a more hawkish stance from the Federal Reserve.
Looking Ahead: September Data and Future Trends
The BEA announced that the next release of Personal Income and Outlays data, covering September 2026, is scheduled for October 29, 2026, at 8:30 a.m. EDT. This upcoming report will be critical for assessing whether the trends observed in August—particularly the acceleration in consumer spending and the behavior of inflation—are sustained or represent a temporary fluctuation.
Economic observers will be particularly keen to see if the momentum in consumer spending continues and how it aligns with broader inflationary indicators. The BEA’s ongoing revisions to historical data, as highlighted in the technical notes, will also provide a more refined understanding of the economic trajectory in the months leading up to and following August. The integration of BLS wage data and updated government benefit information ensures that the BEA’s reports remain a comprehensive and authoritative source for understanding the U.S. personal economy.
The data presented in the August report, while indicating positive developments in income and spending, also underscores the ongoing complexities of managing inflation and fostering sustainable economic growth. The continued monitoring of these key economic indicators will be essential for policymakers, businesses, and consumers alike as they navigate the evolving economic landscape. The BEA’s commitment to providing detailed and timely data, alongside transparent reporting of revisions and methodologies, remains a cornerstone of informed economic analysis.