

 Lana Rhoades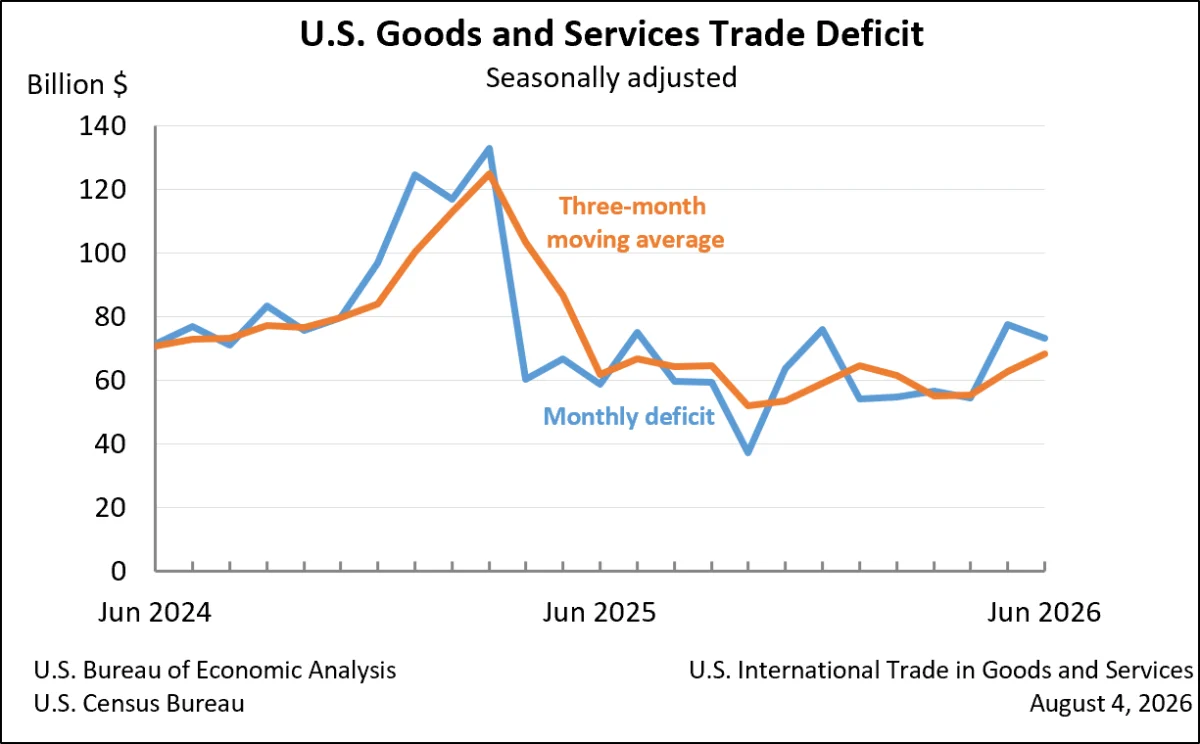
Washington D.C. – The United States experienced a narrowing of its goods and services deficit in June, with the gap between what the nation buys from and sells to the rest of the world contracting to $73.3 billion. This represents a $4.4 billion reduction from the revised May deficit of $77.6 billion, according to joint figures released today by the U.S. Census Bureau and the U.S. Bureau of Economic Analysis. While the deficit’s shrinkage is a positive signal for trade balance, the underlying data reveals a complex picture of reduced economic activity in both exports and imports.
The June figures indicate a 5.6% decrease in the overall deficit compared to the previous month. Total exports for June stood at $314.7 billion, marking a 0.9% decline from May. Simultaneously, imports also saw a decrease, falling by 1.8% to $388.0 billion. This simultaneous contraction in both trade flows contributed to the reduction in the deficit.
Analysis of the June Trade Figures
The decrease in the overall goods and services deficit was primarily driven by a substantial reduction in the deficit for goods, which fell by $3.9 billion to $102.1 billion. This was partially offset by a modest increase in the surplus for services, which grew by $0.5 billion to $28.8 billion.
Looking at the year-to-date performance, the goods and services deficit has seen a significant contraction, decreasing by $189.3 billion, or 33.8 percent, compared to the same period in 2025. This substantial year-over-year improvement is attributed to robust export growth, which increased by $198.3 billion, or 11.7 percent, while imports saw a more modest increase of $9.0 billion, or 0.4 percent. This suggests a stronger export performance in the earlier part of the year, which has helped to temper the overall trade imbalance.
Key Components of Trade Activity
Exports Decline Modestly in June
Total exports in June amounted to $314.7 billion, a decrease of $2.9 billion from May’s figures. This overall decline was a composite of mixed movements across goods and services.
- Goods Exports: Exports of goods experienced a more significant drop, decreasing by $4.0 billion to $206.9 billion in June. This figure breaks down into a $3.8 billion decrease in goods on a Census basis and a $0.2 billion decrease from net balance of payments adjustments.
- Services Exports: In contrast, exports of services demonstrated resilience, increasing by $1.1 billion to $107.8 billion in June. This growth in services exports could indicate continued demand for American services abroad, such as technology, finance, and tourism.
Imports Show a Broader Contraction
Imports for June totaled $388.0 billion, a decrease of $7.3 billion from May. This overall decline was predominantly influenced by a sharper fall in goods imports.
- Goods Imports: Imports of goods saw a substantial decrease of $7.9 billion, reaching $309.0 billion. Similar to exports, this figure comprises a $7.7 billion decrease in goods on a Census basis and a $0.2 billion reduction in net balance of payments adjustments.
- Services Imports: Imports of services also declined, though to a lesser extent, falling by $0.6 billion to $79.0 billion in June.
Real Goods Deficit Narrows
When accounting for inflation, the real goods deficit (measured in 2017 dollars on a Census basis) decreased by $5.3 billion, or 5.3 percent, in June. This real decline was more pronounced than the 3.7 percent decrease observed in the nominal goods deficit, suggesting that the reduction in goods imports was not solely due to price changes but also reflected a decrease in the volume of goods traded.
Three-Month Moving Averages Offer a Smoother Perspective
To provide a more stable view of trade trends, three-month moving averages are often considered. For the three months ending in June, the average goods and services deficit increased by $5.6 billion to $68.5 billion. This increase in the moving average suggests that while June itself saw a deficit reduction, the preceding months might have experienced higher deficits, leading to a less favorable overall trend over the recent quarter. Year-over-year, the average goods and services deficit for the three months ending in June 2026 increased by $6.6 billion compared to the same period in 2025, indicating a widening of the trade gap when viewed over a longer, rolling timeframe.
Trade Balances with Key Partners in June
The monthly data also provides insights into trade balances with specific countries and areas. In June, the U.S. recorded trade surpluses with:
- Netherlands ($7.2 billion)
- South and Central America ($5.6 billion)
- Hong Kong ($3.2 billion)
- Switzerland ($2.9 billion)
- United Kingdom ($2.2 billion)
- Singapore ($1.8 billion)
- Saudi Arabia ($1.8 billion)
- Brazil ($1.7 billion)
- Australia ($1.3 billion)
- Belgium ($0.9 billion)
Conversely, significant trade deficits were observed with:
- Vietnam ($21.6 billion)
- Mexico ($20.3 billion)
- China ($15.3 billion)
- Taiwan ($14.9 billion)
- European Union ($10.9 billion)
- South Korea ($7.4 billion)
- Canada ($7.2 billion)
- Germany ($7.1 billion)
- India ($4.5 billion)
- Malaysia ($4.4 billion)
- Japan ($3.3 billion)
- Ireland ($2.7 billion)
- Italy ($2.5 billion)
- France ($1.5 billion)
- Israel ($1.2 billion)
These figures highlight persistent trade imbalances with major economies in Asia and Europe, while demonstrating stronger trade relationships with certain regions and countries.
Context and Background: The U.S. Trade Balance
The U.S. international trade in goods and services is a critical component of the national economy, reflecting the flow of goods and services between the United States and other countries. The balance of trade, or trade balance, is the difference between a country’s exports and imports. A trade deficit occurs when a country imports more than it exports, while a trade surplus occurs when a country exports more than it imports.
The U.S. has historically run a persistent trade deficit in goods, often offset by a surplus in services. This deficit can be influenced by a multitude of factors, including global demand, exchange rates, trade policies, domestic consumption patterns, and the competitiveness of U.S. industries. Fluctuations in the trade balance are closely watched by economists, policymakers, and financial markets as indicators of economic health and international competitiveness.
Implications and Future Outlook
The June data, showing a shrinking deficit driven by declining trade volumes, presents a mixed economic signal. On one hand, a reduced deficit can be interpreted as a move towards a more sustainable trade position, potentially improving the nation’s current account balance. This could have positive implications for the U.S. dollar and reduce reliance on foreign capital to finance the deficit.
However, the fact that both exports and imports declined suggests a potential slowdown in global trade or a moderation in domestic demand. A broad-based decrease in trade could indicate weakening economic conditions both domestically and internationally, which could dampen overall economic growth.
The year-to-date figures, which show a significant deficit reduction driven by strong export growth, offer a more optimistic perspective for the longer term. This suggests that U.S. goods and services remain competitive in global markets. Policymakers will likely continue to monitor these trends closely, particularly as they assess the impact of trade policies and global economic developments on the U.S. economy.
The next release of U.S. International Trade in Goods and Services data is scheduled for September 3, 2026, covering trade figures for July 2026. This upcoming report will provide further insights into whether the trend of a shrinking deficit continues or if the broader decline in trade activity observed in June persists.
All statistics referenced in this report are seasonally adjusted and presented on a balance of payments basis, unless otherwise specified. For more detailed information and accompanying data tables, including not seasonally adjusted statistics and specific details for goods on a Census basis, readers are directed to the full release available on the U.S. Census Bureau and U.S. Bureau of Economic Analysis websites.








