Lana Rhoades
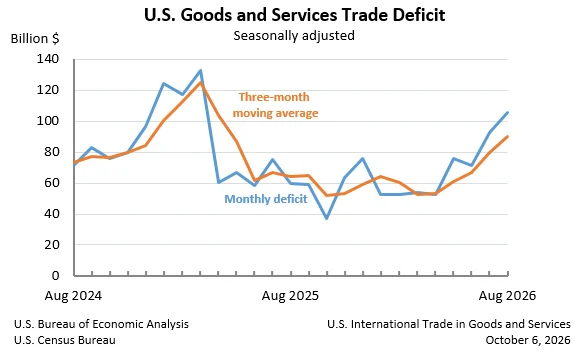
The United States experienced a substantial widening of its goods and services trade deficit in August, reaching $105.6 billion, a notable increase of $12.7 billion from the revised $92.8 billion deficit recorded in July. This expansion, announced jointly by the U.S. Census Bureau and the U.S. Bureau of Economic Analysis, was primarily fueled by a surge in imports that outpaced the growth in exports. The latest figures indicate a complex interplay of global economic forces impacting the nation’s trade balance, with significant implications for domestic industries and international economic relations.
August Trade Figures: A Deeper Dive
In August, U.S. exports of goods and services totaled $315.2 billion, representing an increase of $4.5 billion from the previous month. However, this positive momentum was overshadowed by a more pronounced rise in imports. Goods and services imports climbed to $420.8 billion, an increase of $17.2 billion from July. This disparity in growth rates led directly to the widened deficit.
Digging deeper into the components, the goods deficit, a key driver of the overall imbalance, expanded by $12.8 billion to $136.6 billion in August. Conversely, the services surplus, while still a positive contributor, saw a marginal increase of less than $0.1 billion, reaching $31.0 billion. This suggests that while the U.S. maintains a competitive edge in service exports, the burgeoning demand for imported goods is a more significant factor influencing the trade balance.
The reported figures are seasonally adjusted, meaning they have been smoothed to account for predictable seasonal patterns in trade. However, they are not adjusted for price changes, indicating that the nominal dollar values reflect both changes in the volume of trade and fluctuations in prices. The U.S. Census Bureau also provided data on the real goods deficit, measured in 2017 dollars, which increased by 8.2 percent to $114.7 billion in August. This real goods deficit grew at a slightly slower pace than the nominal deficit, suggesting that some portion of the nominal increase was attributable to higher import prices.
Year-to-Date Trends and Historical Context
While the August figures paint a picture of widening deficit, a broader year-to-date perspective reveals a different trend. For the first eight months of the year, the cumulative goods and services deficit decreased by a substantial $138.2 billion, or 19.9 percent, compared to the same period in 2025. This significant reduction suggests that earlier in the year, the U.S. trade performance was stronger. Exports year-to-date had increased by $267.7 billion, or 11.8 percent, while imports had risen by a more moderate $129.5 billion, or 4.4 percent. This divergence in growth rates earlier in the year contributed to a healthier trade balance.
The widening deficit in August could be interpreted as a sign of the U.S. economy’s continued robust demand for foreign goods, even as domestic production and exports show some growth. It also reflects the global economic environment, where supply chain dynamics and international demand play a crucial role. Understanding the historical context of these trade figures is essential for assessing their current significance. The United States has historically run a trade deficit in goods, often offset by a surplus in services. However, the magnitude and trajectory of this deficit are closely watched indicators of economic health and international competitiveness.
Moving Averages and Short-Term Trends
To smooth out month-to-month volatility, the Census Bureau also provides three-month moving averages. For the three months ending in August, the average goods and services deficit increased by $9.9 billion to $89.9 billion. This indicates that while August saw a significant jump, the underlying trend of a widening deficit was also present in the preceding months, albeit at a less pronounced rate.
On a year-over-year basis, the average goods and services deficit for the three months ending in August saw a considerable increase of $25.4 billion compared to the same period in 2025. This suggests that the current trade imbalance is not merely a fleeting anomaly but a more persistent trend that has developed over the past year. Such a sustained widening of the deficit can put pressure on the U.S. dollar and impact domestic employment in sectors competing with imports.
Key Drivers: Exports and Imports in Detail
Exports:
The $4.4 billion increase in overall exports in August was driven by a $4.4 billion rise in goods exports, bringing their total to $205.7 billion. On a Census basis, goods exports increased by $4.2 billion. Net balance of payments adjustments, which account for statistical discrepancies and timing differences, added $0.3 billion to the export figures. Exports of services, a sector where the U.S. typically holds a strong position, saw a modest increase of less than $0.1 billion, reaching $109.5 billion. This indicates steady but not exceptional growth in services exports during August.
Imports:
The surge in imports was primarily concentrated in goods. Imports of goods increased by a substantial $17.2 billion to $342.2 billion in August. On a Census basis, goods imports rose by $17.4 billion. Net balance of payments adjustments for imports decreased by $0.2 billion. Imports of services also experienced a slight uptick, increasing by less than $0.1 billion to $78.5 billion. The significant increase in goods imports highlights strong consumer and business demand for products manufactured abroad.
International Trade Partners: A Snapshot
The monthly data also provides insights into trade balances with key countries and areas. In August, the U.S. recorded trade surpluses with several nations, including the Netherlands ($7.7 billion), South and Central America ($5.6 billion), the United Kingdom ($3.6 billion), Hong Kong ($2.3 billion), Brazil ($1.3 billion), Belgium ($1.2 billion), Australia ($0.6 billion), and Saudi Arabia ($0.4 billion).
Conversely, the U.S. experienced significant trade deficits with several major trading partners. The largest deficits were with Mexico ($27.7 billion), Vietnam ($24.0 billion), Taiwan ($18.3 billion), China ($16.4 billion), and the European Union ($11.0 billion). Other notable deficits were recorded with South Korea ($9.4 billion), Canada ($7.1 billion), India ($6.2 billion), Germany ($6.2 billion), Malaysia ($6.0 billion), Italy ($4.3 billion), and Japan ($3.7 billion). These figures underscore the complex and multifaceted nature of U.S. global trade relationships, with substantial imbalances in specific bilateral trade flows.
Analysis and Implications
The widening of the U.S. trade deficit in August, particularly driven by a strong surge in imports, has several potential implications. Firstly, it suggests a robust domestic demand, which can be a positive sign for economic growth, but also indicates that a significant portion of this demand is being met by foreign production. This could create challenges for domestic manufacturers looking to expand their market share.
Secondly, a persistent and widening trade deficit can contribute to a weaker U.S. dollar over the long term, making U.S. exports more expensive for foreign buyers and imports cheaper for U.S. consumers. This can influence inflation and the competitiveness of U.S. industries.
The data also highlights the ongoing importance of global supply chains. The substantial increase in goods imports suggests that businesses are continuing to rely on international sourcing to meet demand, even amidst discussions about reshoring and diversifying supply. The services surplus, while positive, did not grow sufficiently to offset the rise in the goods deficit, underscoring the continued importance of the goods trade balance in the overall U.S. trade picture.
The substantial year-to-date improvement in the trade deficit prior to August’s widening suggests that the August figures might represent a temporary fluctuation or a response to specific market conditions. However, the increase in the three-month moving average indicates that the trend of widening deficits may be re-emerging. Future reports will be crucial in determining whether August’s deficit represents a short-term anomaly or the beginning of a new trend.
Revisions and Data Integrity
The Census Bureau also provided information on revisions to previous data. While specific details of the July revisions were not elaborated upon in the provided text, it is standard practice for trade data to undergo revisions as more complete information becomes available. These revisions are essential for ensuring the accuracy and reliability of economic indicators. The statistical significance of certain data points is noted as not applicable or not measurable, which is common for complex economic datasets.
Country Name Change Notice
In a minor but noteworthy update, the Census Bureau announced that references to "Nauru" in its trade reports have been replaced with "Naoero." This change aligns with the country’s official name and international recognition. Such updates are part of the bureau’s commitment to maintaining accurate and up-to-date statistical reporting.
The U.S. Census Bureau and the U.S. Bureau of Economic Analysis will release the next report on U.S. International Trade in Goods and Services for September 2026 on November 4, 2026. This upcoming release will provide further insights into the evolving landscape of U.S. international trade and its impact on the national economy. The full detailed report and schedule are available on the respective websites of the Census Bureau and the Bureau of Economic Analysis.