Candice Horbacz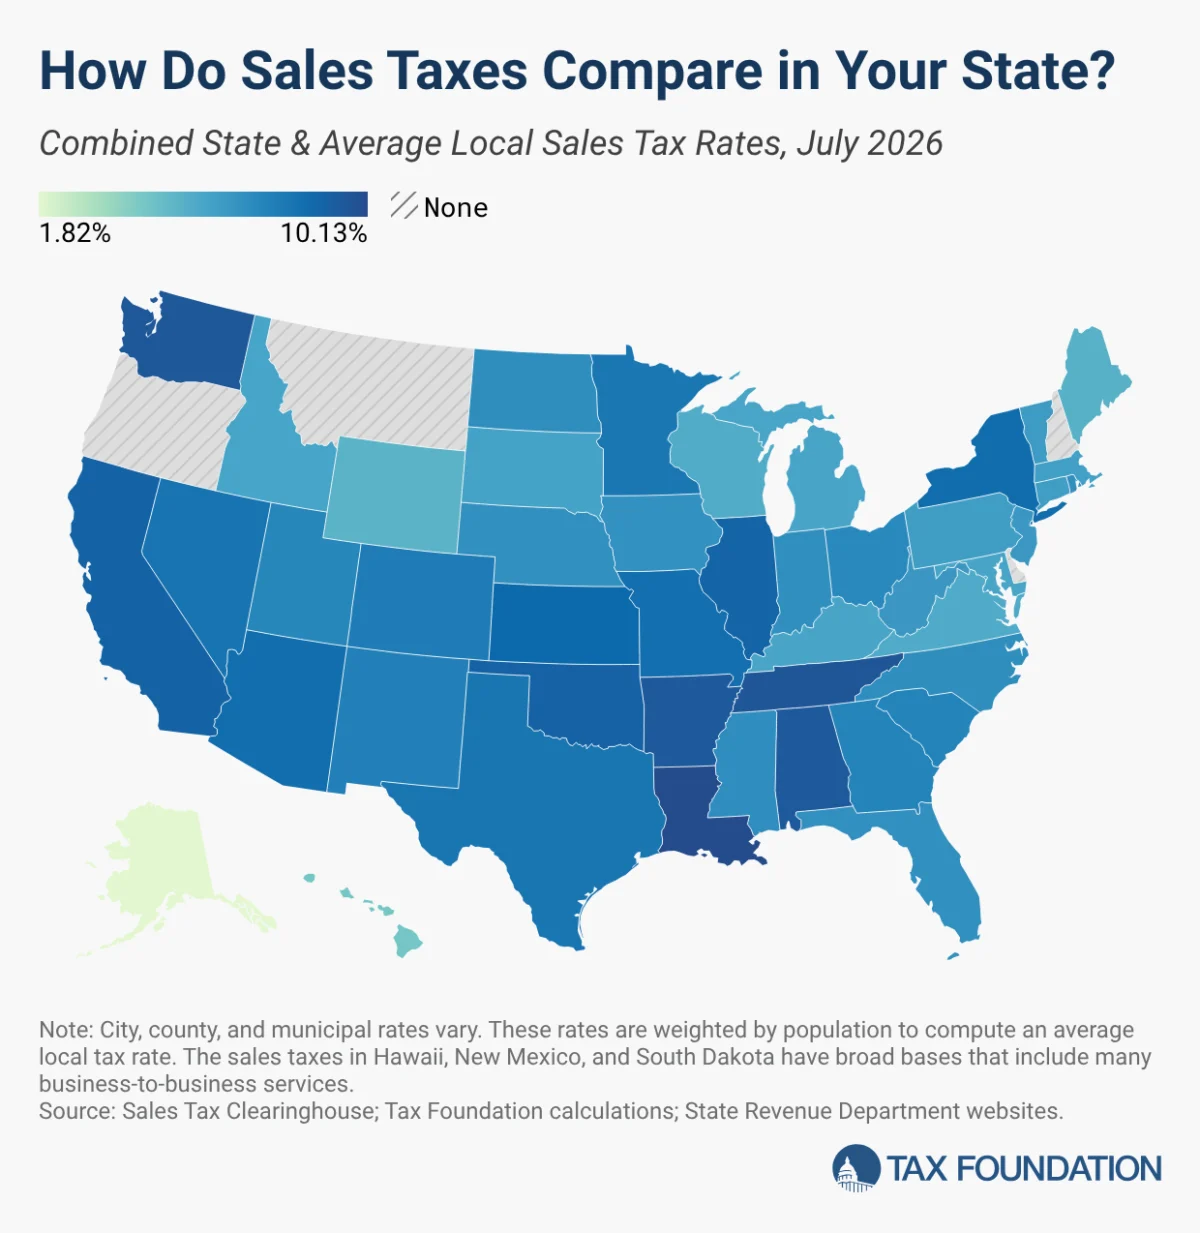
Retail sales taxes continue to serve as a foundational pillar of fiscal stability for governments across the United States, representing a significant portion of both state and local revenue streams. Comprising approximately 32 percent of state tax collections and 13 percent of local tax collections—amounting to 24 percent of combined collections—these consumption-based levies are often regarded as more conducive to economic growth than income taxes, primarily due to their tendency to introduce fewer economic distortions. This comprehensive analysis, drawing on data updated through July 1, 2026, delves into the current state of sales tax rates nationwide, highlighting recent legislative changes, regional disparities, and the ongoing policy debates surrounding their structure and impact.
The Dual Nature of Sales Taxation: State and Local Levies
The American sales tax system is characterized by a complex interplay of state-level mandates and local jurisdictional autonomy. Forty-five states currently impose a statewide sales tax, establishing a baseline rate that applies uniformly across their territories. However, this is only part of the equation. Thirty-eight of these states, alongside Alaska—which notably has no statewide sales tax—empower their localities to levy additional sales taxes. These local rates can be substantial, frequently rivaling or even surpassing the statewide figures. This tiered system means that states with seemingly moderate statewide sales tax rates can, in practice, impose some of the nation’s highest combined state and local rates, creating a varied and often challenging environment for consumers and businesses alike. The aggregated effect of these rates results in a population-weighted average combined sales tax rate of 7.53 percent nationwide as of July 1, 2026.
States with the Highest Combined Sales Tax Burdens
An examination of combined state and local sales tax rates reveals distinct regional concentrations of higher tax burdens. As of January 2026, Louisiana led the nation with an average combined rate of 10.13 percent, making it the only state to break the 10 percent threshold. This high figure is largely attributable to the significant local option sales taxes permitted throughout the state. Following closely were Tennessee (9.61 percent), Washington (9.57 percent), Arkansas (9.48 percent), and Alabama (9.46 percent). These states consistently rank among the highest, often due to a combination of elevated state rates and robust local taxing authority, where municipalities and counties actively utilize sales taxes to fund public services and infrastructure. For instance, in states like Tennessee, the absence of a broad-based individual income tax often necessitates a greater reliance on consumption taxes, contributing to its higher sales tax rate.
Absence of Statewide Sales Taxes: Alternative Fiscal Models
Five states stand apart by not levying a statewide sales tax: Alaska, Delaware, Montana, New Hampshire, and Oregon. This distinction significantly shapes their respective economic landscapes and revenue generation strategies. Of these five, only Alaska grants its localities the authority to impose local sales taxes, resulting in a varied patchwork of rates across its many communities, particularly those with significant tourist traffic or commercial activity. In contrast, states like Delaware, New Hampshire, and Oregon leverage the absence of a sales tax as a competitive advantage, often promoting themselves as destinations for "tax-free shopping." These states typically rely more heavily on other revenue sources, such as property taxes, individual income taxes, or corporate income taxes, to fund state operations. For example, Oregon is known for its relatively high individual income tax rates, while New Hampshire depends significantly on property taxes and business taxes.
State-Level Sales Tax Dynamics: Leaders and Lagards
Focusing solely on the state-level component, California holds the distinction of having the highest statewide sales tax rate at 7.25 percent. This rate reflects the state’s substantial fiscal needs and its large, diverse economy. Four other states—Indiana, Mississippi, Rhode Island, and Tennessee—share the second-highest state-level rate at 7 percent. At the other end of the spectrum, Colorado maintains the lowest non-zero state-level rate at 2.9 percent. This lower state rate is often balanced by the state’s robust local sales tax options, which can push combined rates much higher in specific jurisdictions. Five additional states—Alabama, Georgia, Hawaii, New York, and Wyoming—each levy a state sales tax rate of 4 percent, demonstrating a foundational consistency among a segment of the states.
Recent Legislative Shifts and Major Reforms
The period leading up to and including 2026 has seen several notable shifts in sales tax policy, reflecting diverse state-level priorities and economic conditions.
Louisiana’s Comprehensive Tax Overhaul (January 2025): Louisiana implemented a significant tax reform package that included an increase in its statewide sales tax rate from 4.45 percent to 5 percent in January 2025. This adjustment reversed a prior reduction from July 2018 and was a critical component of a broader legislative effort to overhaul the state’s tax structure. The reforms also introduced a 3 percent flat individual income tax, a 5.5 percent corporate income tax, provisions for full expensing of business investments, and the repeal of the state’s franchise tax. Lawmakers in Louisiana framed these reforms as a strategic move to enhance the state’s economic competitiveness, simplify the tax code, and ensure greater fiscal stability by creating a more predictable revenue stream less susceptible to economic fluctuations. The intent was to create a more attractive environment for businesses and residents while maintaining essential government services.
South Dakota’s Temporary Rate Reduction (2023): In 2023, South Dakota enacted a temporary cut to its state sales tax rate. This reduction, a response to a period of strong state revenues, was designed to provide relief to taxpayers. However, the legislation included a sunset clause, meaning the reduced rate is set to revert to its previous level in June 2027 unless further legislative action is taken. This temporary measure highlights a cautious approach by some states to tax cuts, ensuring flexibility in response to future economic conditions.
New Mexico’s Gross Receipts Tax Adjustment (July 2022): New Mexico, which levies a unique gross receipts tax (GRT) rather than a traditional sales tax, lowered its statewide GRT rate from 5.125 percent to 4.875 percent in July 2022. The GRT is distinct because it is applied to a company’s gross sales at various stages of production, not just final retail sales, leading to potential "tax pyramiding." Crucially, the legislation included a revenue trigger mechanism: if the revenue collected from the GRT in any single fiscal year between 2026 and 2029 falls below 95 percent of the previous year’s collection, the state’s rate will automatically revert to 5.125 percent on the following July 1. This innovative approach aims to provide tax relief while safeguarding state revenues against unforeseen economic downturns.
Notably, between January 2026 and July 2026, there were no additional statewide sales tax rate changes. This trend underscores a broader policy preference observed in recent years, where state lawmakers have often prioritized individual or corporate income tax cuts, believing these measures yield greater economic benefits in terms of attracting businesses and skilled labor.
Local Sales Tax Landscape: A Patchwork of Rates
While state-level rates provide a baseline, local sales taxes significantly influence the overall tax burden experienced by residents and businesses. States with the highest average local sales tax rates as of January 2026 included Alabama (5.46 percent), Louisiana (5.13 percent), Colorado (4.99 percent), Oklahoma (4.56 percent), and New York (4.54 percent). These figures demonstrate the substantial fiscal reliance many local governments place on consumption taxes.
Minor local adjustments have been a more frequent occurrence since January 2026, leading to subtle shifts in combined rates and state rankings. North Carolina, for instance, experienced a slight increase in its combined rate, resulting in a four-place decrease in its national ranking. Conversely, Wyoming was the only state to see a marginal decrease in its combined rate over the period, improving its rank by one place, primarily due to several jurisdictions reducing their local option tax rates in February and July. Despite these minor fluctuations, Louisiana continues to hold the unenviable position of having the highest combined state and average local sales tax rate among the states, standing at 10.11 percent.
Key Local Policy Changes and Their Rationales
Several specific local policy changes illustrate the dynamic nature of sales taxation at the sub-state level:
Illinois’s Food Tax Elimination (January 2026): Effective January 1, 2026, Illinois eliminated its one percent statewide sales tax on grocery food items. This move was intended to provide relief to consumers, particularly lower-income households, for whom food constitutes a larger portion of their budget. However, in a common reaction to state-level tax reductions, many local jurisdictions within Illinois subsequently chose to impose their own local taxes on food. This often offsets the state-level relief, maintaining or even increasing the effective tax burden on groceries in some areas, driven by local governments’ needs to maintain their revenue bases for essential services.
Georgia’s Floating Local Option Sales Tax (FLOST): Many counties in Georgia have experienced increases in their sales tax rates by up to one percentage point due to the adoption or adjustment of the Floating Local Option Sales Tax (FLOST). FLOST is an optional countywide sales tax that can be levied for up to five years. Its primary purpose is to provide property tax relief by generating revenue that is then shared between the levying county and its constituent municipalities. This mechanism allows local governments to diversify their revenue streams and mitigate the burden on property owners, a policy often favored by residents seeking to control rising housing costs.
New Jersey’s Urban Enterprise Zones: In certain designated "Urban Enterprise Zones" (UEZs) within New Jersey, qualifying sellers are authorized to collect sales tax at half the statewide rate, currently 3.3125 percent. This program is a targeted economic development initiative designed to stimulate business activity and job creation in economically distressed urban areas. The reduced sales tax acts as an incentive for both businesses to locate there and consumers to shop, fostering revitalization. This unique local concession is reflected as a small negative adjustment in the state’s average local rate calculations.
The Economic Imperative of Tax Competition
The varying sales tax rates across jurisdictions are not merely statistical points; they exert a tangible influence on consumer behavior and business location decisions. The principle of tax competition dictates that significant rate disparities can lead to tax avoidance. Consumers, especially when making major purchases, are often willing to travel to lower-tax areas or opt for online purchases to circumvent higher sales tax rates. A prime example is observed in the Chicago metropolitan area, where consumers frequently make substantial purchases in surrounding suburbs or via e-commerce platforms to avoid Chicago’s 10.25 percent combined sales tax rate.
At the statewide level, this phenomenon is even more pronounced. Businesses, when planning new locations or expansions, often strategically choose sites just outside the borders of high-sales-tax states or jurisdictions to avoid their rates. The New England region offers a stark illustration: despite Interstate 91 running parallel on the Vermont side of the Connecticut River, a disproportionately higher number of retail establishments choose to locate on the New Hampshire side. New Hampshire, with no statewide sales tax, becomes an attractive hub for commerce. Research has shown that per capita sales in New Hampshire’s border counties have tripled since the late 1950s, while those in Vermont’s border counties have remained stagnant. This dynamic was even playfully acknowledged by Delaware, which once used its highway welcome signs to proudly declare itself the "Home of Tax-Free Shopping," a direct appeal to consumers from neighboring states.
These competitive pressures underscore a critical lesson for state and local governments: raising sales tax rates too high relative to neighboring jurisdictions can be counterproductive. Such actions risk yielding less revenue than projected, or in extreme scenarios, even lead to net revenue losses, as economic activity shifts away. Policymakers must carefully weigh the need for revenue against the potential for consumer and business flight, ensuring that their tax policies remain competitive within the broader regional and national economic landscape.
Beyond Rates: The Critical Role of Sales Tax Bases
While sales tax rates capture significant attention, they represent only half of the equation in understanding the true impact and effectiveness of a state’s sales tax system. The other crucial component is the sales tax base—that is, precisely what goods and services are subject to the tax. States vary considerably in this regard, leading to vastly different revenue outcomes and economic effects, even at similar rates.
Tax experts generally advocate for a sales tax that applies broadly to all final retail sales of goods and services but explicitly exempts intermediate business-to-business (B2B) transactions within the production chain. This "broad-based, right-sized" approach aims to tax each product once and only once, preventing "tax pyramiding" where the same item is taxed multiple times as it moves through various stages of production, ultimately increasing costs for consumers and distorting economic signals.
In practice, however, the application of most state sales taxes falls far short of this ideal. Many states exempt essential goods like groceries, while others tax them at a reduced rate, and some apply the full sales tax. Similar exemptions or reduced rates often apply to clothing. While these exemptions are often introduced with the laudable goal of making the sales tax less regressive (as lower-income households spend a larger proportion of their income on necessities), they narrow the tax base, potentially necessitating higher rates on taxable items or reducing overall revenue.
The evolving economy, increasingly driven by services rather than tangible goods, presents a significant challenge to traditional sales tax bases. Many state sales taxes were designed decades ago for a manufacturing-heavy economy and have struggled to adapt. Ideally, states would modernize their sales tax regimes to better align with contemporary personal consumption patterns, expanding the base to include more services while maintaining the exemption for B2B transactions.
Hawaii provides a unique, albeit problematic, example of a broad sales tax base. Its general excise tax (GET), often considered a form of sales tax, is levied on virtually all business activities, including B2B transactions. While this creates a very broad base—estimated to tax 119 percent of the state’s personal income due to multiple applications—it also results in significant tax pyramiding, making goods and services more expensive for residents and visitors alike. This stands in stark contrast to the national median, where the sales tax applies to roughly 36 percent of personal income, highlighting the vast differences in base definitions across states.
Methodology and Data Integrity
The data presented in this analysis are derived from quarterly sales tax information published by the Sales Tax Clearinghouse, encompassing state, county, and city-level rates disaggregated by ZIP code. To provide an accurate representation of the average local tax rate for each state, these figures are weighted according to the most recent Census population figures. This methodology represents a refinement from certain previous editions, which utilized decennial population data, making this report not strictly comparable to most previously published editions, though differences typically amount to minor rounding errors.
It is important to note that the Census Bureau reports population data using a five-digit identifier known as a ZIP Code Tabulation Area (ZCTA), which approximates a geographical area associated with a given ZIP code. This approach is necessary because a substantial number of ZIP codes do not actually correspond to residential populations but serve purely postal functions (e.g., a specific building or post office box). For the purposes of this analysis, ZIP codes lacking a corresponding ZCTA population figure are omitted from calculations. While these omissions introduce a minor degree of inexactitude, their overall impact on the resultant averages is not significant, as proximate ZIP code areas with ZCTA population numbers effectively capture the tax rate of those jurisdictions.
Conclusion: Navigating the Future of Sales Taxation
The landscape of state and local sales taxes in 2026 is a complex tapestry woven from diverse state policies, local fiscal needs, and dynamic economic forces. Sales taxes remain a vital revenue engine, offering what many policymakers consider a pro-growth alternative to income-based taxation. However, the intricate interplay of state and local rates, coupled with the critical but often overlooked aspect of the tax base, creates a system ripe with both opportunities and challenges.
States like Louisiana have undertaken comprehensive reforms to align their sales tax structures with broader economic development goals, while others, like Illinois and Georgia, have made targeted adjustments to address specific social or fiscal objectives. The constant pressure of tax competition necessitates a delicate balance for policymakers, who must weigh the imperative of revenue generation against the risk of driving consumers and businesses to lower-tax jurisdictions. Moreover, the ongoing need to modernize sales tax bases to reflect an increasingly service-oriented economy presents a continuous challenge, demanding innovative approaches to ensure fairness, efficiency, and revenue stability. As states navigate their fiscal futures, the evolution of sales tax policy will undoubtedly remain a central theme, shaping economic competitiveness and the quality of public services for years to come.