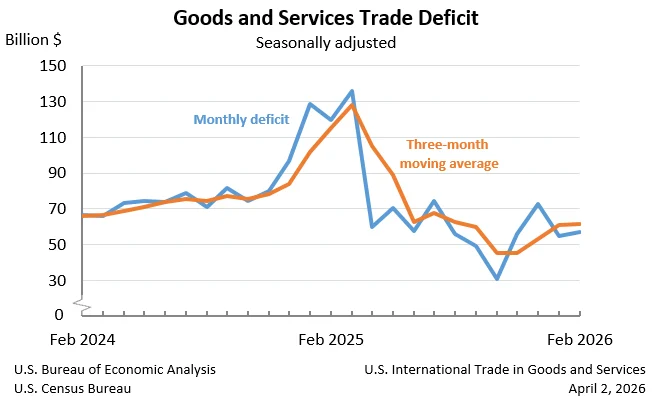
The United States experienced a widening of its trade deficit in goods and services in February, reaching $57.3 billion. This marks an increase of $2.7 billion from the revised January figure of $54.7 billion. The latest data, released jointly by the U.S. Census Bureau and the U.S. Bureau of Economic Analysis, indicates a robust, albeit imbalanced, flow of international trade during the month, with both exports and imports showing significant growth.
February Trade Dynamics: A Snapshot of Shifting Flows
In February, U.S. exports of goods and services totaled $314.8 billion, representing an increase of $12.6 billion from the previous month. Concurrently, imports surged to $372.1 billion, a rise of $15.2 billion compared to January. This divergence in growth rates between imports and exports contributed directly to the expansion of the overall trade deficit.
The overall deficit’s escalation was a result of opposing trends in the goods and services sectors. The deficit in goods widened by $2.5 billion, reaching $84.6 billion. This was partially offset by a decrease in the surplus of services, which narrowed by $0.2 billion to $27.3 billion. This suggests that while the U.S. continues to maintain a positive balance in its services trade, the growth in its goods imports outpaced its goods exports, driving the overall negative balance higher.
Deeper Dive into Goods and Services
Goods Trade: The increase in the goods deficit was primarily driven by a substantial rise in goods imports. Imports of goods on a Census basis increased by $14.1 billion, contributing significantly to the overall import growth. Exports of goods, while also increasing, did not keep pace with the import surge. Exports of goods on a Census basis saw an increase of $11.5 billion.
Services Trade: The services sector presented a more nuanced picture. Exports of services experienced a healthy increase of $1.1 billion, reaching $107.9 billion. However, imports of services also grew, albeit at a slightly faster pace, by $1.3 billion, totaling $80.6 billion. This continued growth in both services exports and imports, coupled with the faster import growth, led to a slight reduction in the services surplus.
Contextualizing the February Figures: Trends and Revisions
The February trade deficit, while showing an increase from January, must be viewed within the broader context of recent trade performance. Year-to-date data reveals a significant improvement in the overall goods and services deficit, which has decreased by $136.1 billion, or 54.8 percent, compared to the same period in the preceding year. This remarkable reduction is attributed to a substantial increase in exports, up $62.6 billion (11.3 percent), and a notable decrease in imports, down $73.5 billion (9.2 percent). This suggests that while February saw a temporary setback, the underlying trend for the year thus far has been one of deficit reduction.
The report also highlighted revisions to January’s trade data. While specific details of these revisions for exports and imports were not elaborated upon in the provided summary, it is standard practice for these figures to be subject to adjustments as more comprehensive data becomes available. Such revisions are crucial for accurately assessing trade performance and informing economic policy.
Three-Month Moving Averages: Smoothing Out Volatility
To provide a more stable view of trade trends, the report presents three-month moving averages. For the three months ending in February, the average goods and services deficit rose by $0.4 billion to $61.6 billion. This figure represents a more smoothed-out perspective, accounting for month-to-month fluctuations. On a year-over-year basis, this three-month average deficit decreased by a significant $53.4 billion compared to the three months ending in February 2025, reinforcing the positive year-to-date trend.
Real Goods Deficit: Adjusting for Inflation
The report also delves into the real goods deficit, which is adjusted for price changes, using 2017 dollars. In February, the real goods deficit, on a Census basis, increased by $0.5 billion, or 0.6 percent, to $83.5 billion. This increase in the real deficit was less pronounced than the 3.2 percent increase observed in the nominal goods deficit, suggesting that a portion of the nominal increase was attributable to rising prices rather than solely an increase in the volume of goods traded.
Trade Partners: A Complex Web of Balances
The monthly data also offers a granular view of trade balances with key countries and regions. In February, the U.S. recorded trade surpluses with a number of nations, including Switzerland ($7.8 billion), the Netherlands ($6.8 billion), Hong Kong ($6.6 billion), and the United Kingdom ($5.6 billion). Significant surpluses were also noted with South and Central America ($3.8 billion), Singapore ($2.9 billion), and Brazil ($1.4 billion).
Conversely, the U.S. maintained substantial trade deficits with several major trading partners. Taiwan led the list with a deficit of $21.1 billion, followed by Mexico ($16.8 billion) and Vietnam ($16.5 billion). China also remained a significant source of the trade deficit, with a deficit of $13.1 billion. Other countries with notable deficits included South Korea ($7.6 billion), the European Union ($5.1 billion), and Japan ($4.7 billion). These figures highlight the intricate and multifaceted nature of global trade relationships, where surpluses with some partners are offset by deficits with others.
Upcoming Revisions and Data Releases
The U.S. Census Bureau and the Bureau of Economic Analysis also announced upcoming significant updates to their international trade statistics. Beginning with the release of the "U.S. International Trade in Goods and Services" report (FT-900) and its Annual Revision on June 9, 2026, trade in goods data, on both Census and Balance of Payments (BOP) bases, will be revised back to 2021. Furthermore, trade in services data will be revised back to 1999. These comprehensive revisions are expected to incorporate updated methodologies and source data, providing a more accurate and refined picture of U.S. international trade over several years.
These revised statistics for goods on a BOP basis and for services will also be integrated into the "U.S. International Transactions and Investment Position, 1st Quarter 2026 and Annual Update" report, slated for release by BEA on June 24, 2026. BEA’s Interactive Data Application will also reflect these updated figures.
The next release of the "U.S. International Trade in Goods and Services" report, covering March 2026 data, is scheduled for May 5, 2026.
Broader Economic Implications and Analysis
The widening of the U.S. trade deficit in February, while a concern for policymakers aiming to reduce trade imbalances, is occurring within a context of a generally expanding global economy. The increase in both exports and imports suggests underlying demand and economic activity both domestically and internationally.
Factors influencing the deficit: Several factors can contribute to fluctuations in the trade deficit. These include global economic growth rates, currency exchange rates, domestic consumer demand, and the competitiveness of U.S. industries. For instance, a strengthening U.S. dollar can make imports cheaper and exports more expensive, potentially widening the deficit. Conversely, robust global demand for U.S. goods and services can boost exports and narrow the deficit.
Potential impacts: A persistent and large trade deficit can have several economic implications. It can contribute to a country’s national debt if foreign capital is used to finance the deficit. It can also be seen as a sign of a lack of domestic competitiveness in certain sectors. However, some economists argue that trade deficits are not inherently problematic, especially if they reflect strong domestic investment and consumer confidence.
The observed year-to-date improvement in the deficit suggests that underlying economic forces may be working to reduce the imbalance. The strong growth in exports and the decrease in imports over the first part of the year indicate potential shifts in global trade dynamics or policy effectiveness.
Industry perspectives (inferred): While not directly quoted, the data suggests that industries heavily reliant on imports, such as electronics or automotive manufacturing, may be experiencing higher input costs or increased demand for foreign-made goods. Conversely, export-oriented sectors, particularly in services like technology, finance, and professional services, appear to be performing strongly, contributing to the overall export growth.
Future outlook: The upcoming revisions to trade data will be crucial in providing a more definitive understanding of historical trade flows and their underlying drivers. Policymakers will likely continue to monitor these figures closely, as trade remains a significant component of the U.S. economy and a subject of ongoing debate regarding its impact on domestic employment and economic growth. The interplay of global economic conditions, trade policies, and currency fluctuations will continue to shape the trajectory of the U.S. trade balance in the months and years to come.