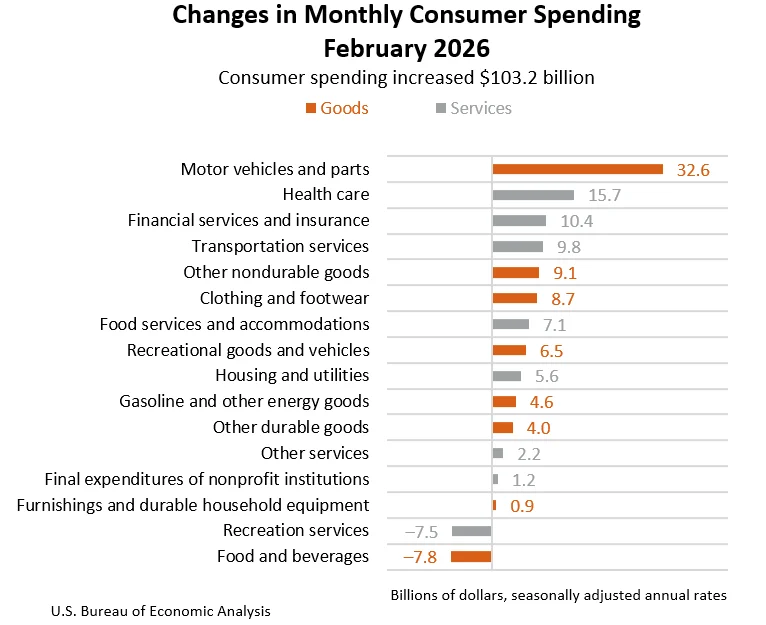
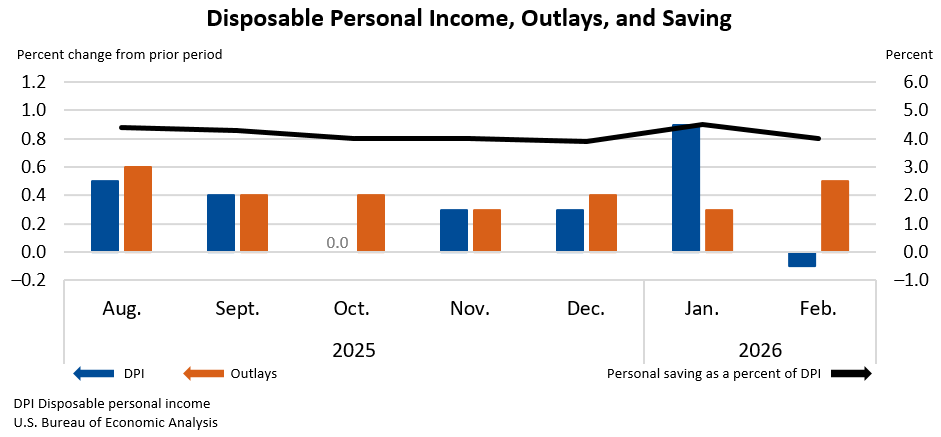
Personal income in the United States experienced a marginal decline of $18.2 billion, or 0.1 percent at a monthly rate, in February 2026. This figure, released by the U.S. Bureau of Economic Analysis (BEA), marks a slight contraction in the nation’s overall earnings. Concurrently, disposable personal income (DPI), which represents personal income after taxes, also decreased by $18.3 billion, a 0.1 percent drop. This suggests that after accounting for tax obligations, households had marginally less income available for spending or saving. However, this decrease in income was juxtaposed with a robust increase in personal consumption expenditures (PCE), which surged by $103.2 billion, a 0.5 percent rise. This divergence between income and spending indicates a potential drawdown of savings or an increase in borrowing to finance consumption.
The report, originally slated for release on March 27, 2026, was rescheduled to accommodate the data compilation and analysis that followed the October-November 2025 government shutdown. This administrative delay, while not impacting the economic figures themselves, highlights the logistical challenges that can arise from such federal disruptions. The shutdown, which stemmed from disagreements over budgetary allocations and fiscal policy priorities, led to a temporary halt in many government operations, including the routine collection and dissemination of key economic statistics. The subsequent need to catch up on data processing and verification extended the release schedule for this critical report on personal income and consumption.
Analyzing the February Economic Landscape: Income Contraction Meets Spending Surge
The decrease in current-dollar personal income during February was primarily attributed to declines in two key components: personal dividend income and personal current transfer receipts. Dividend income, which represents payments made by corporations to their shareholders, can be volatile and is often influenced by corporate profitability and market conditions. A decrease in this area suggests a potential softening in corporate earnings or a strategic decision by companies to retain earnings rather than distribute them. Personal current transfer receipts, which include payments like social security benefits and unemployment insurance, also saw a reduction. This could be due to a variety of factors, including a decrease in unemployment claims as the labor market tightens, or adjustments in government benefit programs.
Despite the slight dip in overall income, consumers demonstrated a strong inclination to spend. Personal outlays, a broader measure encompassing PCE, personal interest payments, and personal current transfer payments, saw a substantial increase of $106.5 billion in February. This indicates that consumers were actively engaging in spending activities, even as their reported income marginally declined. The sum of PCE, the largest component of personal outlays, climbed by $103.2 billion. This increase was evenly split between spending on goods and services, with expenditures on goods rising by $58.7 billion and spending on services increasing by $44.5 billion. This balanced growth suggests a broad-based consumer demand across various sectors of the economy.
The Shifting Dynamics of Personal Saving
The interplay between declining income and rising spending had a direct impact on personal saving. In February, personal saving amounted to $931.5 billion. However, the personal saving rate, calculated as personal saving as a percentage of disposable personal income, stood at 4.0 percent. This rate represents a decrease from previous periods, reflecting the fact that a larger portion of disposable income was being directed towards consumption rather than being saved. A declining saving rate can be a signal of consumer confidence and willingness to spend, but it can also raise concerns about long-term financial security and the sustainability of consumption patterns if income growth does not keep pace.
The BEA’s report also detailed the changes in real personal consumption expenditures, which adjust for inflation. Real PCE increased by $17.3 billion, or 0.1 percent, in February. While this represents an expansion in the volume of goods and services consumed, the pace of growth is relatively modest compared to the nominal increase in spending. This suggests that a portion of the rise in nominal PCE was driven by price increases rather than a significant increase in the quantity of goods and services purchased.
Inflationary Trends and Their Impact on Consumer Purchasing Power
The report provided crucial insights into inflationary pressures through the Personal Consumption Expenditures (PCE) price index. For February, the PCE price index saw an increase of 0.4 percent from the preceding month. This indicates a broad-based acceleration in price levels across the economy. Of particular note, the core PCE price index, which excludes volatile food and energy components, also rose by 0.4 percent. This suggests that underlying inflationary pressures are persistent, impacting the cost of a wide range of goods and services beyond those typically subject to rapid price fluctuations.
Looking at a year-over-year comparison, the PCE price index for February had increased by 2.8 percent compared to the same month in the previous year. The core PCE price index, excluding food and energy, showed a slightly higher increase of 3.0 percent over the same period. These figures highlight a sustained trend of rising prices, which can erode consumer purchasing power if wage growth does not match or exceed inflation. The persistence of core inflation suggests that monetary policy responses may continue to be a focal point for economic policymakers aiming to stabilize prices.
Revisiting the Economic Context: The Lingering Effects of the Government Shutdown
The October-November 2025 government shutdown, while a past event, cast a shadow over the release of this February economic data. Government shutdowns, by their nature, disrupt the flow of information and can lead to delays in crucial economic reporting. The BEA’s note about the rescheduled release underscores this reality. Such disruptions can create uncertainty for businesses and investors who rely on timely and accurate economic data to make informed decisions. Furthermore, the shutdown itself can have direct economic consequences, impacting government spending, employment, and the confidence of both consumers and businesses. The subsequent need for BEA to process and verify data that might have been affected by operational halts is a reminder of the intricate relationship between government functionality and economic transparency.

Technical Notes and Data Revisions: Enhancing Accuracy and Transparency
The technical notes accompanying the BEA release provided further detail on the factors influencing the February data and outlined recent revisions. The decrease in personal income was partially offset by increases in compensation and farm proprietors’ income. Compensation, which includes wages and salaries, is a significant driver of personal income, and its growth can help mitigate declines in other areas. Farm proprietors’ income, while often a smaller component, can be subject to significant fluctuations due to weather events, commodity prices, and global agricultural markets.
The report also addressed an adjustment to the PCE price index for legal services. While an adjustment was maintained for January, no such adjustment was made for February. The BEA’s practice of adjusting source data is a critical aspect of ensuring the accuracy of its estimates. This process allows the BEA to account for potential anomalies or inconsistencies in the raw data provided by other government agencies or private entities. The clarification regarding the legal services adjustment demonstrates a commitment to transparency in their methodology.
Furthermore, the release included updates to estimates for October through January, reflecting newly available data from the Bureau of Labor Statistics (BLS) for wages and salaries. These revisions are a standard part of the BEA’s statistical process, aimed at incorporating the most up-to-date information to refine historical estimates. The confirmation that the January wage and salary increase remained unchanged at 0.5 percent provides a stable benchmark for recent labor market compensation trends.
Looking Ahead: The Next Economic Indicators
The BEA announced that the next Personal Income and Outlays (PIO) release is scheduled for April 30, 2026, at 8:30 a.m. Eastern Daylight Time, which will cover data for March 2026. This upcoming release will provide further insights into the trajectory of personal income, consumer spending, and inflation, allowing economists and policymakers to assess whether the trends observed in February are continuing, accelerating, or moderating. The continuous flow of such data is essential for understanding the dynamic nature of the U.S. economy and for formulating effective economic policies. The BEA’s ongoing efforts to improve its news release format, including the integration of direct links to its interactive data tables, aim to enhance user accessibility and the efficient dissemination of crucial economic information. The discontinuation of PDF and Excel tables for news releases, replaced by the comprehensive online interactive data application, signifies a move towards a more dynamic and data-driven approach to public reporting.