

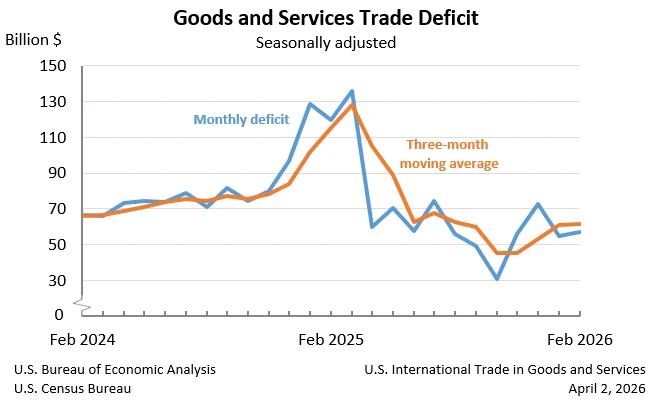
The United States recorded a goods and services deficit of $57.3 billion in February, an increase of $2.7 billion from the revised January figure of $54.7 billion, according to joint data released today by the U.S. Census Bureau and the U.S. Bureau of Economic Analysis. This widening of the trade gap reflects a more substantial rise in imports compared to exports during the month.
February Trade Data Reveals Increased Deficit Amidst Shifting Global Dynamics
The latest figures indicate a growing imbalance in the nation’s trade with the rest of the world. In February, U.S. exports of goods and services reached $314.8 billion, marking an increase of $12.6 billion from January. Concurrently, imports of goods and services surged to $372.1 billion, a more pronounced rise of $15.2 billion over the same period. This differential growth rate directly contributed to the expansion of the overall trade deficit.
Breaking down the components, the goods deficit widened by $2.5 billion to reach $84.6 billion in February. This was partially offset by a slight decrease in the services surplus, which contracted by $0.2 billion to $27.3 billion. While the services sector continues to contribute positively to the U.S. trade balance, its diminishing surplus was insufficient to counteract the growing deficit in goods trade.
Key Figures from February Trade Report:
- Goods and Services Deficit: $57.3 billion (up 4.9% from January)
- Total Exports: $314.8 billion (up 4.2% from January)
- Total Imports: $372.1 billion (up 4.3% from January)
The data, adjusted for seasonality but not price changes, provides a snapshot of the U.S. economy’s engagement with international markets. It is important to note that the figures for "statistical significance" are not applicable or measurable for these particular data points, as indicated by the source.
Underlying Trends: Goods Deficit Expansion Drives Overall Increase
The primary driver behind the February deficit increase was the goods trade. Exports of goods saw a notable increase of $11.5 billion, reaching $206.9 billion. This growth in goods exports was reported on a Census basis, with less than a negligible increase attributed to net balance of payments adjustments.
However, imports of goods experienced an even larger jump, increasing by $14.0 billion to $291.5 billion. On a Census basis, goods imports rose by $14.1 billion, while net balance of payments adjustments saw a minor decrease of $0.1 billion. This disparity between the growth rates of goods imports and exports is a critical factor in the widening deficit.
In contrast, the services sector demonstrated a more stable performance. Exports of services grew by $1.1 billion to $107.9 billion in February. Similarly, imports of services saw an increase of $1.3 billion, reaching $80.6 billion. While both services exports and imports rose, the net effect was a slight contraction of the services surplus.
Real Goods Trade Shows Different Picture
When accounting for inflation, the real goods deficit, measured in 2017 dollars on a Census basis, increased by $0.5 billion, or 0.6 percent, to $83.5 billion in February. This is a more moderate increase compared to the 3.2 percent rise in the nominal goods deficit, suggesting that a portion of the nominal increase was due to higher prices rather than a pure volume expansion of imports.
Year-to-Date Performance Offers a Contrasting Perspective
Despite the month-over-month increase in the deficit, the year-to-date figures present a more optimistic outlook. For the period covering January and February of the current year, the goods and services deficit has decreased by a significant $136.1 billion, representing a 54.8 percent reduction compared to the same period in the previous year.
This substantial year-to-date improvement is attributed to a strong performance in exports, which have increased by $62.6 billion, or 11.3 percent. Simultaneously, imports have seen a notable decline of $73.5 billion, or 9.2 percent. This trend suggests that underlying economic adjustments may be contributing to a more favorable trade balance over a longer horizon, even with short-term monthly fluctuations.
Three-Month Moving Averages Indicate Moderate Growth in Deficit
To smooth out monthly volatility, the report also analyzes three-month moving averages. For the three months ending in February, the average goods and services deficit increased by $0.4 billion to $61.6 billion. This indicates a slight but persistent upward trend in the deficit when viewed over a slightly longer period.
Year-over-year, however, the average goods and services deficit has decreased substantially. For the three months ending in February, the average deficit was $53.4 billion lower than in the same period of 2025. This reinforces the observation that while recent monthly data shows a widening, the broader trend over the past year has been a reduction in the trade gap.
Trade Balances with Key Partners: A Mixed Landscape
The detailed breakdown of goods trade by selected countries and areas for February reveals a complex web of international economic relationships. The U.S. maintained trade surpluses with a number of nations, including Switzerland ($7.8 billion), the Netherlands ($6.8 billion), Hong Kong ($6.6 billion), and the United Kingdom ($5.6 billion). Surpluses were also recorded with South and Central America ($3.8 billion), Singapore ($2.9 billion), Brazil ($1.4 billion), Australia ($0.9 billion), Belgium ($0.8 billion), and Saudi Arabia ($0.2 billion).
Conversely, significant trade deficits were recorded with several key trading partners. Taiwan led the list with a deficit of $21.1 billion, followed by Mexico ($16.8 billion) and Vietnam ($16.5 billion). China ($13.1 billion), South Korea ($7.6 billion), the European Union ($5.1 billion), and Japan ($4.7 billion) also contributed to the U.S. deficit. Other countries with notable deficits included Malaysia ($4.0 billion), India ($3.5 billion), Germany ($3.3 billion), Ireland ($2.8 billion), France ($2.2 billion), Italy ($1.8 billion), Israel ($0.8 billion), and Canada ($0.7 billion). These figures highlight the diverse nature of U.S. trade flows and the varying economic dynamics with different regions and countries.
Upcoming Revisions and Data Updates
The U.S. Census Bureau and the Bureau of Economic Analysis also provided notice of upcoming significant revisions to international trade data. With the release of the "U.S. International Trade in Goods and Services" report (FT-900) and its Annual Revision on June 9, 2026, statistics on trade in goods, both on a Census basis and a balance of payments (BOP) basis, will be revised beginning with 2021. Similarly, statistics on trade in services will be revised beginning with 1999.
These revised statistics for goods on a BOP basis and for services will also be incorporated into the "U.S. International Transactions and Investment Position, 1st Quarter 2026 and Annual Update" report and BEA’s Interactive Data Application, both scheduled for release by BEA on June 24, 2026. The upcoming revisions are expected to incorporate new source data, updated methodologies, and improved estimation techniques to provide a more accurate and comprehensive picture of U.S. international trade and financial flows.
Broader Economic Implications and Analysis
The widening of the U.S. trade deficit in February, while concerning in the short term, should be viewed within the broader context of global economic activity and domestic demand. An increase in imports often signals robust consumer and business spending within the United States, a sign of economic vitality. However, a persistent and growing deficit can raise concerns about long-term economic competitiveness, national debt, and the stability of the U.S. dollar.
The increase in the goods deficit, in particular, could be influenced by a variety of factors. These might include fluctuations in commodity prices, shifts in global supply chains, changes in consumer preferences, and the relative strength of the U.S. dollar against other currencies. For instance, if the dollar strengthens, U.S. exports become more expensive for foreign buyers, potentially dampening demand, while imports become cheaper for U.S. consumers and businesses, boosting demand.
The fact that the real goods deficit grew at a slower pace than the nominal deficit suggests that inflationary pressures on imported goods played a role in the overall increase. This aligns with broader trends in global inflation that have been observed in recent periods.
The year-to-date improvement in the deficit, driven by strong export growth and import reduction, points to potential positive structural shifts. Increased exports can signal growing demand for U.S. products and services abroad, fostering job creation and economic expansion. Reductions in imports, if driven by increased domestic production or a shift in consumer behavior, can also contribute to a more balanced economy.
Economists will be closely monitoring future reports to determine whether the February deficit widening is a temporary anomaly or the beginning of a new trend. The next report, covering March 2026 data, is scheduled for release on May 5, 2026, and will provide further insights into the trajectory of U.S. international trade. The upcoming comprehensive revisions are also highly anticipated as they are expected to offer a more refined understanding of the nation’s trade performance over several years.
The U.S. Census Bureau and the U.S. Bureau of Economic Analysis are the primary sources for this data, with detailed reports and additional statistics available on their respective websites. These agencies are committed to providing timely and accurate information to policymakers, businesses, and the public to facilitate informed economic decision-making.


