

The U.S. economy demonstrated a more tempered growth trajectory in the fourth quarter of 2025, with real Gross Domestic Product (GDP) expanding at an annual rate of 0.5 percent. This figure, representing the third and final estimate from the U.S. Bureau of Economic Analysis (BEA), marks a significant deceleration from the robust 4.4 percent growth recorded in the preceding third quarter. The downward revision from the second estimate, primarily attributed to a recalibration of investment data, underscores the complex economic landscape influenced by various factors, including a notable government shutdown that disrupted the release schedule for this crucial economic indicator.
The delay in releasing the third estimate, originally slated for March 27, 2026, was a direct consequence of the government shutdown that spanned October through November 2025. This disruption to federal operations, while not fully quantifiable in its entirety, is estimated by the BEA to have subtracted approximately 1.0 percentage point from real GDP growth during the fourth quarter due to a reduction in the labor services supplied by federal employees. Despite furloughed employees receiving back pay, which mitigated impacts on current-dollar federal compensation, the shutdown’s effect on economic data collection and reporting created a period of heightened uncertainty for analysts and policymakers.
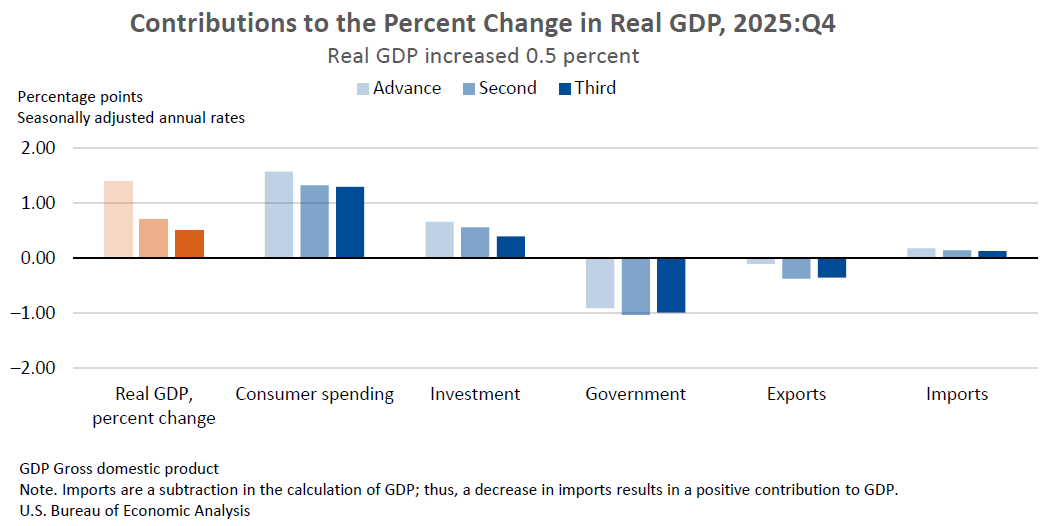
Diving deeper into the components of GDP, the modest 0.5 percent expansion in the fourth quarter was propelled by increases in consumer spending and investment. However, these positive contributions were partially offset by declines in government spending and exports. Notably, imports, which are subtracted in the calculation of GDP, decreased during the period. The revision to investment, the primary driver of the downward adjustment from the second estimate, suggests a less dynamic performance in capital expenditures than initially assessed.
GDP by Industry: A Mixed Picture
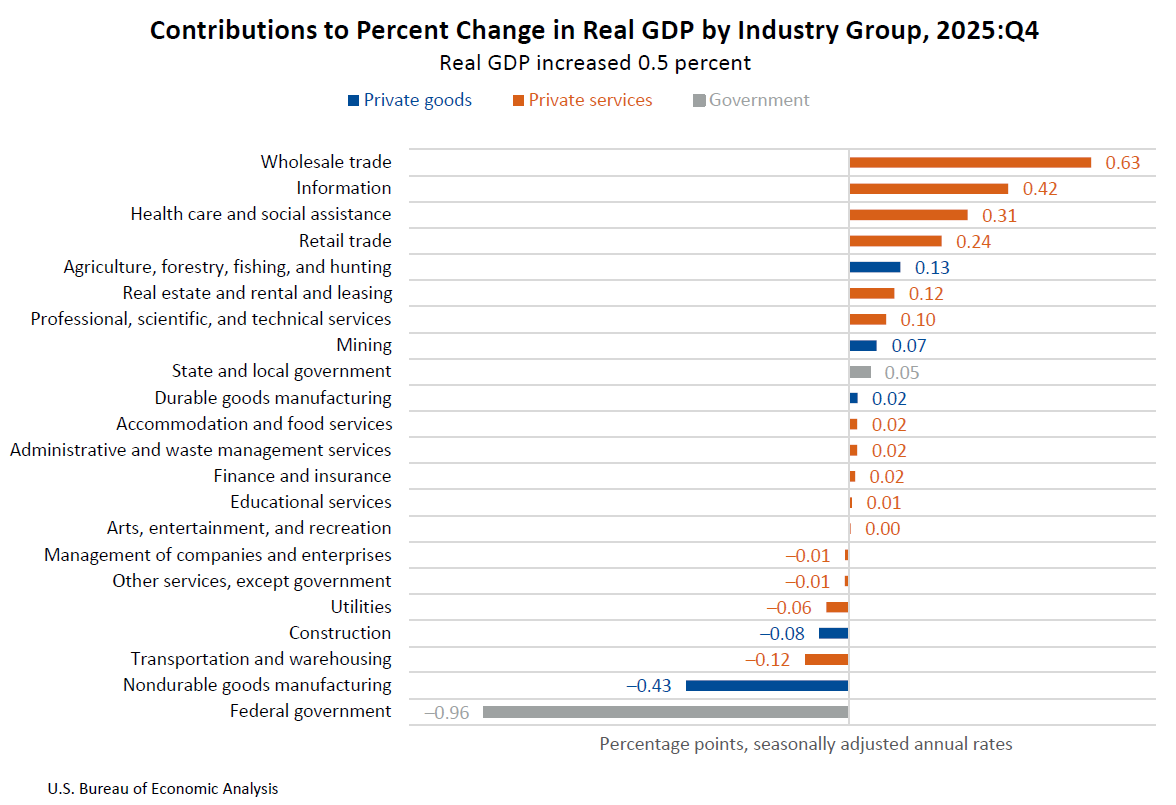
From an industry perspective, the overall increase in real GDP was largely a function of the services sector. Private services-producing industries experienced a healthy increase of 2.3 percent in their real value added. This growth was instrumental in counterbalancing contractions in other key sectors. Government-related industries, on the other hand, saw a significant decrease of 7.8 percent in their real value added, a clear reflection of the impact of the government shutdown and potentially broader fiscal retrenchment. Private goods-producing industries also registered a decline, shrinking by 1.8 percent.
Within the services sector, wholesale trade, information, and health care and social assistance emerged as the leading contributors to the overall increase in real GDP. These sectors demonstrated resilience and continued expansion, showcasing their importance in driving economic activity. The juxtaposition of robust growth in select services against contractions in government and goods production highlights the uneven nature of economic performance across different segments of the U.S. economy during the fourth quarter of 2025.
Key Economic Indicators Reflect Slowdown
Beyond the headline GDP figure, several related economic measures offer further insight into the quarter’s performance. Real final sales to private domestic purchasers, a critical gauge of demand from consumers and businesses, increased by 1.8 percent. While still positive, this figure was revised downward by 0.1 percentage point from the previous estimate, aligning with the overall trend of moderating growth.
The broad measure of real gross output, which captures the total value of goods and services produced by the economy, experienced a decrease of 0.5 percent. This contraction was driven by significant declines in private goods-producing industries (3.2 percent) and government (4.7 percent), partially mitigated by an increase of 1.1 percent in private services-producing industries.
In contrast, real gross domestic income (GDI), which measures income earned by U.S. residents and businesses, showed a more positive trend, increasing by 2.6 percent. This was a deceleration from the 3.5 percent growth observed in the third quarter. The average of real GDP and real GDI, often considered a more stable measure of economic activity, increased by 1.5 percent in the fourth quarter, down from 4.0 percent in the third quarter. This divergence between GDP and GDI can sometimes signal underlying data inconsistencies or differing trends in production versus income generation.
Corporate profits from current production, a key indicator of business health, saw a notable increase of $246.9 billion in the fourth quarter, surpassing the $175.6 billion increase recorded in the third quarter. This suggests that while overall economic growth moderated, many businesses experienced improved profitability.
The price index for gross domestic purchases, a measure of inflation for goods and services bought by U.S. residents, increased by 3.7 percent. This was a slight downward revision from the previous estimate. The personal consumption expenditures (PCE) price index, a preferred inflation gauge for the Federal Reserve, remained unchanged at 2.9 percent, with the core PCE price index (excluding food and energy) also holding steady at 2.7 percent. These figures indicate persistent inflationary pressures, though the pace of price increases showed some stabilization.
Regional Economic Performance: A Divergent Landscape
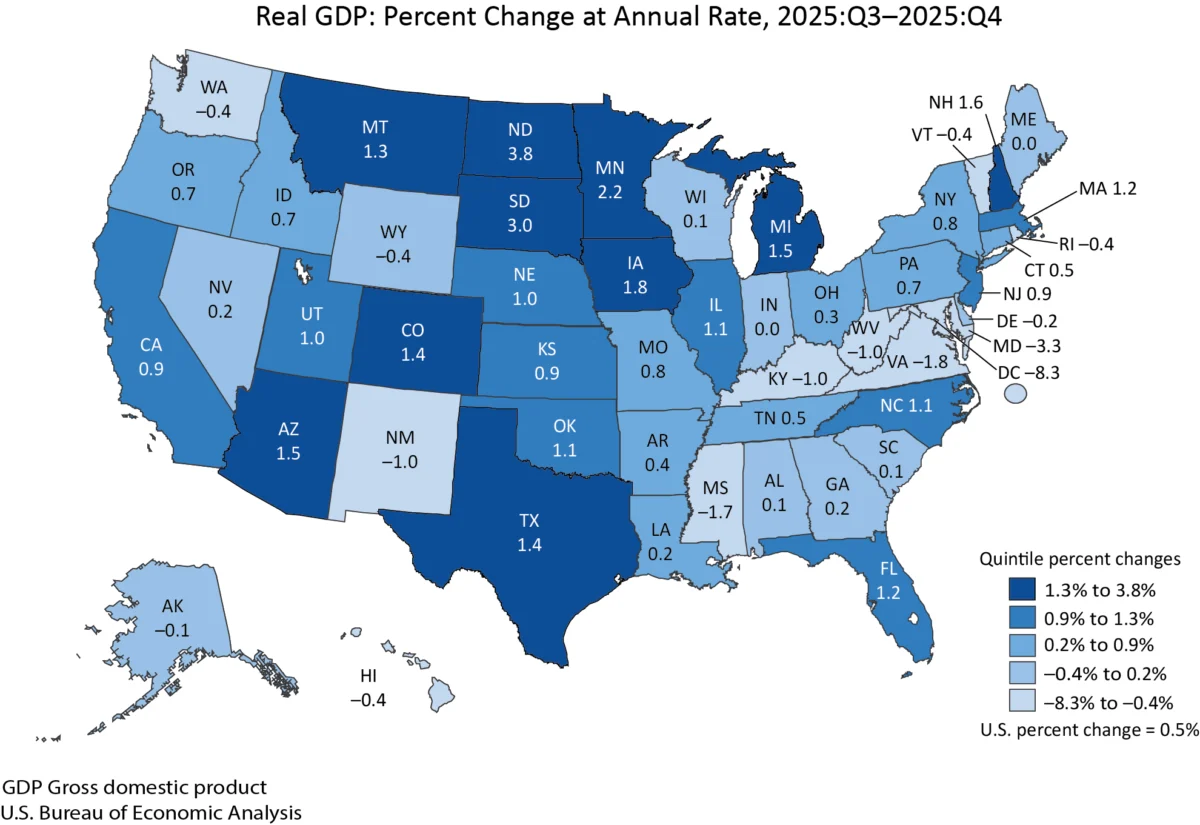
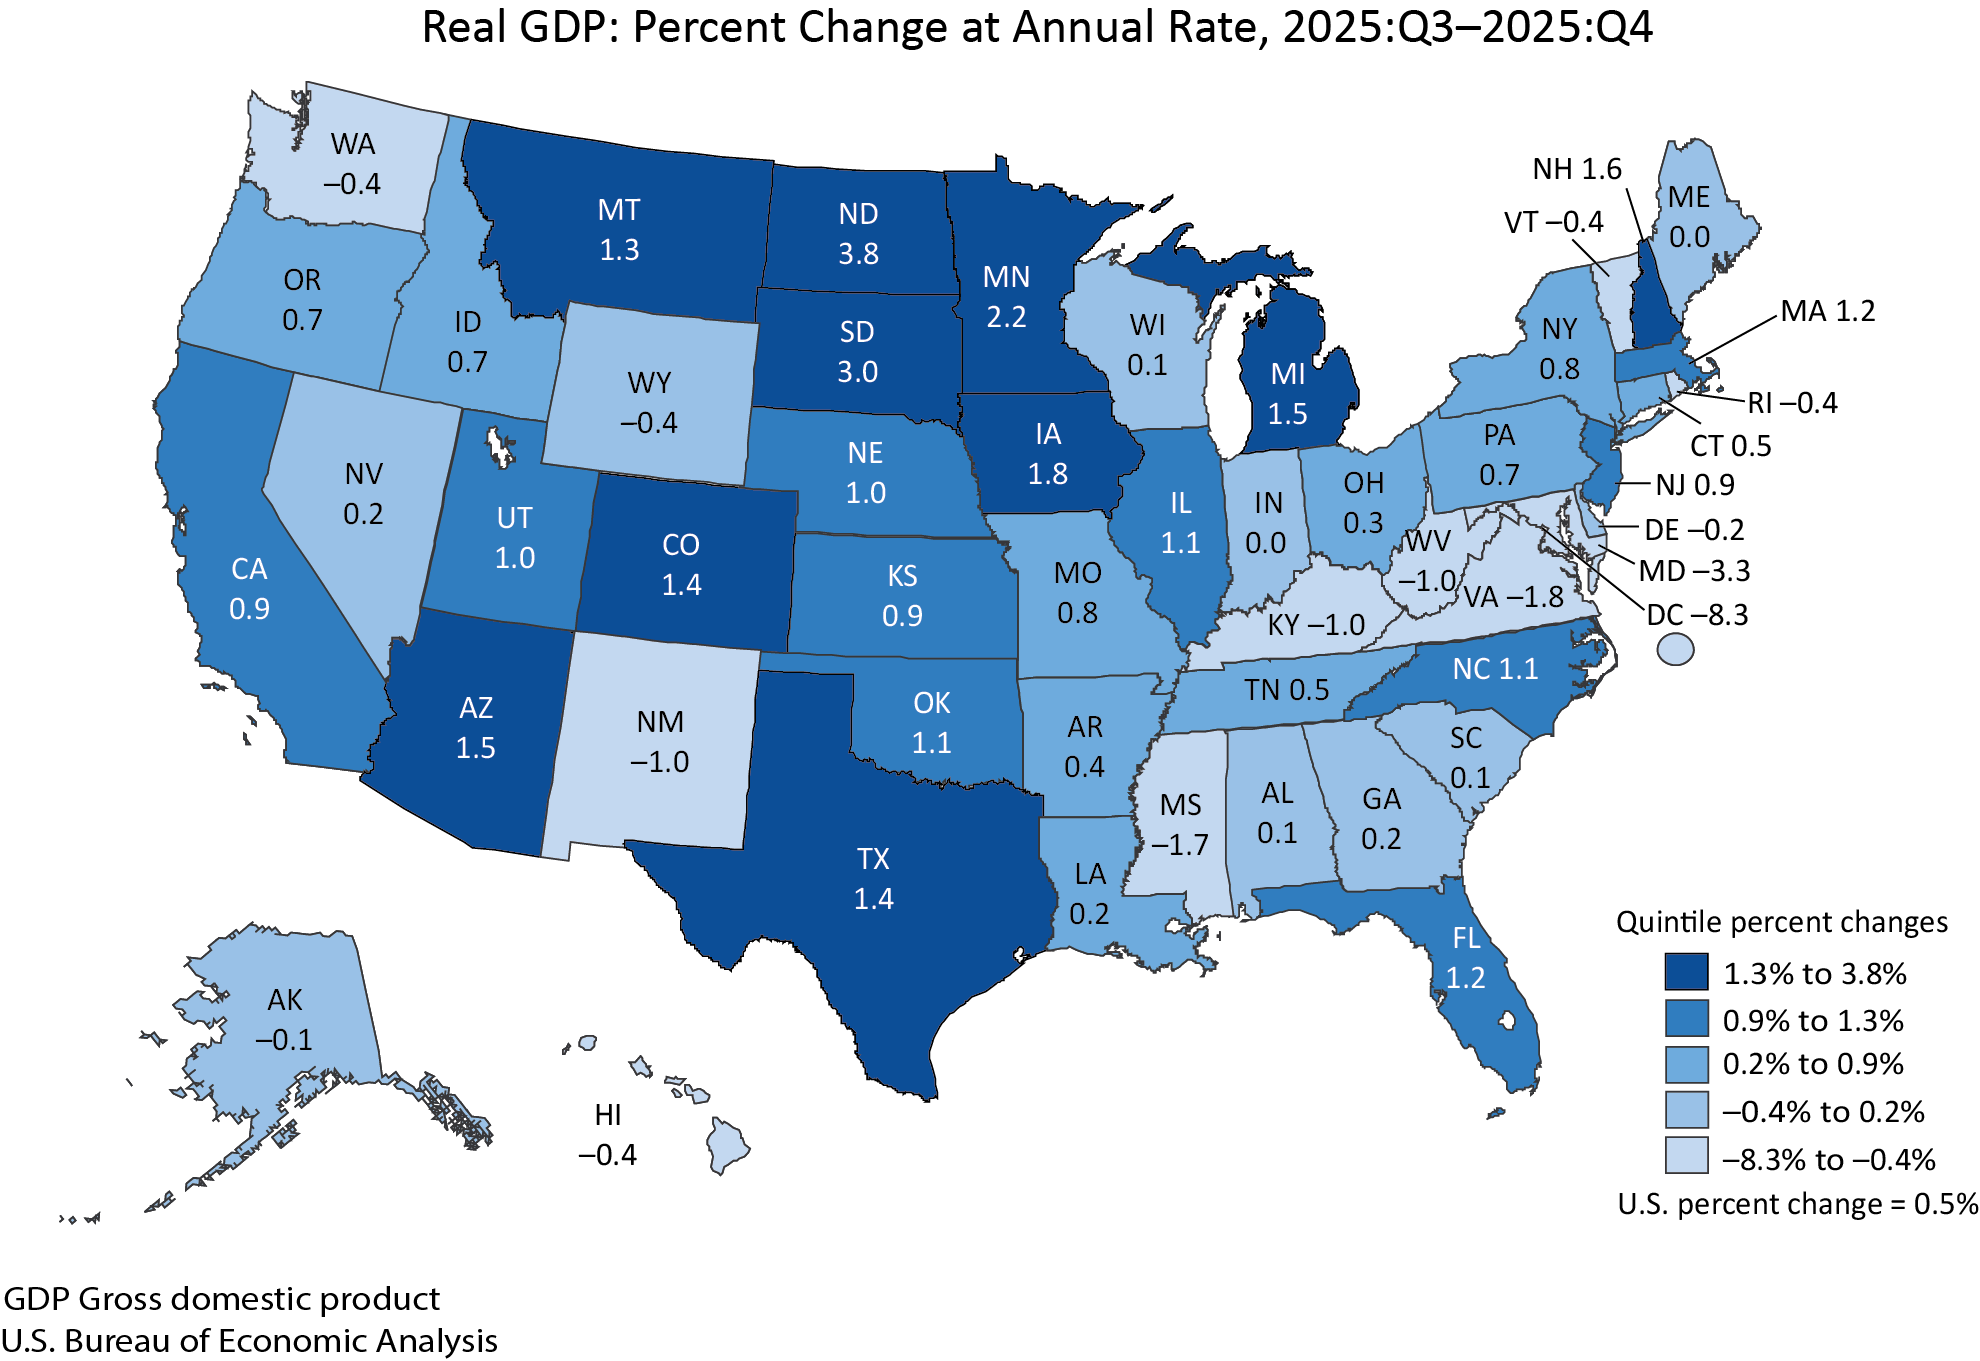
On a state-by-state basis, the economic picture in the fourth quarter of 2025 was varied. Real GDP increased in 35 states, demonstrating a broad, albeit uneven, pattern of growth. North Dakota led the nation with a robust annual growth rate of 3.8 percent, largely attributed to its agriculture, forestry, fishing, and hunting sector. Conversely, the District of Columbia experienced a significant contraction of 8.3 percent, with federal civilian activities cited as the primary drag on its economy, a direct consequence of the government shutdown. Indiana and Maine reported no change in their real GDP.
Personal Income Trends Across States
Shifting to personal income, current-dollar personal income across the nation increased by $217.9 billion, or 3.4 percent at an annual rate, in the fourth quarter. This income growth was more widely distributed than GDP growth, with 47 states and the District of Columbia reporting increases. Hawaii experienced the highest growth rate at 41.5 percent, driven significantly by a settlement paid by a domestic electric utility to households compensating for losses related to the 2023 Maui wildfire. North Dakota, however, saw a decline of 4.0 percent in personal income.
Earnings, a component of personal income reflecting compensation and proprietors’ income, increased in 43 states, with Massachusetts reporting the highest growth at 5.9 percent. North Dakota again stood out with a significant earnings decline of 7.1 percent. Personal current transfer receipts, which include government benefits, increased in 42 states and the District of Columbia, with Hawaii seeing an extraordinary surge due to the aforementioned wildfire-related settlement. Property income, encompassing dividends, interest, and rent, demonstrated broad-based strength, increasing in all 50 states and the District of Columbia.
Annual Estimates for 2025: A Steady, Moderate Pace
Looking at the full year 2025, real GDP increased by 2.1 percent, mirroring the BEA’s previous estimate. This annual growth was primarily fueled by continued increases in consumer spending and investment throughout the year. The services-producing sector continued to be a significant driver, with real value added increasing by 2.7 percent for private services-producing industries. Private goods-producing industries saw a 1.2 percent increase, while government added less than 0.1 percent.
Regionally, all 50 states and the District of Columbia experienced real GDP growth in 2025, with South Carolina and Florida leading at 3.1 percent, and North Dakota at the lower end with 0.3 percent.
The price index for gross domestic purchases rose by 2.6 percent for the full year 2025, with the PCE price index and core PCE price index also increasing by 2.6 percent and 2.8 percent, respectively. These figures indicate a year of moderate but persistent inflation.
Real GDI for the full year 2025 increased by 2.4 percent, a slight moderation from the 3.0 percent growth in 2024. The average of real GDP and real GDI for the year stood at 2.3 percent, compared to 2.9 percent in 2024, suggesting a consistent but decelerating economic expansion throughout the year.
Corporate profits from current production saw a substantial increase of $275.7 billion in 2025, an acceleration from the $184.4 billion increase in 2024, indicating a strong year for business profitability. Current-dollar personal income grew by 4.9 percent for the full year 2025, with all states and the District of Columbia reporting increases. Hawaii again showed the strongest growth at 6.9 percent, while the District of Columbia registered the lowest at 3.2 percent.
Technical Notes and Future Outlook
The BEA’s ongoing commitment to modernizing its statistical products is reflected in the enhanced GDP news release, which now features direct links to interactive data tables, streamlining access to comprehensive data. The acceleration of GDP and personal income by state data to coincide with the third GDP estimate release also provides more timely regional economic insights.
The impact of the Maui wildfire in August 2023 was also noted, with a $7.5 billion settlement related to claims of personal injury, property damage, and other losses recorded in the fourth quarter of 2025. This settlement was factored into corporate profits and recorded as business current transfer payments, offsetting the impact on GDI.
The BEA also detailed its methodology for deriving price indexes during the October 2025 data collection period, which was affected by the federal government shutdown. Imputed price indexes were used for October, leveraging the geometric mean of September and November data, and adjusted with historical seasonal factors.
Looking ahead, the next release from the BEA is scheduled for April 30, 2026, at 8:30 a.m. EDT, providing the advance estimate for real GDP in the first quarter of 2026. This will offer the first glimpse into the economic trajectory as the nation moves further into the new year, with continued attention on inflation, consumer spending, and the ongoing effects of policy decisions and global economic dynamics.


