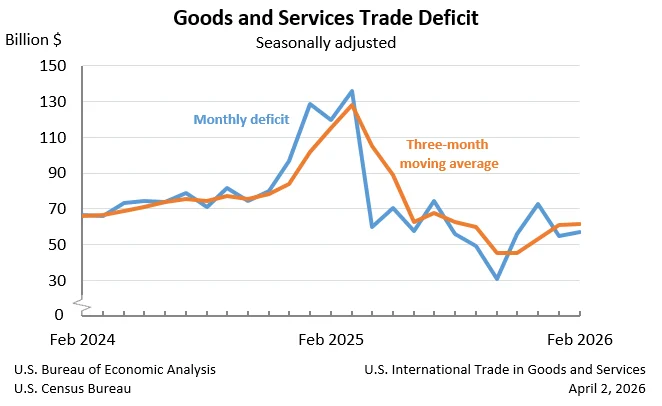
The United States recorded a goods and services deficit of $57.3 billion in February, an increase of $2.7 billion from the revised January figure of $54.7 billion. This widening of the trade gap, announced jointly by the U.S. Census Bureau and the U.S. Bureau of Economic Analysis, reflects simultaneous growth in both exports and imports, with import values outstripping export gains.
February Trade Performance: A Closer Look
In February, U.S. exports reached $314.8 billion, marking a $12.6 billion increase from the previous month. Imports, however, saw a larger rise, climbing $15.2 billion to $372.1 billion. This differential directly contributed to the expansion of the overall deficit. Breaking down the components, the goods deficit widened by $2.5 billion to $84.6 billion, while the services surplus experienced a modest decrease of $0.2 billion, settling at $27.3 billion.
The data, adjusted for seasonal variations but not for price changes, indicates a dynamic interplay between international demand for American products and services and American consumption of foreign goods and services. The growth in exports suggests resilience in global demand for U.S. offerings, while the even stronger growth in imports points to robust domestic demand and potentially supply chain dynamics influencing the flow of goods.
Year-to-Date Trends Show Significant Improvement
Despite the month-over-month increase in the deficit, a broader year-to-date perspective reveals a substantially improved trade balance compared to the same period in 2025. For the year thus far, the goods and services deficit has decreased by an impressive $136.1 billion, a reduction of 54.8 percent from the comparable period in the previous year. This significant improvement is attributed to a substantial increase in exports, which have grown by $62.6 billion or 11.3 percent, and a notable decrease in imports, which have fallen by $73.5 billion or 9.2 percent. This contrast between short-term fluctuations and longer-term trends highlights the complex nature of trade data and the influence of various economic factors on monthly and annual figures.
Three-Month Moving Averages: Smoothing Out Volatility
To provide a more stable picture and mitigate the impact of monthly volatilities, the report also presents three-month moving averages. For the three months ending in February, the average goods and services deficit stood at $61.6 billion, an increase of $0.4 billion from the preceding three-month period. On a year-over-year basis, however, the average goods and services deficit has shown a considerable decrease, shrinking by $53.4 billion compared to the three months ending in February 2025. This indicates that while February’s monthly data showed a widening gap, the underlying trend over a longer period remains one of deficit reduction.
Detailed Breakdown: Exports and Imports
Digging deeper into the components of trade, exports of goods saw a significant rise of $11.5 billion in February, reaching $206.9 billion. This increase, calculated on a Census basis, was also reflected in net balance of payments adjustments, which grew by less than $0.1 billion. Simultaneously, exports of services also contributed positively, increasing by $1.1 billion to $107.9 billion.
On the import side, goods imports experienced a substantial increase of $14.0 billion, bringing the total to $291.5 billion. Imports of goods on a Census basis rose by $14.1 billion, with a slight decrease of $0.1 billion in net balance of payments adjustments. Services imports also saw an uptick, rising by $1.3 billion to $80.6 billion.
Real Goods Deficit: Adjusting for Inflation
When accounting for inflation by examining "real goods" in 2017 dollars on a Census basis, the deficit in February increased by $0.5 billion, or 0.6 percent, to $83.5 billion. This growth in the real goods deficit was less pronounced than the 3.2 percent increase observed in the nominal deficit, suggesting that a portion of the nominal increase was driven by rising prices rather than solely by increased volumes.
Trade Balances with Key Partners
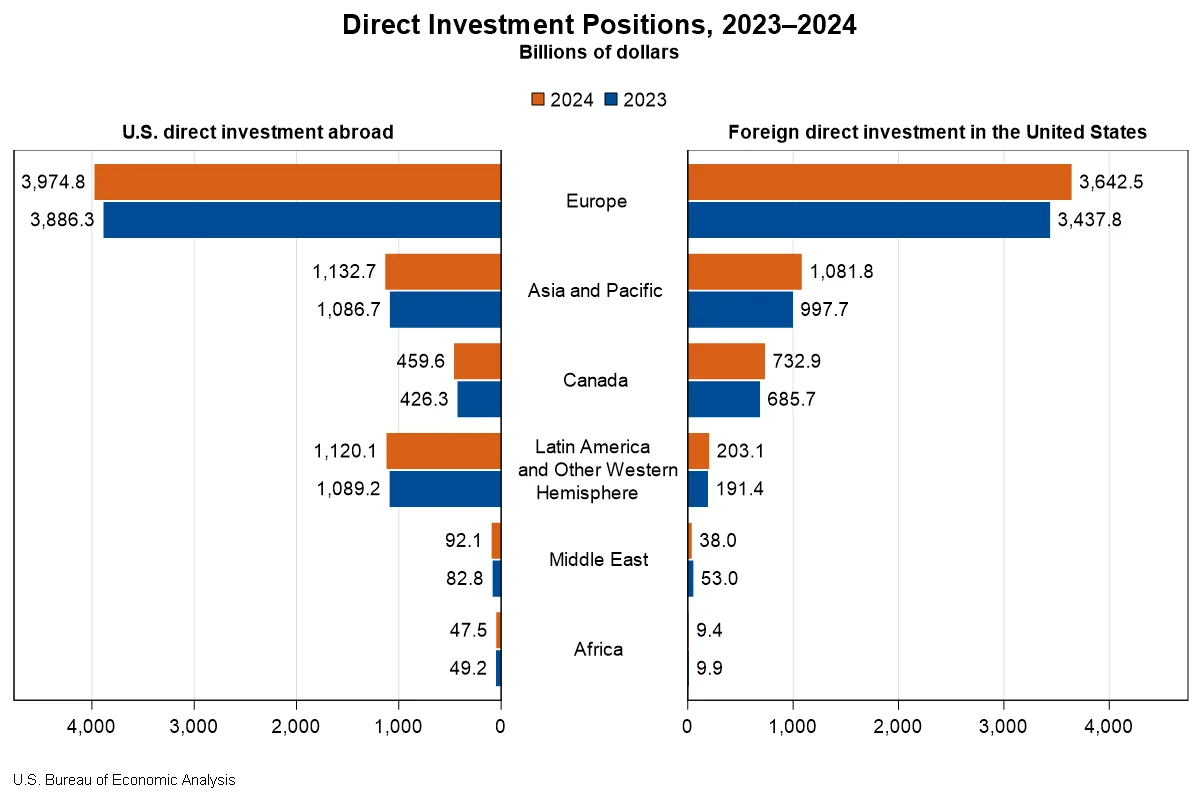
The monthly report also provides insights into trade balances with specific countries and regions. In February, the U.S. recorded trade surpluses with several nations, including Switzerland ($7.8 billion), the Netherlands ($6.8 billion), Hong Kong ($6.6 billion), the United Kingdom ($5.6 billion), and South and Central America ($3.8 billion). Notable surpluses were also observed with Singapore ($2.9 billion), Brazil ($1.4 billion), Australia ($0.9 billion), Belgium ($0.8 billion), and Saudi Arabia ($0.2 billion).
Conversely, significant trade deficits were reported with Taiwan ($21.1 billion), Mexico ($16.8 billion), Vietnam ($16.5 billion), China ($13.1 billion), and South Korea ($7.6 billion). The U.S. also maintained deficits with the European Union ($5.1 billion), Japan ($4.7 billion), Malaysia ($4.0 billion), India ($3.5 billion), Germany ($3.3 billion), Ireland ($2.8 billion), France ($2.2 billion), Italy ($1.8 billion), Israel ($0.8 billion), and Canada ($0.7 billion). These figures illustrate the diverse nature of U.S. trade relationships and highlight areas where the U.S. is a net importer.
Context and Background: Understanding Trade Deficits
The U.S. international trade in goods and services deficit is a key economic indicator that measures the difference between the value of goods and services exported and the value of goods and services imported by the United States. A deficit means the U.S. is importing more than it is exporting, which can have various economic implications.
Historically, the U.S. has experienced persistent trade deficits, particularly in goods, driven by factors such as strong consumer demand, the globalization of supply chains, and the role of the U.S. dollar as a global reserve currency. The services sector, on the other hand, has often seen a surplus for the U.S., driven by strong performance in areas like financial services, tourism, and intellectual property.
The fluctuations observed in monthly trade data can be influenced by a multitude of factors, including global economic growth, exchange rates, geopolitical events, trade policies, seasonal demand patterns, and temporary supply chain disruptions. The joint release by the Census Bureau and the Bureau of Economic Analysis ensures that the data is compiled and presented with a high degree of accuracy and methodological rigor.
Upcoming Revisions and Data Updates
The U.S. Census Bureau and the Bureau of Economic Analysis also announced upcoming significant revisions to international trade statistics. With the release of the "U.S. International Trade in Goods and Services" report (FT-900) and the FT-900 Annual Revision on June 9, 2026, statistics on trade in goods, on both a Census basis and a balance of payments (BOP) basis, will be revised beginning with 2021. Similarly, statistics on trade in services will be revised starting from 1999.
These comprehensive revisions are standard practice in economic statistics and are designed to incorporate new source data, refine methodologies, and ensure the continued accuracy and relevance of the data. The revised statistics for goods on a BOP basis and for services will also be integrated into other key BEA reports, including the "U.S. International Transactions and Investment Position, 1st Quarter 2026 and Annual Update" report and BEA’s Interactive Data Application, both scheduled for release by BEA on June 24, 2026.
Revised statistics on trade in goods are expected to reflect updates related to merchandise trade, customs data, and other source data that impact valuation and coverage. For services, revisions will incorporate updated source data for various service categories, ensuring a more accurate reflection of cross-border service transactions. A preview of BEA’s 2026 annual update of the International Transactions Accounts will be made available in the Survey of Current Business later in April 2026.
Analytical Implications and Broader Economic Context
The widening of the U.S. trade deficit in February, while concerning in the short term, needs to be viewed within the broader economic landscape. The simultaneous increase in both exports and imports suggests a healthy level of economic activity. A rising deficit can, in some contexts, indicate strong domestic demand that outstrips domestic production capacity, leading to increased imports. It can also reflect a strengthening of the U.S. dollar, making imports cheaper and exports more expensive.
However, a persistent and significantly large trade deficit can also raise concerns about national debt, the competitiveness of domestic industries, and potential vulnerabilities in the economy. The decrease in the year-to-date deficit is a positive sign, indicating that efforts to boost exports and manage import growth may be yielding results over a longer horizon.
Economists and policymakers will be closely monitoring future trade reports to assess whether the February trend represents a temporary anomaly or the beginning of a new pattern. Factors such as global economic stability, trade agreements, and domestic economic policies will play a crucial role in shaping future trade balances. The upcoming comprehensive revisions to trade data will also provide a more refined understanding of past trade performance, potentially offering new insights into long-term trends and underlying economic drivers.
The U.S. Census Bureau and the U.S. Bureau of Economic Analysis will release the next report on U.S. International Trade in Goods and Services, covering March 2026 data, on May 5, 2026. This forthcoming report will provide further data points to analyze the trajectory of U.S. trade performance in the coming months.