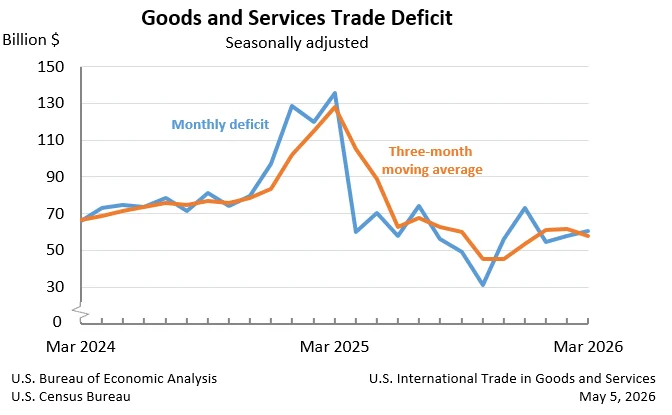
The United States experienced a widening of its goods and services deficit in March, reaching $60.3 billion, a notable increase of $2.5 billion from the revised $57.8 billion recorded in February. This shift underscores ongoing dynamics in international trade, with imports outpacing exports, particularly in the goods sector. The U.S. Census Bureau and the U.S. Bureau of Economic Analysis jointly released these figures on May 5, 2026, providing a snapshot of the nation’s economic engagement with the rest of the world.
Key Trade Figures for March 2026
In March, total U.S. exports of goods and services amounted to $320.9 billion, marking a 2.0% increase from the previous month. This rise was primarily driven by an increase in goods exports, which grew by $6.2 billion on a Census basis, supplemented by a $0.3 billion uptick in net balance of payments adjustments. However, exports of services saw a slight decrease of $0.3 billion, settling at $107.4 billion.
Conversely, imports of goods and services climbed to $381.2 billion, a 2.3% increase compared to February. The surge in imports was predominantly fueled by a substantial rise in goods imports, which jumped by $10.2 billion on a Census basis, with an additional $0.4 billion attributed to net balance of payments adjustments. Imports of services, however, experienced a contraction, decreasing by $1.9 billion to $79.0 billion.
Breakdown of the Deficit
The overall widening of the goods and services deficit in March was a result of conflicting movements in the trade of goods and services. The deficit in goods widened by $4.1 billion to reach $88.7 billion. This deterioration in the goods balance was partially offset by an improvement in the services surplus, which increased by $1.6 billion to stand at $28.4 billion. This indicates that while the U.S. continues to generate a surplus in its services trade, the growing deficit in goods is the primary driver behind the overall trade imbalance.
Year-to-Date Trends and Context
Looking at the broader economic picture, the year-to-date figures for the goods and services deficit present a contrasting narrative. For the period ending in March, the cumulative goods and services deficit decreased by $211.2 billion, representing a significant 55.0% reduction compared to the same period in 2025. This substantial improvement is attributed to a robust 12.0% increase in exports, totaling $100.2 billion, coupled with a notable 9.1% decrease in imports, which fell by $111.0 billion. This suggests that the first few months of 2026 had seen a more favorable trade environment, likely influenced by various global economic factors and domestic policy initiatives aimed at bolstering exports and managing import levels.
Three-Month Moving Averages Offer Smoother Perspective
To provide a less volatile view of trade trends, the report also analyzes three-month moving averages. For the three months ending in March, the average goods and services deficit saw a decrease of $4.2 billion, settling at $57.6 billion. On a year-over-year basis, this average deficit showed a substantial reduction of $70.4 billion when compared to the three months ending in March 2025. This trend in moving averages reinforces the notion of an improving overall trade balance in the initial part of 2026, despite the monthly uptick in March.
Deeper Dive into Goods and Services Trade
Goods Trade Dynamics
The increase in goods imports by $10.6 billion in March to $302.2 billion was a significant contributor to the widening deficit. This rise suggests increased consumer and business demand for foreign-made products, or potential supply chain adjustments that led to higher import volumes. The corresponding increase in goods exports, by $6.5 billion to $213.5 billion, indicates that American producers are also seeing greater demand for their goods internationally, though not enough to offset the import growth.
Services Trade Performance
While the goods sector contributed to the deficit’s expansion, the services sector continued to exhibit strength, albeit with a slight dip in March. The decrease in services imports by $1.9 billion to $79.0 billion, while exports also fell by $0.3 billion to $107.4 billion, resulted in a larger services surplus. This highlights the ongoing resilience of U.S. services exports, which include sectors like financial services, intellectual property, and tourism, demonstrating a continued competitive advantage in these areas.
Real Goods Deficit Shows Greater Inflationary Impact
The report also provides insights into the "real" goods deficit, adjusted for price changes. The real goods deficit, measured in 2017 dollars on a Census basis, increased by $5.7 billion, or 6.7%, to $90.8 billion in March. This represents a faster rate of increase than the nominal deficit, suggesting that inflation may have played a role in the overall widening of the goods deficit, as the value of imports increased more significantly than the value of exports after accounting for price fluctuations.
Trade Balances with Key Partners
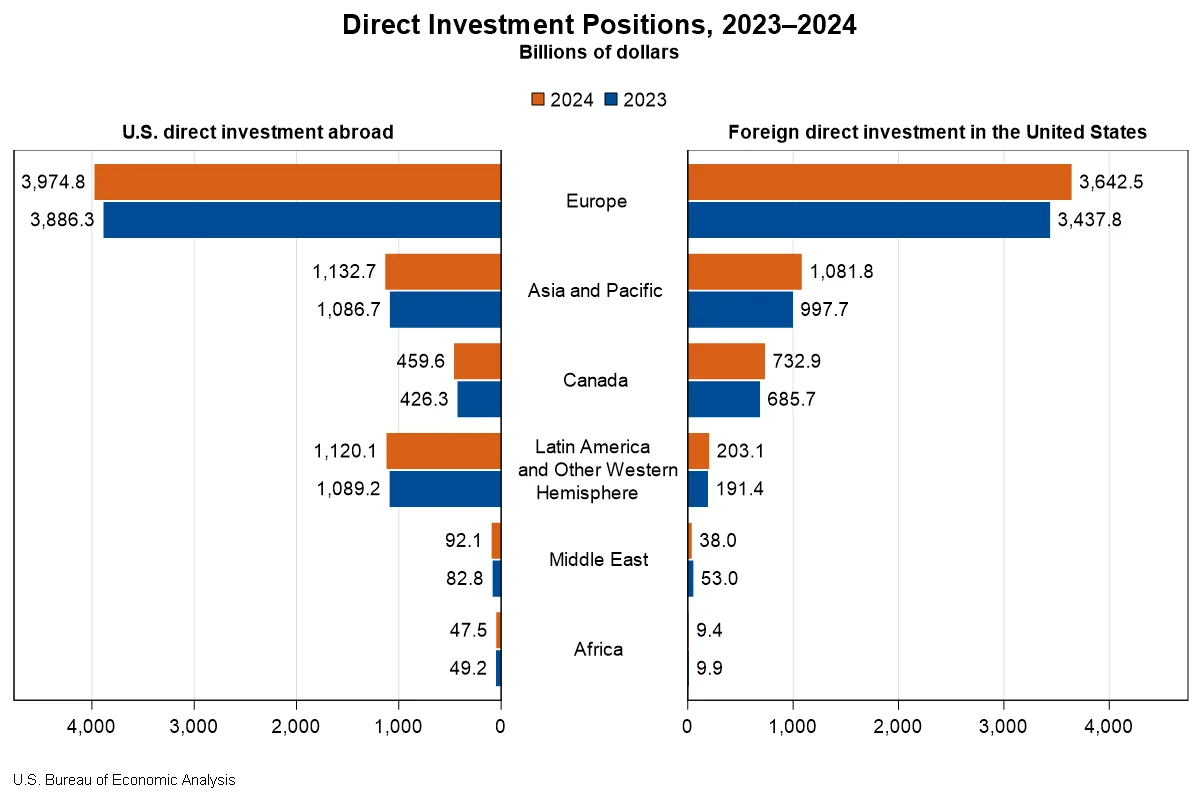
The March trade figures also provide a detailed look at the U.S. balance of trade with specific countries and regions. The U.S. recorded trade surpluses with several key partners, including the Netherlands ($7.4 billion), the United Kingdom ($6.1 billion), Hong Kong ($5.8 billion), and South and Central America ($5.0 billion). Surpluses were also noted with Switzerland ($4.3 billion), Australia ($2.2 billion), Singapore ($1.9 billion), Brazil ($1.4 billion), and Belgium ($0.6 billion).
Conversely, significant trade deficits persisted with several major economies. Taiwan led with a deficit of $20.6 billion, followed by Vietnam ($19.2 billion), Mexico ($16.4 billion), and China ($14.0 billion). The European Union as a whole represented a deficit of $9.2 billion, with notable individual country deficits including Germany ($5.0 billion), South Korea ($4.8 billion), and Japan ($4.1 billion). Other countries with recorded deficits included Malaysia ($4.0 billion), India ($3.8 billion), Canada ($3.6 billion), Ireland ($2.9 billion), Italy ($2.3 billion), Saudi Arabia ($0.7 billion), and Israel ($0.4 billion). These figures underscore the complex and varied nature of U.S. trade relationships across the globe, with concentrated deficits in certain manufacturing hubs and surpluses in others.
Revisions and Future Outlook
The report also detailed revisions to February’s trade data, indicating adjustments to both exports and imports from the previously reported figures. These revisions are a standard part of economic data reporting, aimed at ensuring the highest degree of accuracy.
Looking ahead, the U.S. Census Bureau and BEA announced upcoming significant updates to international trade statistics. On June 9, 2026, the FT-900 report and its annual revision will incorporate revised trade data for goods on both a Census and balance of payments (BOP) basis, with revisions dating back to 2021. Services trade statistics will also be revised from 1999 onwards. These comprehensive revisions are expected to provide a more refined understanding of historical trade patterns and their impact on the U.S. economy. Further details on these revisions will be available in the "Preview of the 2026 Annual Update of the International Economic Accounts" in the Survey of Current Business.
The next release of the U.S. International Trade in Goods and Services report, covering April 2026 data, is scheduled for June 9, 2026. This upcoming report will provide the latest figures and continue to offer critical insights into the evolving landscape of global commerce for the United States.
Broader Economic Implications
The widening of the trade deficit in March, while a monthly fluctuation, is part of a larger economic narrative. A persistent and growing trade deficit can have several economic implications. It can signal that a country is consuming more than it produces, potentially leading to increased foreign debt. It can also affect domestic industries, as higher imports can compete with domestically produced goods, potentially impacting employment and manufacturing output.
However, the context of the year-to-date data and the three-month moving averages suggests that the March figures might represent a temporary divergence from a generally improving trend in the U.S. trade balance for the early part of 2026. Factors such as global demand, exchange rates, commodity prices, and geopolitical events all play a crucial role in shaping these trade flows. The strong performance in services exports, for instance, continues to be a bright spot for the U.S. economy, helping to cushion the impact of the goods deficit.
The detailed breakdown of trade with individual countries also highlights the importance of bilateral trade relationships. Persistent deficits with certain nations may lead to policy discussions and trade negotiations aimed at rebalancing these economic ties. The U.S. administration and its economic advisors will likely continue to monitor these figures closely, using them to inform trade policy, economic development strategies, and international economic engagement. The upcoming comprehensive revisions to trade data will provide an even more robust foundation for understanding these long-term trends and their implications for U.S. economic prosperity.