The U.S. Bureau of Economic Analysis (BEA) today unveiled its latest annual statistics, providing a detailed snapshot of the nation’s economic landscape at the state level for 2024. This comprehensive release includes critical data on real personal consumption expenditures (PCE), real personal income, and regional price parities (RPPs) across all 50 states and the District of Columbia. The newly released figures offer insights into the varying economic vitality and cost of living across the United States, reflecting a period of economic adjustment and differing regional growth trajectories.
Key Findings: Real Personal Consumption Expenditures Showcase Broad Growth
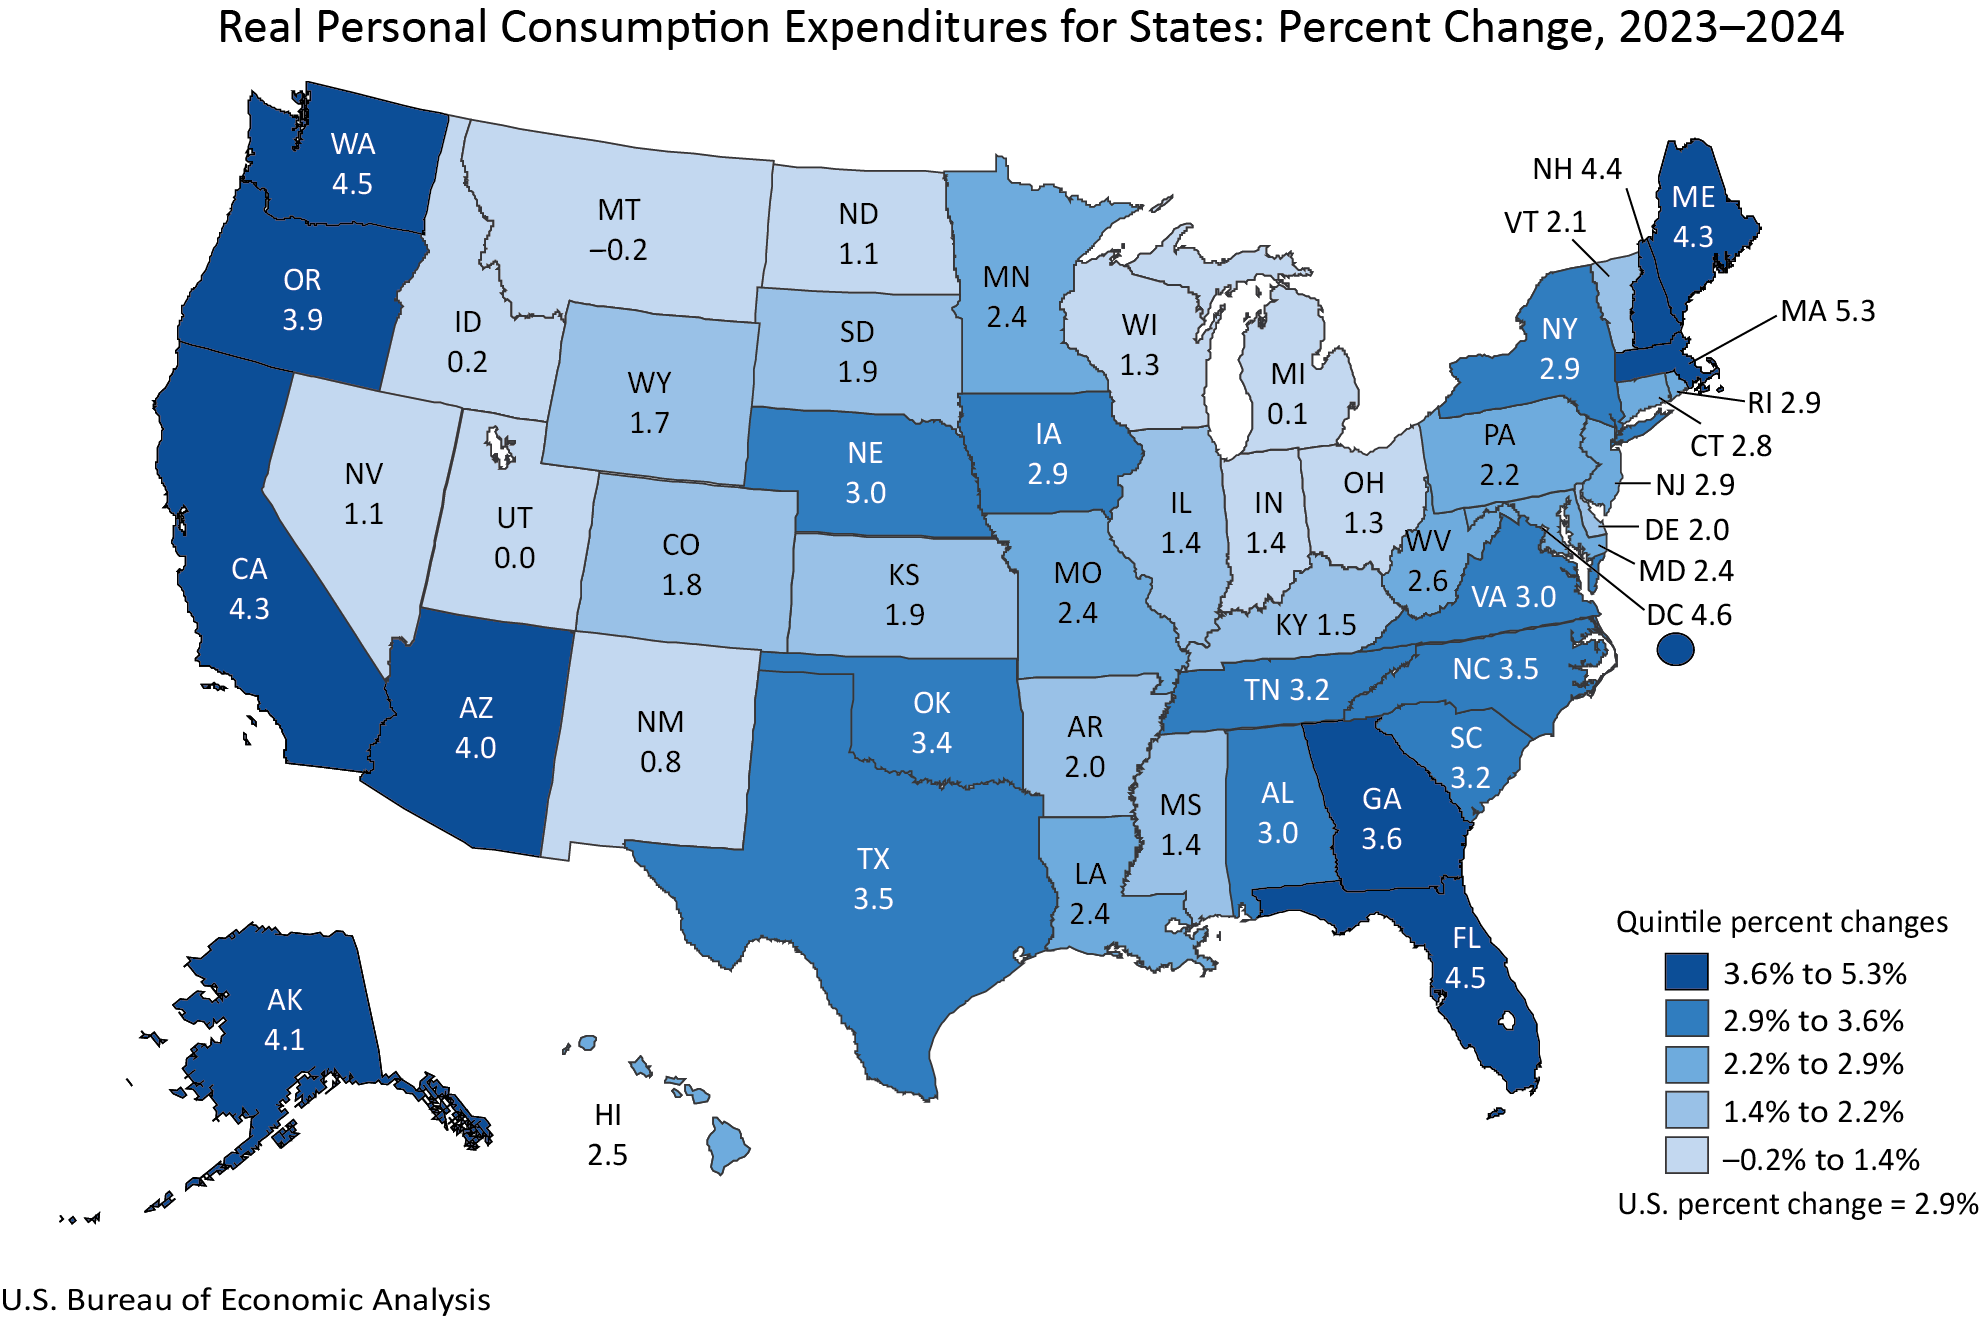
The data reveals a widespread increase in real personal consumption expenditures, a key indicator of consumer spending adjusted for inflation. In 2024, 48 states and the District of Columbia experienced growth in real PCE. The extent of this growth varied significantly, with Massachusetts leading the nation at a robust 5.3 percent increase. This surge in consumer spending in Massachusetts suggests a strong economic environment, potentially driven by factors such as high employment, wage growth, and robust consumer confidence in the state.
Conversely, Montana recorded a slight decrease of -0.2 percent in real PCE. While a minor contraction, it stands in contrast to the broader national trend of expansion. This localized dip could be attributed to a variety of factors, including seasonal economic fluctuations, specific industry performance, or demographic shifts within the state.
Nationally, real PCE saw an increase of 2.9 percent in 2024. This figure is particularly noteworthy when compared to the national PCE price index, which rose by 2.6 percent. The fact that real PCE outpaced inflation indicates that consumers were able to purchase more goods and services in real terms. Current-dollar PCE, which reflects nominal spending, surged by 5.6 percent nationwide. This disparity between current-dollar and real PCE underscores the impact of inflation on the purchasing power of consumers, even as overall spending increased.
The BEA’s methodology for calculating real PCE involves adjusting current-dollar estimates by the corresponding regional price parity (RPP) and the national PCE price index. RPPs are crucial for understanding the true purchasing power of consumer spending across different regions, as they account for variations in the cost of goods and services.
Real Personal Income Trends: A Mixed Economic Picture
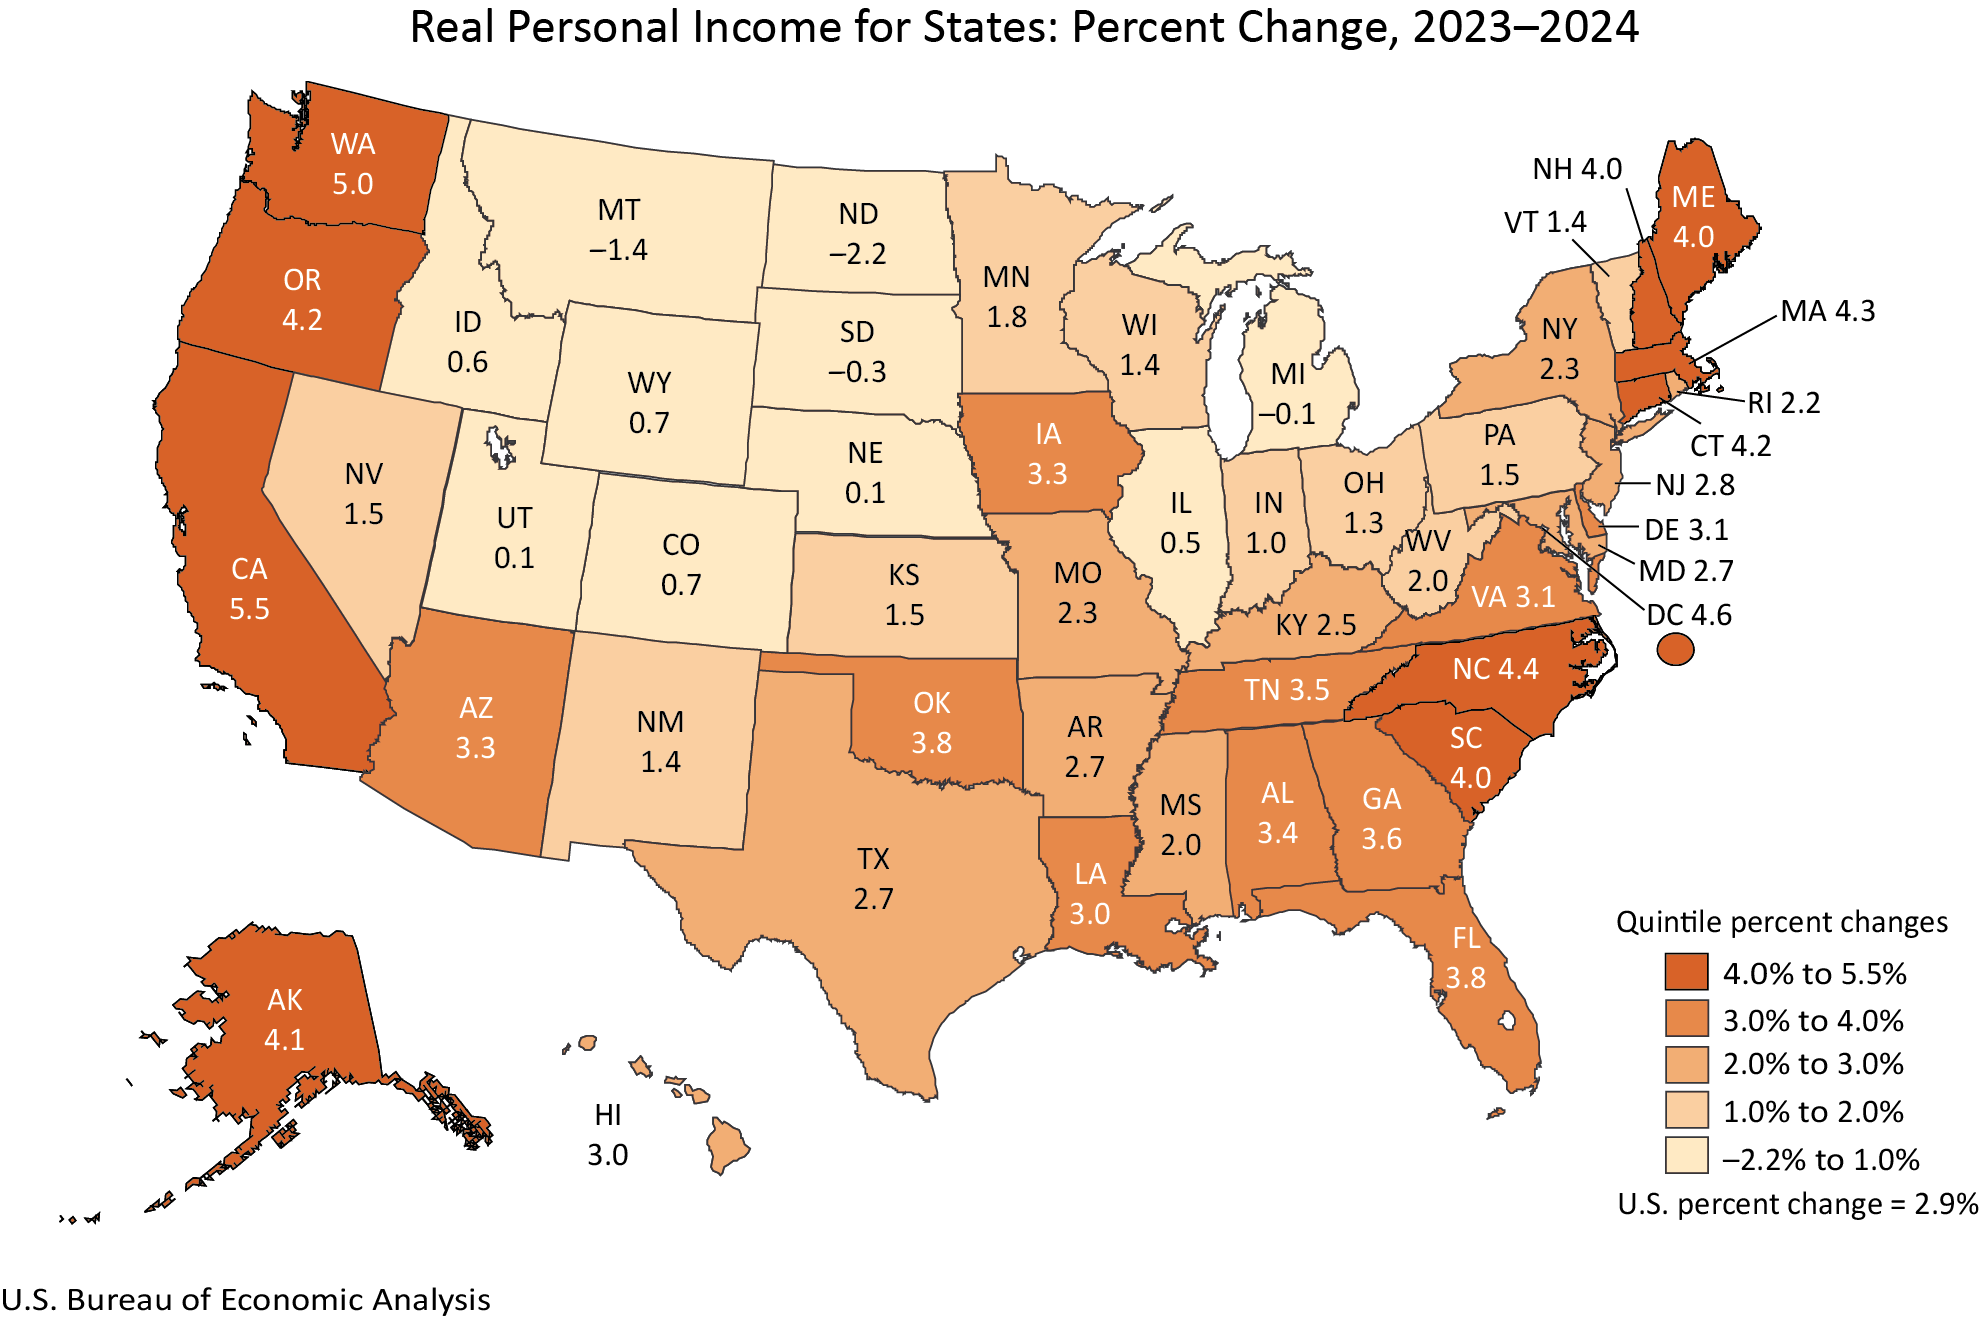
The release also highlights trends in real personal income, another vital measure of economic well-being. In 2024, real personal income grew in 46 states and the District of Columbia, indicating a generally positive trend in individuals’ purchasing power after accounting for inflation.
California emerged as a leader in real personal income growth, with an impressive increase of 5.5 percent. This strong performance suggests a thriving economic environment in the Golden State, likely supported by its diverse economy, technological innovation, and significant labor market demand.
In contrast, North Dakota experienced a decline of -2.2 percent in real personal income. This contraction, while more pronounced than Montana’s PCE decrease, points to potential economic challenges within the state. Factors such as fluctuations in commodity prices, shifts in key industries, or specific regional economic policies could be contributing to this downturn.
Nationally, real personal income rose by 2.9 percent in 2024, mirroring the growth in real PCE. Similar to consumption expenditures, current-dollar personal income saw a more substantial increase of 5.6 percent nationally. This difference again emphasizes the inflationary pressures affecting the real value of income. The BEA’s calculation of real personal income involves adjusting current-dollar personal income by the RPP and the national PCE price index, ensuring that regional price differences are factored into the assessment of individuals’ economic standing.
Regional Price Parities: Unpacking Cost of Living Differences
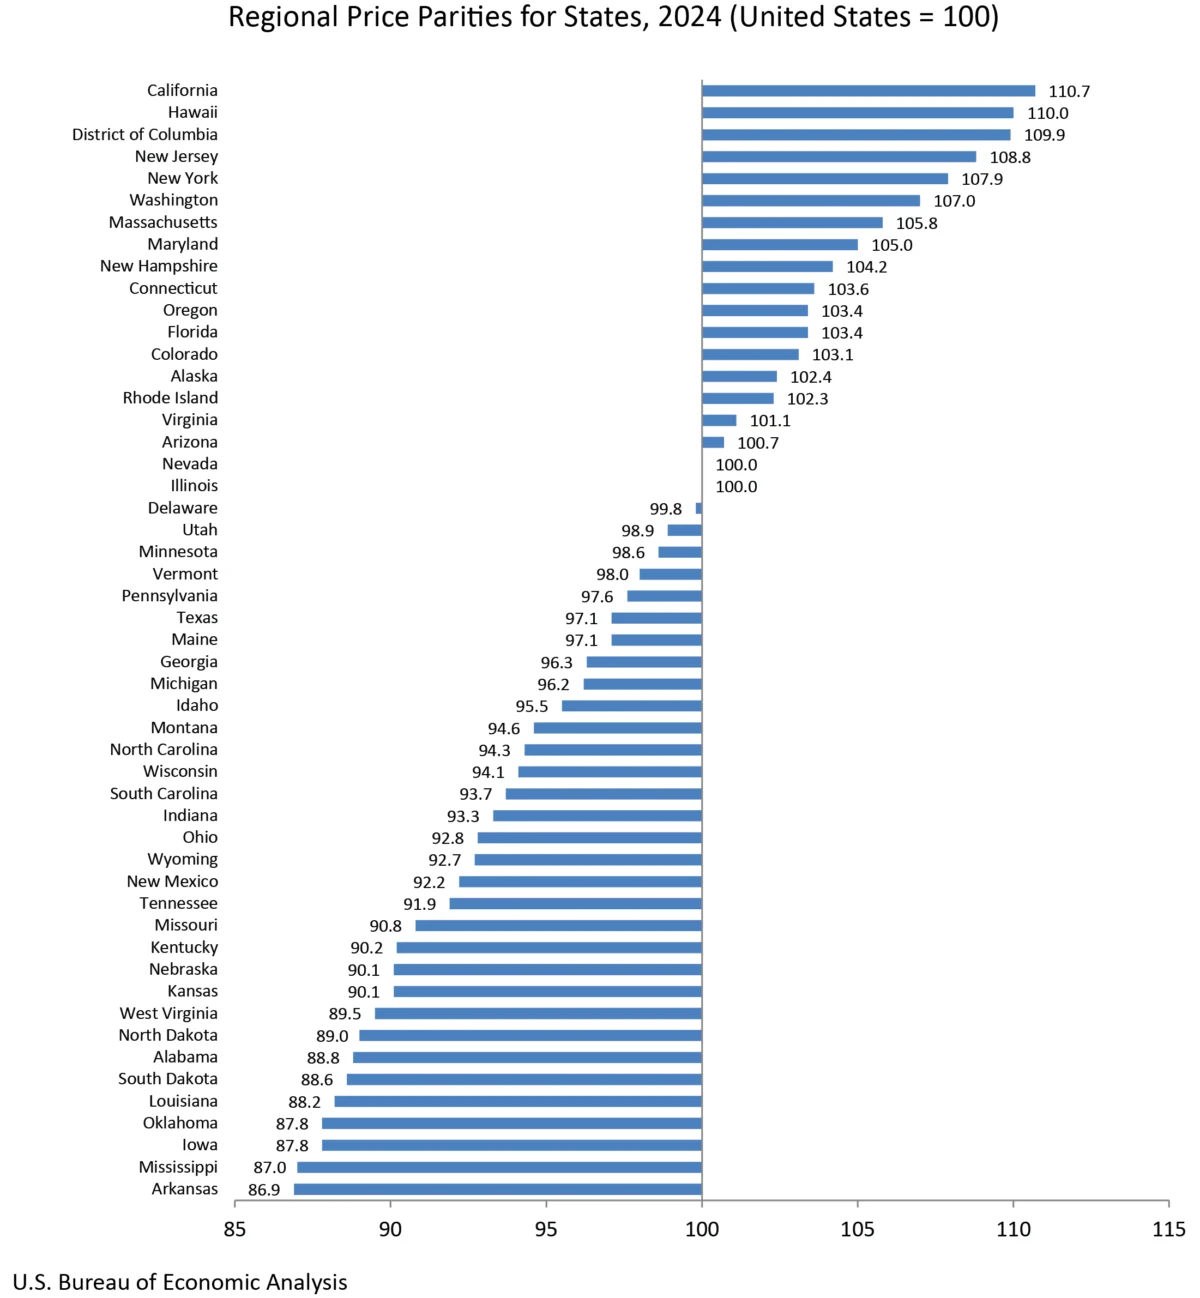
A significant component of the BEA’s release is the data on Regional Price Parities (RPPs). RPPs are essential for understanding the cost of living across different states, measuring the price level differences for a given year relative to the national average. An RPP of 100 represents the national price level.
The "all items RPP" encompasses all consumption goods and services, with a particular emphasis on housing rents. The data indicates that housing costs are frequently a primary driver of RPP variations among states. For instance, states with high housing costs typically exhibit higher RPPs, meaning that a given amount of money buys less in those areas compared to states with lower housing expenses.
While specific state-by-state RPP figures for 2024 are detailed in the BEA’s interactive data application, the general trend is that states with higher overall costs of living will show higher RPPs. This data is critical for policymakers, businesses, and individuals alike in understanding the true economic landscape and making informed decisions about resource allocation, investment, and personal finance.
Revisions and Methodological Updates
The release of the 2024 data is accompanied by significant revisions to annual estimates of real PCE and real personal income by state, extending back to 2008. These revisions are a standard practice for the BEA, incorporating more comprehensive and detailed source data that becomes available over time. This process ensures the accuracy and reliability of the statistics, aligning them with updates to broader national economic accounts, such as the National Income and Product Accounts (NIPA) and Gross Domestic Product (GDP) by industry.
Furthermore, the BEA has introduced new estimates for real per capita PCE and real per capita personal income for 2024. These per capita figures are derived using population data from the U.S. Census Bureau, offering a measure of economic well-being on an individual basis. The inclusion of per capita data from 2020 through 2024 provides a valuable lens through which to analyze economic trends in the context of population changes.
Discontinuation of Metropolitan Area Statistics
In a notable change to its reporting practices, the BEA has discontinued the publication of statistics for metropolitan statistical areas and their constituent metropolitan and nonmetropolitan portions for real PCE and real personal income. While state-level data will continue to be published, the granular breakdowns at the metropolitan level will no longer be provided in these specific releases. RPPs will continue to be published for both state and local areas, offering some continued geographical detail. This decision aims to streamline reporting and focus resources on core state-level economic indicators.
Enhanced Data Accessibility and Presentation
The BEA has also updated its data presentation, moving away from including tables directly within news releases. Instead, users are now directed to the BEA’s online Interactive Data Application via embedded links. This application offers more flexibility and comprehensiveness, allowing users to customize tables, access full time series, and download data in various formats, including PDF, Excel, and CSV. This shift is intended to reduce duplication, improve efficiency, and provide users with direct access to the most up-to-date and adaptable data tools.
Broader Implications and Future Outlook
The comprehensive data released by the BEA provides a critical resource for understanding the nuanced economic conditions across the United States. The divergence in growth rates for PCE and income, coupled with varying RPPs, highlights the complex interplay of economic activity, consumer behavior, and cost of living across states.
The growth in real PCE and income in most states suggests a degree of economic resilience and recovery following periods of inflation. However, the disparities in growth rates underscore ongoing regional economic challenges and opportunities. States experiencing robust growth may continue to attract investment and population, while those facing contractions may need to implement targeted economic development strategies.
The emphasis on RPPs is particularly important in an era of rising living costs. Understanding how price levels differ across states is essential for evaluating the true purchasing power of income and for making informed decisions about relocation, business operations, and public policy. The BEA’s continued publication of RPP data, even with the discontinuation of metropolitan area income and PCE statistics, ensures that this vital aspect of regional economic analysis remains accessible.
The revisions to historical data are a testament to the BEA’s commitment to data accuracy and completeness. By continuously refining its estimates with the latest available information, the BEA provides policymakers, researchers, and the public with the most reliable economic intelligence possible.
The next release of these key state-level economic statistics is scheduled for December 10, 2026, which will include the 2025 data and supersede the 2024 figures. Until then, the newly released 2024 data offers a critical baseline for analyzing the nation’s economic performance and understanding the diverse economic realities experienced by Americans in different parts of the country. The BEA’s commitment to providing timely and detailed regional economic data remains a cornerstone of its mission to serve the public interest.