The U.S. Bureau of Economic Analysis (BEA) today released its comprehensive estimates for Gross Domestic Product (GDP) and personal income by county for 2024, revealing a broad pattern of economic expansion across the nation. The data indicates that real GDP, a measure of the inflation-adjusted value of goods and services produced, experienced growth in a significant majority of U.S. counties. This widespread increase suggests a resilient and widely distributed economic recovery or expansionary trend impacting local economies throughout the country.
Key Findings: GDP and Personal Income Trends
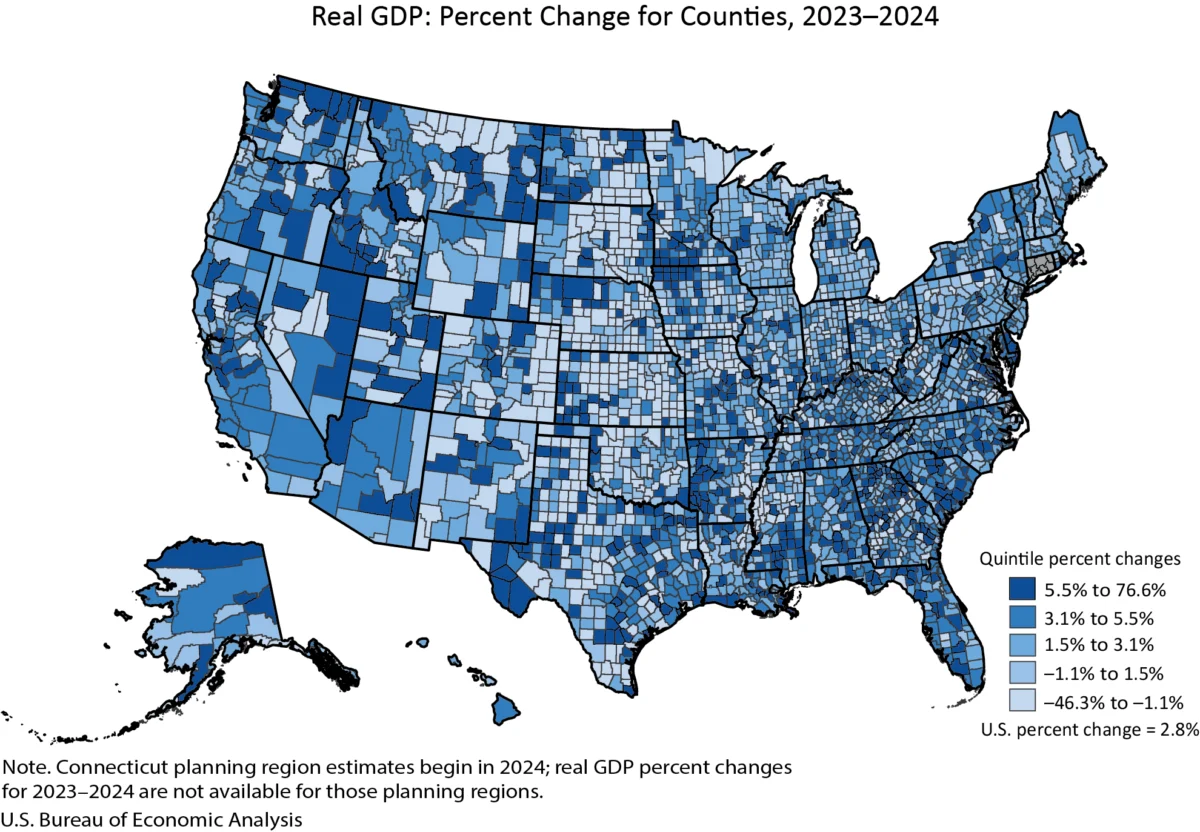
In 2024, real GDP saw an increase in an impressive 2,273 counties, underscoring a robust national economic performance at the local level. Conversely, 809 counties experienced a decrease in real GDP, while 24 counties remained unchanged. The magnitude of these changes varied considerably. Carter County, Montana, stood out with a remarkable 76.6 percent surge in real GDP, potentially signaling significant growth in sectors like natural resources or energy. On the other end of the spectrum, Baca County, Colorado, registered a substantial decline of 46.3 percent, indicating localized economic challenges.
Accompanying the GDP data, personal income, a measure of the income received by households and businesses, also demonstrated widespread growth. In 2024, personal income rose in 2,768 counties, a testament to the broad-based nature of economic gains. A smaller number of counties, 331, saw a decrease in personal income, and 7 counties reported no change. The percent change in personal income ranged from a notable 22.6 percent increase in Harding County, South Dakota, to a significant 23.3 percent decline in Issaquena County, Mississippi.
Analyzing the Scale of Economic Activity
The sheer scale of economic activity, as measured by total real GDP, reveals a stark contrast in the economic power of different counties. New York County, New York, a global financial hub, reported a staggering $813.7 billion in real GDP in 2024. This figure highlights its immense contribution to the national economy. In contrast, Issaquena County, Mississippi, recorded a much smaller $15.7 million in real GDP, illustrating the vast disparities in economic output across the American landscape.
Similarly, personal income levels exhibit considerable variation. Los Angeles County, California, a vast economic engine, posted $818.5 billion in total personal income, reflecting its large population and diverse economic base. At the lower end, Loving County, Texas, recorded $10.6 million in personal income, underscoring the economic realities of smaller, often resource-dependent communities.
County Economic Performance by Population Size
The BEA’s detailed analysis breaks down economic trends by county population size, offering deeper insights into how different types of communities are faring.
Large Counties (Population > 500,000)
In the category of large counties, with populations exceeding 500,000, the economic picture is generally positive. Out of these, 145 counties experienced GDP growth, while none reported a decline. One county remained unchanged. The range of GDP growth in these large economic centers was from a robust 10.7 percent in Pinal County, Arizona, to 0.0 percent in Johnson County, Kansas, indicating stable economic conditions.
For personal income in large counties, 146 counties saw an increase. The trend range for personal income in these counties was from 9.7% in San Joaquin County, California, to 2.7% in Philadelphia County, Pennsylvania, suggesting consistent income growth in major metropolitan areas.
The economic scale of these large counties is substantial. New York County, New York, led with $813.7 billion in real GDP, while Pinal County, Arizona, recorded $12.7 billion. In terms of personal income, Los Angeles County, California, was the leader with $818.5 billion, and Pinal County, Arizona, reported $26.1 billion.
Medium Counties (Population 100,000 to 500,000)
Medium-sized counties, defined as those with populations between 100,000 and 500,000, also showed a predominantly positive economic trajectory. Of these, 451 counties experienced GDP growth, with 20 reporting a decline and 3 remaining unchanged. The GDP trend range in this group was from a high of 12.4% in Jefferson County, Texas, to a decline of 2.6% in Black Hawk County, Iowa.
Personal income in medium counties also reflected growth, with 474 counties reporting increases. The personal income trend range was from 10.9% in Merced County, California, to 1.6% in Genesee County, Michigan.
The economic output of medium counties, while smaller than large counties, is still significant. Mercer County, New Jersey, reported $46.6 billion in real GDP, and Liberty County, Texas, had $2.6 billion. For personal income, Collier County, Florida, recorded $62.5 billion, and Floyd County, Georgia, had $4.9 billion.
Small Counties (Population < 100,000)
Small counties, those with populations under 100,000, presented a more varied economic landscape, with a larger proportion experiencing GDP declines. Out of 1,677 small counties showing GDP growth, a substantial 789 counties saw a decrease, and 20 remained unchanged. This category harbored the most extreme fluctuations, with Carter County, Montana, leading with a 76.6% GDP increase and Baca County, Colorado, facing a significant 46.3% decline.
Personal income trends in small counties also showed a considerable spread. Out of 2,148 counties with personal income growth, 331 experienced a decline and 7 remained unchanged. The extreme range of personal income changes was evident here, with Harding County, South Dakota, at a 22.6% increase and Issaquena County, Mississippi, at a 23.3% decrease.
The economic footprint of small counties varies widely. Martin County, Texas, for instance, had a real GDP of $15.1 billion, while Issaquena County, Mississippi, had $15.7 million. In terms of personal income, Teton County, Wyoming, reported $12.4 billion, and Loving County, Texas, had $10.6 million. The data for small counties highlights the significant impact of specific industries or localized economic events on their overall performance.
Background and Context: The BEA’s Role in Economic Measurement

The U.S. Bureau of Economic Analysis, a principal statistical agency of the U.S. Department of Commerce, plays a critical role in providing timely and accurate economic data. Its mission is to promote understanding of the U.S. economy by providing the best measures of economic performance, and the BEA’s county-level statistics are fundamental to understanding the localized impact of national economic trends.
The release of these county-level GDP and personal income estimates is part of BEA’s ongoing commitment to providing detailed economic data that informs policymakers, businesses, and the public. These estimates are crucial for understanding regional economic disparities, identifying areas of growth and decline, and formulating targeted economic development strategies. The BEA uses a rigorous methodology, incorporating a wide array of source data, including tax records, surveys, and administrative data, to produce these estimates.
Timeline and Updates to County Statistics
The estimates released today for 2024 represent the latest figures in an evolving dataset. The BEA undertakes annual updates to its GDP and personal income by county statistics, incorporating new and revised source data. This year’s update includes revisions to data from 2020 to 2023, ensuring greater accuracy and completeness. These revisions align the county-level data with the latest national and state-level economic accounts, reflecting the most up-to-date understanding of the U.S. economy.
A significant methodological change noted for the 2024 estimates is the incorporation of Connecticut’s planning region geographic definitions, replacing county-level definitions for that state. While this change affects how Connecticut’s economic data is presented, the BEA has confirmed that these new regional estimates are not yet included in the percent change ranges provided in this release, as historical data for these specific regions is not yet available.
Furthermore, the BEA has also released new estimates for per capita personal income for 2024, calculated using U.S. Census Bureau population figures for the period 2020 through 2024. This provides an additional layer of analysis, offering insights into the average income levels within counties.
Consolidation and Modernization of BEA Releases
In a move to enhance efficiency and provide a more holistic view of county-level economies, the BEA has combined its annual GDP and personal income by county news releases into a single, unified announcement for the first time. This integrated approach aims to offer a more comprehensive picture of economic conditions across all counties, replacing two separate releases that were previously issued on different dates.
This consolidation is part of a broader modernization effort by the BEA to streamline data dissemination and improve user accessibility. As part of this modernization, the BEA has transitioned from including detailed statistical tables directly within its news releases to providing links to its online Interactive Data Application. This allows data users to access the most complete and flexible data tables, which can be customized, downloaded in various formats (PDF, Excel, CSV), and include full time series. This approach reduces redundancy and directs users to a more dynamic and user-friendly platform for data exploration.
Discontinuation of Metropolitan Area Statistics
A notable shift in BEA’s reporting is the discontinuation of publication for statistics related to metropolitan statistical areas, micropolitan statistical areas, metropolitan divisions, combined statistical areas, and their metropolitan and nonmetropolitan portions. While GDP and personal income estimates will continue to be published by county, the focus has shifted away from these broader metropolitan classifications. This decision, according to the BEA, is intended to streamline reporting and emphasize the granular county-level data. Further details and explanations for this change can be found in the BEA’s Frequently Asked Questions (FAQ) section.
Analysis and Implications of County-Level Economic Trends
The widespread growth in real GDP and personal income across a majority of U.S. counties in 2024 suggests a generally positive economic environment. This broad distribution of economic gains could translate into increased consumer spending, job creation, and improved quality of life in many communities. The strong performance in numerous counties, particularly in the category of large and medium-sized economies, indicates that established economic centers continue to drive national growth.
However, the significant number of counties experiencing declines in GDP and personal income, especially among smaller counties, warrants attention. These disparities highlight the vulnerability of certain local economies to sector-specific downturns, global economic fluctuations, or demographic shifts. The extreme variations seen in counties like Carter County, Montana, and Baca County, Colorado, underscore the localized nature of economic impacts. Understanding the specific drivers behind these extreme changes—whether it be resource extraction booms and busts, agricultural cycles, or significant industry closures—will be crucial for targeted policy interventions.
The BEA’s decision to consolidate releases and shift to an online interactive data application signifies a commitment to modernizing data access. While this offers greater flexibility for data users, it also necessitates an adaptation to new ways of accessing and analyzing the information. The discontinuation of metropolitan area statistics also represents a strategic reorientation of BEA’s reporting, emphasizing the county as the primary unit of analysis for regional economic data.
Looking Ahead: Future Releases and Data Accessibility
The BEA has announced that the 2024 data will be superseded by the release of 2025 GDP and personal income by county statistics on December 2, 2026. Until then, the provided links will direct users to the latest available data. Historical data for the 2024 estimates will be accessible through the BEA’s Data Archive.
The BEA continues to provide supplementary information for its statistical releases, including definitions, conventions, and details on the use of its data, available via an "Additional Information" link. This commitment to transparency and user support is vital for the effective utilization of these important economic indicators.
The comprehensive data released today offers a detailed snapshot of the diverse economic landscape of the United States, providing valuable insights into the performance and trends of local economies across the nation. As the BEA continues to refine its methodologies and reporting, these statistics will remain a cornerstone for understanding the intricate dynamics of America’s economic engine at its most granular level.