Lana Rhoades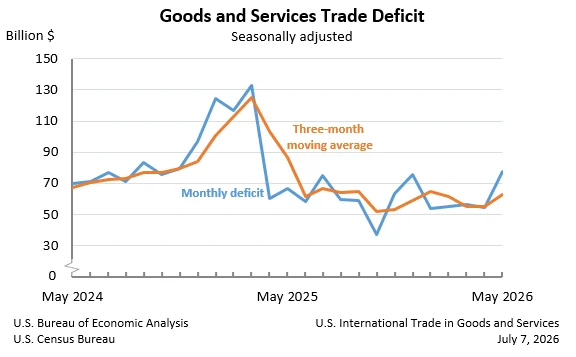
The United States experienced a significant widening of its goods and services trade deficit in May, with the imbalance reaching $77.6 billion. This represents a substantial increase of $23.0 billion from the revised April deficit of $54.6 billion, according to joint data released today by the U.S. Census Bureau and the U.S. Bureau of Economic Analysis. The surge underscores a complex interplay of export contractions and import expansions, painting a picture of evolving global trade dynamics.
May Trade Deficit: A Sharp Reversal
The headline figure of a $77.6 billion deficit for May marks a considerable deterioration in the nation’s trade balance. This increase of 42.2% from April’s revised figure is the most significant single-month jump in recent memory, signaling a potential shift in trade momentum. Exports, a crucial component of economic growth, saw a notable decline of 3.2% to $317.7 billion. Conversely, imports experienced a robust increase of 3.3%, reaching $395.3 billion. This divergence in performance between exports and imports is the primary driver behind the widening deficit.
The data further breaks down this imbalance into goods and services. The deficit in goods alone escalated by $23.6 billion to $106.5 billion in May. This surge in the goods deficit was partially offset by an increase in the services surplus, which grew by $0.6 billion to $28.9 billion. While the services sector continues to contribute positively to the trade balance, its gains were insufficient to counterbalance the significant deterioration in the goods sector.
Underlying Trends: Exports Contract, Imports Expand
Delving deeper into the components of trade reveals the specific factors contributing to the May figures. Exports of goods saw a substantial decrease of $11.3 billion, bringing the total to $210.6 billion. On a Census basis, goods exports declined by $11.6 billion, with net balance of payments adjustments adding $0.3 billion. This contraction in goods exports reflects a broad-based weakening across various export categories.
In contrast, imports of goods surged by $12.3 billion, reaching $317.0 billion. Imports of goods on a Census basis increased by $11.1 billion, with balance of payments adjustments contributing an additional $0.2 billion. This significant inflow of imported goods suggests a robust demand within the U.S. economy for foreign-made products, potentially driven by a combination of consumer spending and industrial activity.
The services sector, while not experiencing the same dramatic shifts as goods, also saw moderate changes. Exports of services increased by $0.8 billion to $107.1 billion in May, indicating continued strength in areas such as travel, financial services, and intellectual property licensing. Imports of services also saw a modest uptick of $0.2 billion, reaching $78.2 billion.
Real Goods Deficit: A Deeper Look
The report also provides insights into the real goods deficit, adjusted for inflation and measured in 2017 dollars on a Census basis. In May, this real goods deficit expanded by $15.8 billion, or 18.7%, to $100.0 billion. This increase in the real deficit is slightly less pronounced than the 28.8% increase seen in the nominal deficit, suggesting that a portion of the nominal increase is attributable to price changes. Nonetheless, the real deficit’s expansion highlights a genuine increase in the volume of goods imported relative to exported.
Year-to-Date Performance: A Contrasting Picture
While the May figures present a concerning trend, the year-to-date data offers a more nuanced perspective. For the period from January to May, the cumulative goods and services deficit has actually decreased by $203.9 billion, or 40.6%, compared to the same period in 2025. This significant reduction is a result of substantial increases in exports, which rose by $164.7 billion (11.7%), and a decrease in imports, which fell by $39.2 billion (2.1%). This suggests that the May figures may represent a temporary deviation from a broader trend of trade deficit reduction.
Three-Month Moving Averages: Smoothing Out Volatility
To account for monthly fluctuations, the report also provides three-month moving averages. The average goods and services deficit for the three months ending in May increased by $7.5 billion to $62.9 billion. This increase in the rolling average indicates that the widening deficit in May is part of a developing trend over the recent past, though it does not reach the same magnitude as the single-month figure.
Year-over-year, the average goods and services deficit has decreased by $23.8 billion for the three months ending in May, reinforcing the positive year-to-date trend. This suggests that while May experienced a notable setback, the overall trade balance over a longer period remains on an improving trajectory.
Trade Balance by Country: Shifting Partnerships
The report also offers a detailed look at trade balances with specific countries and regions. In May, the U.S. recorded surpluses with a number of trading partners, including the Netherlands ($9.1 billion), Hong Kong ($5.6 billion), South and Central America ($4.8 billion), Australia ($1.9 billion), and the United Kingdom ($1.4 billion). Significant surpluses were also noted with Brazil ($1.1 billion), Singapore ($0.9 billion), Belgium ($0.7 billion), and Saudi Arabia ($0.3 billion).
Conversely, the U.S. maintained substantial deficits with several key economies. Vietnam led the list with a deficit of $20.6 billion, followed by Mexico ($20.1 billion), Taiwan ($19.4 billion), and China ($14.5 billion). Other notable deficits were recorded with the European Union ($9.3 billion), Canada ($7.0 billion), Germany ($5.7 billion), Malaysia ($4.7 billion), South Korea ($4.4 billion), and India ($4.1 billion). Deficits also persisted with Ireland ($4.0 billion), Italy ($2.9 billion), Switzerland ($2.3 billion), Japan ($2.0 billion), France ($1.5 billion), and Israel ($0.4 billion). The persistent deficits with major manufacturing hubs like China and Vietnam, alongside significant deficits with Canada and Mexico, continue to be focal points of trade discussions.
Context and Potential Implications
The widening trade deficit in May arrives at a time when global economic recovery remains uneven. Factors such as varying inflation rates, geopolitical tensions, and shifts in consumer and industrial demand can all influence trade flows. The significant increase in imports suggests continued resilience in U.S. domestic demand, while the contraction in exports could signal challenges in key international markets or a strengthening dollar making U.S. goods more expensive abroad.
Economists will be closely monitoring upcoming reports to determine if the May figures represent a temporary anomaly or the beginning of a new trend. A sustained widening of the trade deficit could have implications for U.S. economic growth, employment, and the nation’s overall financial standing. Policymakers may face renewed pressure to address trade imbalances through various economic and diplomatic channels.
The detailed breakdown of trade by country also highlights the complex web of global economic interdependence. Surpluses with some nations and deficits with others underscore the varied nature of bilateral trade relationships and the ongoing negotiation of global trade agreements.
Revisions and Data Transparency
The report also included revisions to April’s trade figures, underscoring the dynamic nature of trade data. Revisions to April exports and imports were noted, though specific details were not elaborated upon in the summary provided. Such revisions are standard practice in economic data releases as more comprehensive information becomes available.
The U.S. Census Bureau and the Bureau of Economic Analysis are committed to providing transparent and timely trade data. The full release, including detailed exhibits and methodologies, is available on their respective websites, offering a comprehensive resource for researchers, businesses, and the public. The next release, covering June 2026 data, is scheduled for August 4, 2026, and will offer further insights into the trajectory of U.S. international trade.
The statistical significance of the percentage changes indicated in the data tables is not applicable or not measurable, as the data has been adjusted for seasonality but not for price changes. This distinction is crucial for understanding the true volume of trade versus the value of trade, which can be influenced by inflation.
Looking Ahead
The sharp increase in the U.S. trade deficit in May serves as a significant data point in the ongoing narrative of global economic activity. While year-to-date figures offer some reassurance, the monthly surge demands close attention. The interplay of domestic demand, global economic conditions, and currency valuations will continue to shape the U.S. trade balance in the coming months. Policymakers and market participants will be keenly observing future releases for indications of whether this widening deficit is a transient event or a more persistent challenge to the nation’s economic equilibrium. The next report, due in early August, will be critical in discerning the underlying trends.