Lana Rhoades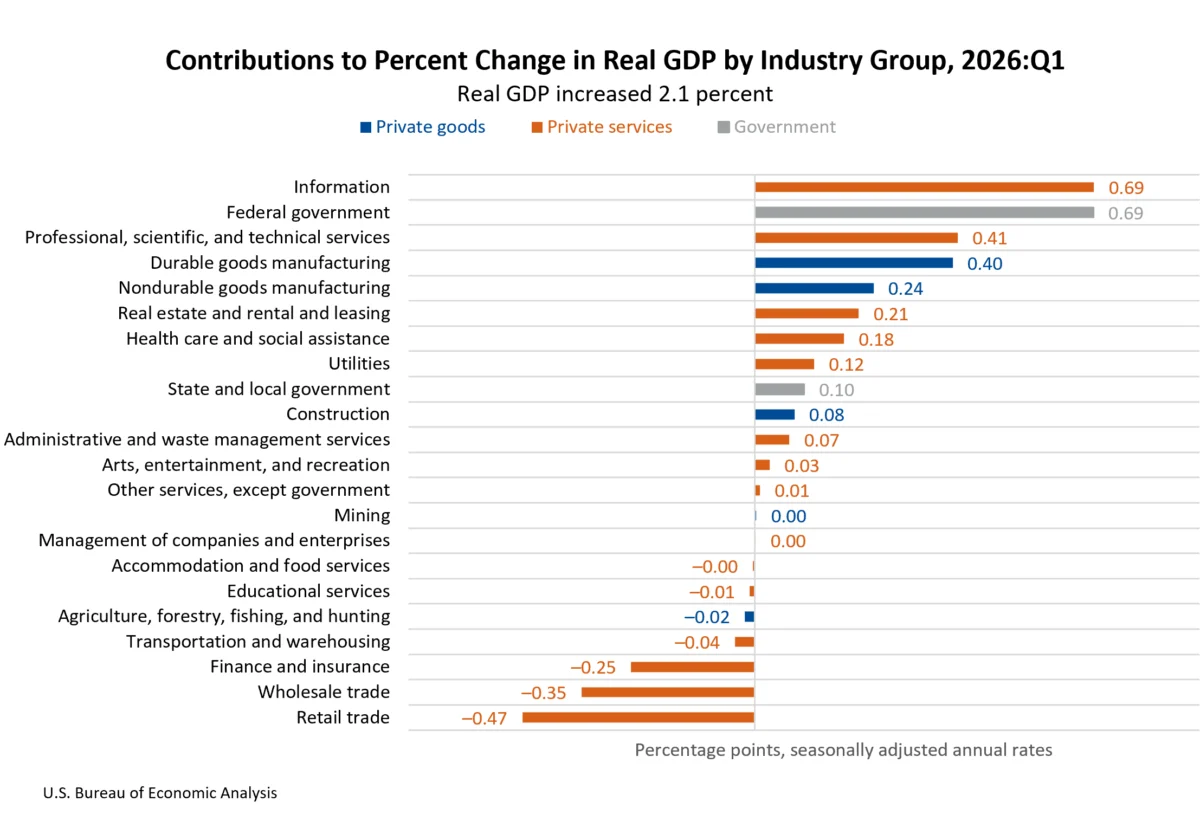
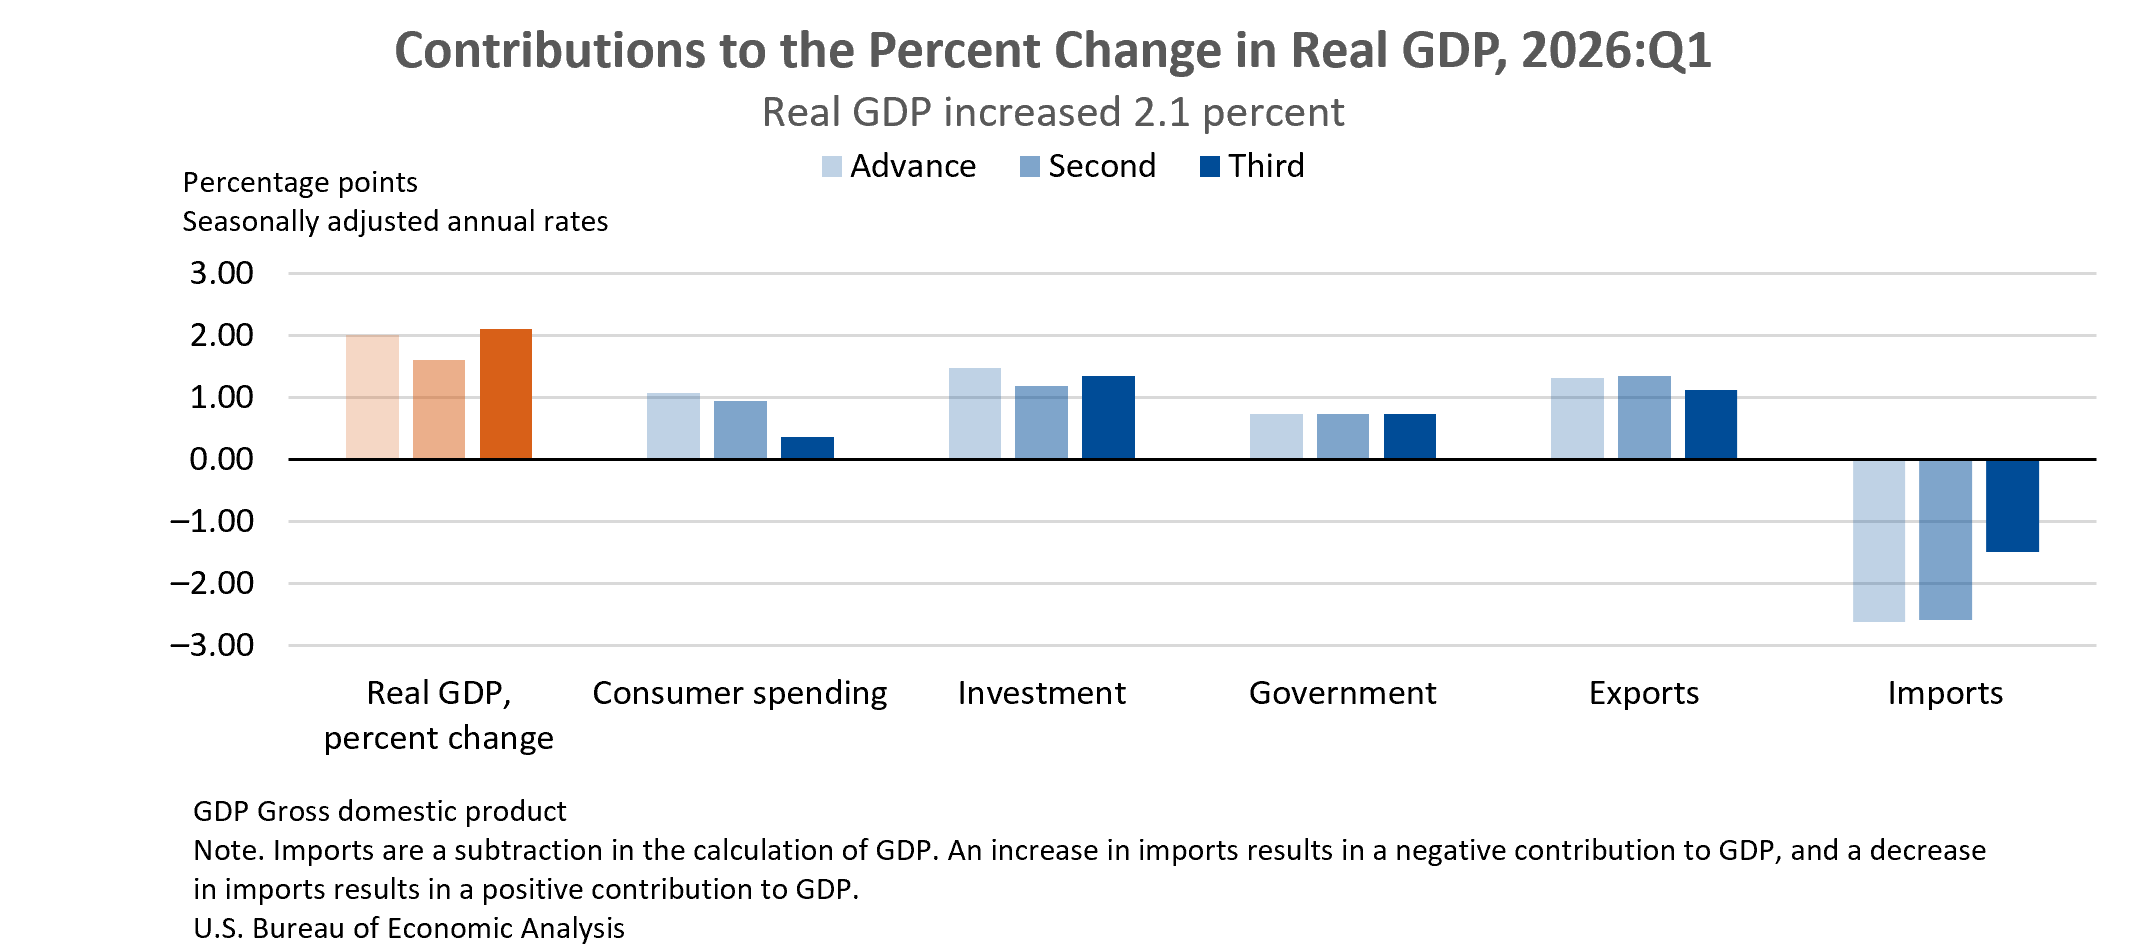
The U.S. economy demonstrated a notable acceleration in the first quarter of 2026, with real Gross Domestic Product (GDP) expanding at an annual rate of 2.1 percent. This marks a significant uptick from the 0.5 percent growth recorded in the final quarter of 2025. The upward revision of 0.5 percentage point from the second estimate, as released by the U.S. Bureau of Economic Analysis (BEA), underscores a dynamic economic landscape shaped by shifts in trade and consumer activity.
The improved GDP figure for the first quarter of 2026 was primarily influenced by a downward revision in imports. As imports represent a subtraction in the calculation of GDP, their reduction contributed positively to the overall growth rate. This effect was partially counterbalanced by a downward revision to consumer spending, indicating a complex interplay of factors influencing the nation’s economic output.
Key Drivers of First Quarter Growth
The expansion in real GDP during the first quarter of 2026 was fueled by several key components of the economy. Investment, exports, government spending, and consumer spending all contributed to the positive growth trajectory. While imports, a subtraction in GDP calculation, also increased, their net effect was outweighed by the positive contributions from other sectors.
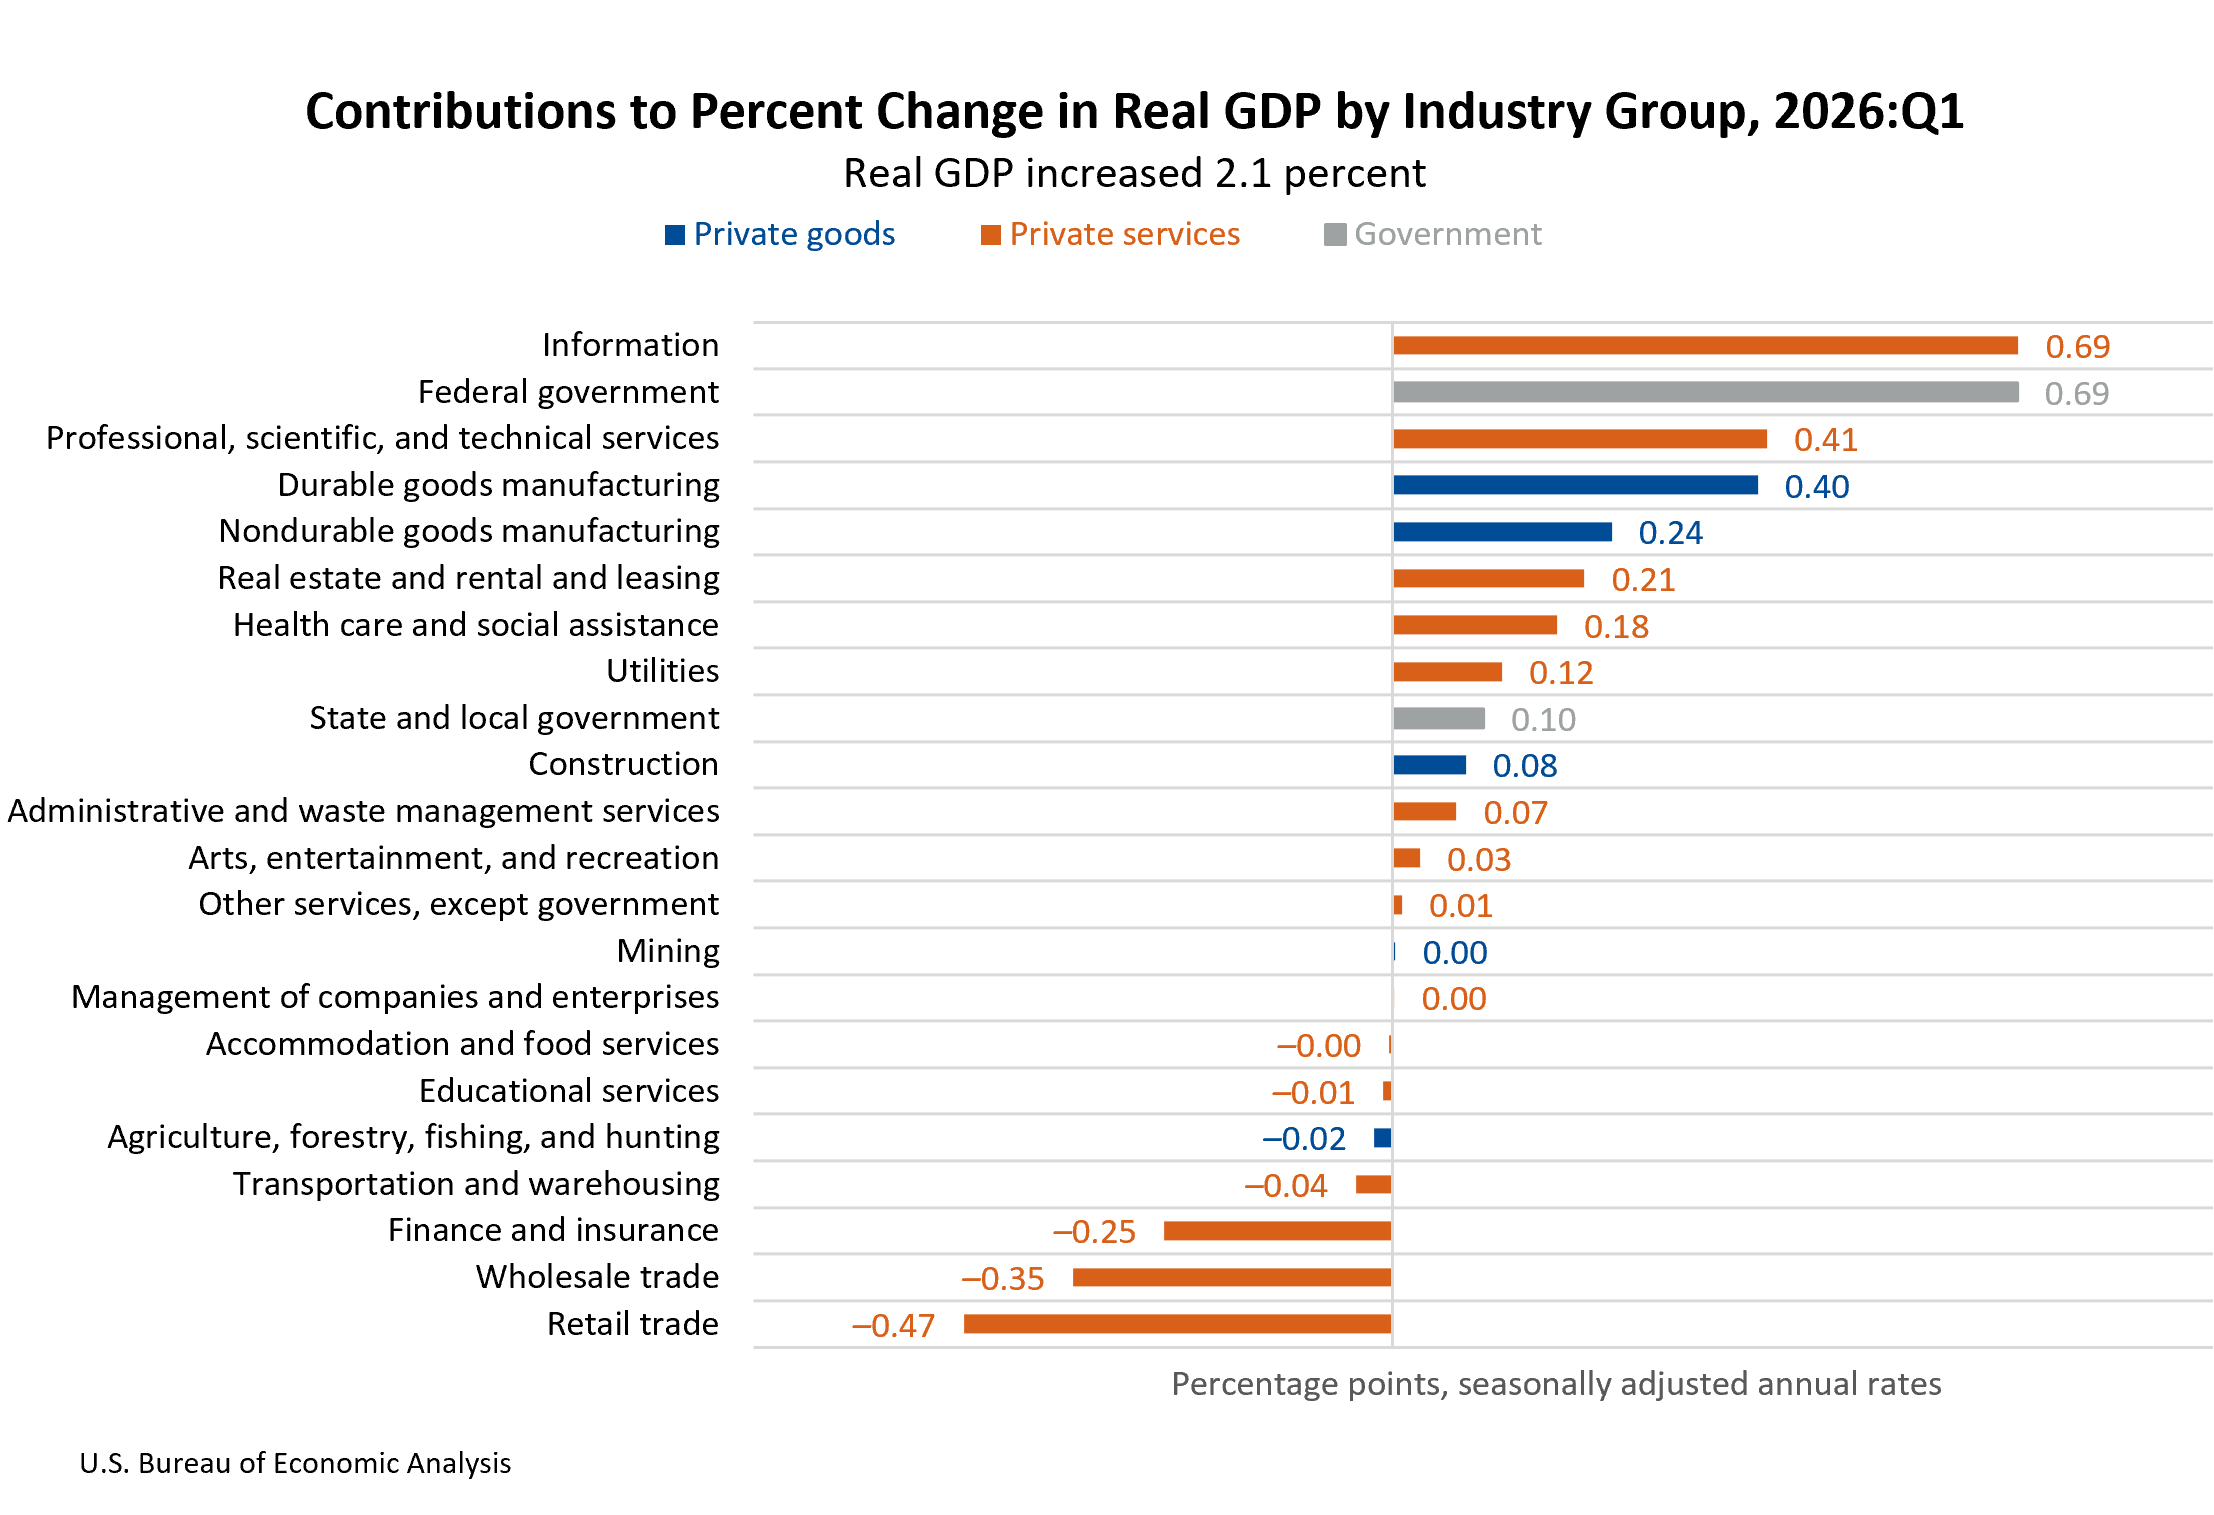
Diving deeper into the industrial composition of this growth, the BEA’s data reveals a robust performance across various sectors. The real value added increased by a substantial 7.5 percent for government activities, signaling a proactive role of public sector spending in economic stimulus. Private goods-producing industries saw a healthy growth of 4.5 percent, suggesting a rebound or continued strength in manufacturing and production. Private services-producing industries also contributed positively, expanding by 0.8 percent.
Among the specific industries that led this expansion, information technology emerged as a significant driver, alongside the federal government’s increased activity. Professional, scientific, and technical services also played a crucial role, reflecting continued investment in expertise and innovation. Furthermore, durable goods manufacturing showed strong performance, indicating sustained demand for long-lasting products. Conversely, the retail trade, wholesale trade, and finance and insurance sectors experienced decreases, acting as offsets to the overall growth.
Analysis of Revisions and Economic Indicators
The upward revision to the first-quarter GDP figure highlights the dynamic nature of economic data collection and refinement. The BEA’s third estimate, based on more comprehensive data than initial assessments, provides a clearer picture of economic performance. The downward revision to imports, while a positive for GDP, suggests potential shifts in domestic demand or global supply chain dynamics. The partial offset from consumer spending revisions indicates that while overall economic activity is rising, the pace of household consumption may be moderating or reallocating.
Beyond headline GDP, other economic indicators offer further insights into the first quarter’s performance. Real final sales to private domestic purchasers, a measure closely watched as an indicator of underlying domestic demand, increased by 1.7 percent. This figure was revised down by 0.7 percentage point from the previous estimate, suggesting that while domestic demand remains positive, its growth momentum may have been slightly less robust than initially thought.
Real gross output, a broader measure of economic activity, also saw an increase of 1.7 percent in the first quarter. This growth was propelled by the government sector (4.9 percent), private services-producing industries (1.7 percent), and a modest expansion in private goods-producing industries (less than 0.1 percent). The differing growth rates across these sectors underscore the varied economic conditions influencing different parts of the U.S. economy.
The reconciliation of GDP and Gross Domestic Income (GDI) provides another lens through which to view economic health. Real GDI, which measures the income side of the economy, increased by 1.2 percent in the first quarter, revised up by 0.3 percentage point from the previous estimate. The average of real GDP and real GDI, considered a more stable measure of economic growth by some economists, increased by 1.7 percent, revised up by 0.4 percentage point. This convergence suggests a more balanced economic picture emerging from the data.
Corporate profits, a key indicator of business health, showed a significant increase of $74.4 billion in the first quarter, revised up by $34.0 billion. This substantial gain in corporate earnings could signal improved profitability for businesses, potentially leading to increased investment and hiring in subsequent quarters.
Inflationary Pressures and Consumer Prices
On the inflation front, the price index for gross domestic purchases, a broad measure of price changes for goods and services purchased by U.S. residents, increased by 3.6 percent in the first quarter, a slight upward revision. The Personal Consumption Expenditures (PCE) price index, a key inflation gauge favored by the Federal Reserve, rose by 4.6 percent. This represents an upward revision of 0.1 percentage point from the prior estimate. The core PCE price index, which excludes volatile food and energy prices, increased by 4.4 percent, a figure consistent with previous estimates. These inflation figures suggest that while economic growth is accelerating, inflationary pressures remain a significant consideration for policymakers.
State-Level Economic Performance
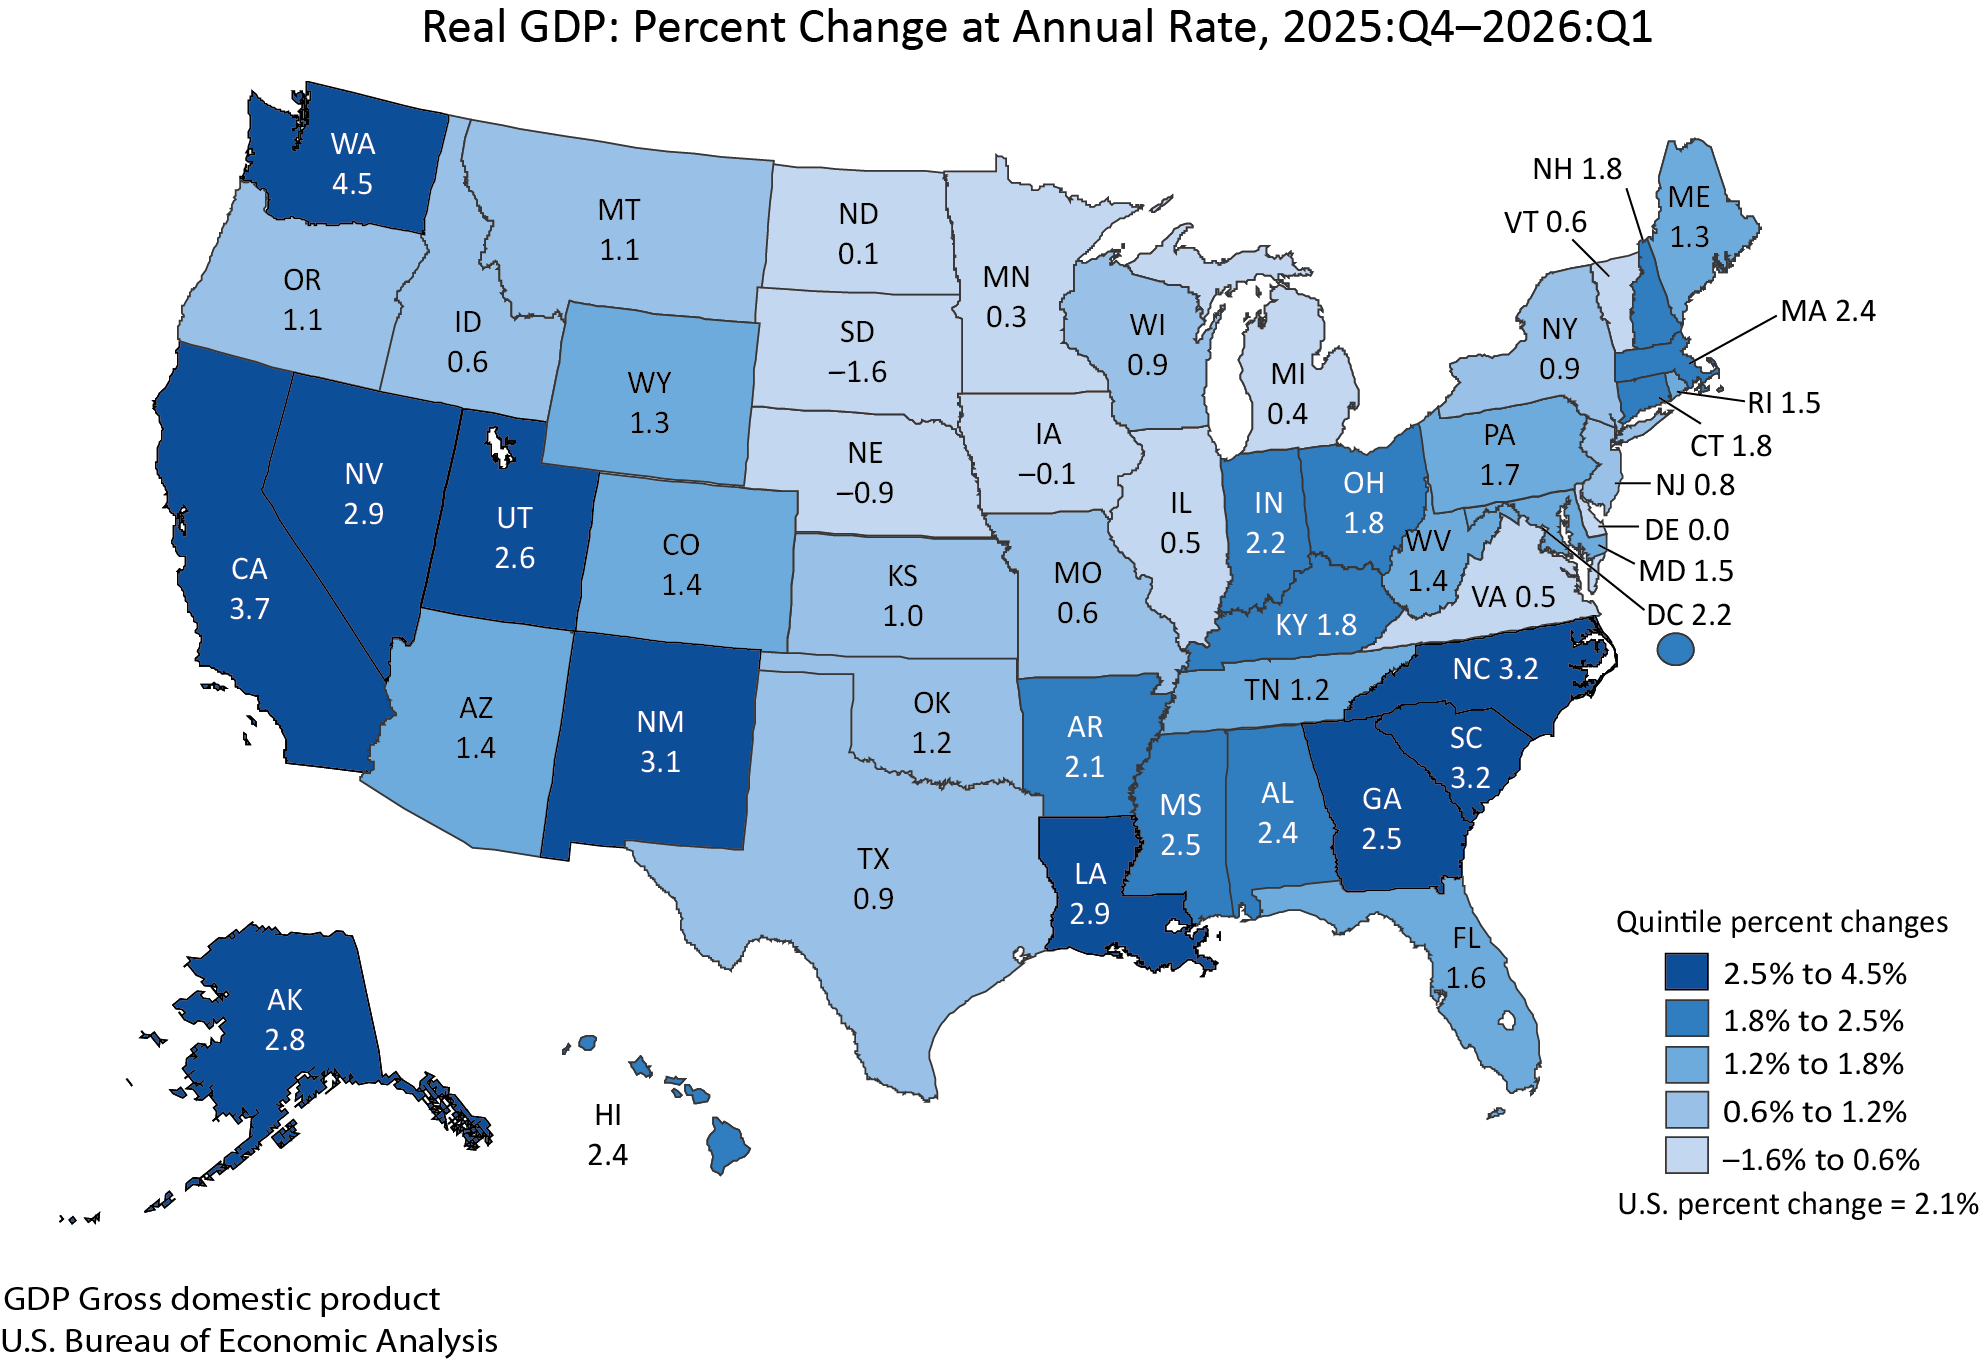
The economic vitality of the United States is not uniform, with significant regional variations observed in the first quarter of 2026. Real GDP experienced growth in 46 states and the District of Columbia, highlighting a broad-based expansion across much of the nation. Washington state led the pack with an impressive annual growth rate of 4.5 percent, driven significantly by its robust information sector. This indicates a continued technological boom in the Pacific Northwest.
In contrast, South Dakota experienced a contraction in real GDP, with a decline of 1.6 percent. The primary drag on South Dakota’s economy was a decrease in agriculture, forestry, fishing, and hunting, suggesting sector-specific challenges or adverse weather conditions impacting the state’s primary industries. Delaware’s economy remained unchanged, indicating a period of stability without significant expansion or contraction.
Personal Income Trends Across States
Beyond GDP, personal income provides insights into the financial well-being of households. In the first quarter of 2026, current-dollar personal income across the nation increased by $222.6 billion, translating to a 3.4 percent annual growth rate. This growth was widespread, with 49 states and the District of Columbia reporting increases in personal income.
North Dakota emerged as a standout performer in terms of personal income growth, with an annual rate of 22.4 percent. This remarkable surge likely reflects a strong performance in its key industries, potentially including energy or agriculture, and may be linked to favorable commodity prices or increased production. Conversely, Hawaii experienced a significant decline of 23.9 percent in personal income. This sharp decrease is attributed to a settlement paid to households in the fourth quarter of 2025 related to the 2023 Maui wildfire, an exceptional event that impacted the state’s income figures.
Earnings, which include compensation and proprietors’ income, increased in 46 states. The percent change in earnings ranged from a high of 34.7 percent in North Dakota to a decrease of 1.5 percent in the District of Columbia. Personal current transfer receipts, which include payments like social security and unemployment benefits, increased in 45 states and the District of Columbia. Minnesota saw a notable increase of 15.5 percent, while Hawaii’s transfer receipts saw a substantial decrease of 75.7 percent, again linked to the wildfire-related settlement. Property income, encompassing dividends, interest, and rent, showed broad-based growth, increasing in 50 states and the District of Columbia, with Idaho reporting the highest growth at 5.5 percent.
Chronology of Economic Data Releases and Revisions
The release of economic data is a multi-stage process, with preliminary estimates followed by subsequent revisions as more comprehensive information becomes available. For the first quarter of 2026:
- Advance Estimate: This initial estimate, typically released about a month after the quarter ends, provides a first look at GDP growth.
- Second Estimate: Released about two months after the quarter, this estimate incorporates more complete data and often includes minor revisions.
- Third Estimate: This final estimate, released approximately three months after the quarter, incorporates the most complete data available. The current report represents this third estimate for the first quarter of 2026.
The revisions between these estimates are crucial for understanding the underlying economic trends. The upward revision to real GDP from 1.6 percent in the second estimate to 2.1 percent in the third estimate underscores the importance of these subsequent data integrations. Similarly, the upward revision to real GDI and the average of real GDP and real GDI further refine the picture of economic activity.
Broader Economic Implications and Future Outlook
The acceleration in GDP growth to 2.1 percent in the first quarter of 2026 suggests a resilient U.S. economy, capable of expanding at a healthy pace. The contributions from investment and exports are particularly encouraging, indicating potential strengths in business confidence and international trade relationships. The robust performance of the information sector and federal government spending also points to areas of significant economic activity.
However, the moderating growth in consumer spending and the continued presence of elevated inflation, as indicated by the PCE price index, warrant careful monitoring. Policymakers at the Federal Reserve will likely weigh these competing factors as they formulate monetary policy. A sustained period of growth alongside persistent inflation could lead to continued interest rate adjustments.
The strong corporate profit growth is a positive signal for businesses, potentially translating into increased capital expenditures and job creation. The uneven performance across different states and industries, however, highlights the need for targeted economic policies to address regional disparities and support sectors facing headwinds.
Annual Updates and Future Releases
The Bureau of Economic Analysis is also preparing for its annual updates to national and regional economic accounts. These comprehensive updates, scheduled to begin on September 30, 2026, will integrate a wealth of new and revised data, providing a more accurate and detailed picture of the U.S. economy. This year’s updates will see the concurrent production of national, industry, and regional data for the first time, aiming to enhance the consistency and timeliness of BEA’s statistical output.
The next release from the BEA will be on July 30, 2026, at 8:30 a.m. EDT, providing the advance estimate for GDP in the second quarter of 2026. This upcoming report will offer the latest insights into the evolving economic trajectory of the United States.
Technical Notes and Data Adjustments
The BEA’s technical notes provide transparency into the data and methodologies used in its estimations. The first-quarter GDP revision was primarily driven by a downward revision to imports, partially offset by a downward revision to consumer spending. The BEA also clarified adjustments made to source data, such as for legal services prices, and explained how certain events, like the International Emergency Economic Powers Act tariff refunds, are treated in the National Economic Accounts. These tariff refunds, related to an unlawful imposition of tariffs, were treated as a capital transfer and did not affect first-quarter GDP.
Furthermore, the BEA released revised quarterly estimates of personal income by state for 2025, incorporating updated source data to align with national estimates. These ongoing refinements ensure the accuracy and reliability of the economic data reported by the U.S. government.
The detailed data supporting these findings is available through BEA’s interactive data application, offering a comprehensive resource for researchers, policymakers, and the public to explore national, industry, and state-level economic performance.