

 Lana Rhoades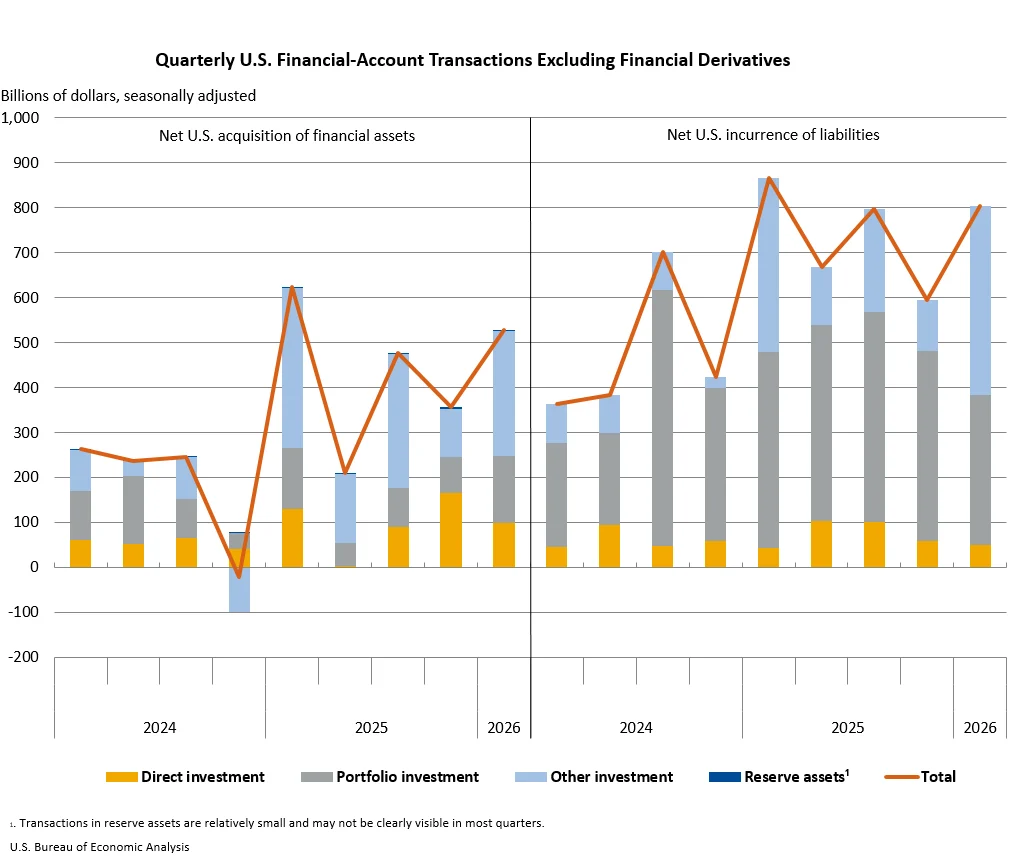
The United States experienced a notable widening of its current-account deficit in the first quarter of 2026, expanding by $5.8 billion, or 2.6 percent, to reach $226.8 billion. This increase, as reported by the U.S. Bureau of Economic Analysis (BEA), signifies a shift in the nation’s international economic transactions. The revised deficit for the preceding fourth quarter of 2025 stood at $221.1 billion. As a proportion of the nation’s economic output, the current-account deficit grew to 2.9 percent of current-dollar gross domestic product (GDP) in the first quarter, a marginal increase from the 2.8 percent recorded in the fourth quarter of 2025.
This widening of the current-account deficit was primarily driven by a significant reversal in the balance on primary income, which transitioned from a surplus in the final quarter of 2025 to a deficit in the first quarter of 2026. This development was partially counteracted by a decrease in the deficit observed in the trade of goods. The U.S. International Transactions Accounts (ITAs) and the International Investment Position (IIP) Accounts underwent their annual updates for 2026, incorporating a wealth of newly available and revised source data. These updates, which extend back to 1999 for BEA’s recalculations, aim to provide a more accurate and comprehensive picture of the U.S. economic interactions with the rest of the world.
Shifting Income Balances and Goods Trade Dynamics
The primary income account, which encompasses earnings from foreign investments and compensation of employees, played a pivotal role in the first quarter’s deficit expansion. In the fourth quarter of 2025, the U.S. recorded a surplus in its primary income balance, indicating that income received from abroad exceeded income paid to foreign residents. However, this trend reversed in the first quarter of 2026, leading to a deficit. While the exact composition of this shift requires deeper analysis of the BEA’s detailed data, such movements can be influenced by a variety of factors, including fluctuations in global interest rates, dividend payments from foreign subsidiaries, and changes in the profitability of U.S. investments abroad versus foreign investments in the U.S.
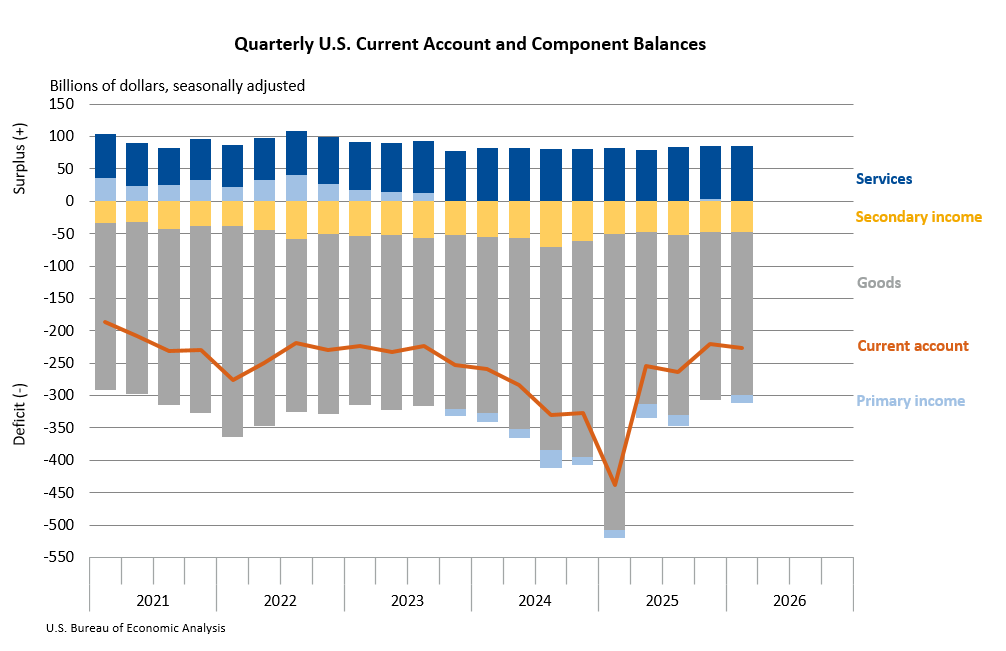
Concurrently, the deficit in the goods balance saw a reduction. Exports of goods, a key component of the current account, experienced an increase. This suggests a potentially stronger global demand for American products or improved competitiveness of U.S. exports. Conversely, imports of goods also rose, but the net effect on the goods balance was a narrowing of the deficit, providing a partial offset to the deterioration in the primary income balance.
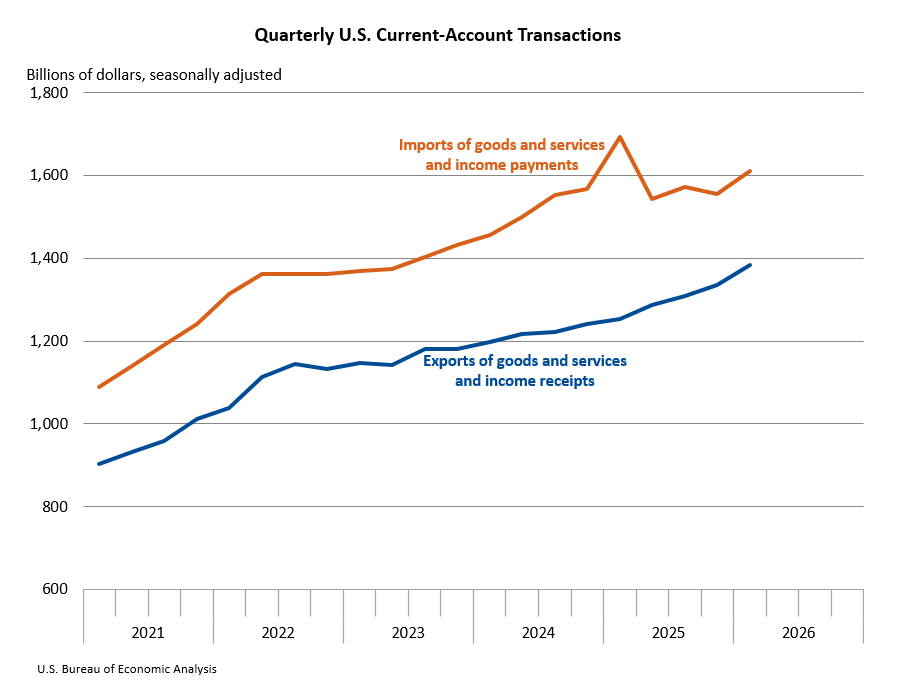
Overall exports of goods and services, along with income received from foreign residents, saw a substantial increase of $50.0 billion, bringing the total to $1.38 trillion in the first quarter. This rise was propelled by an uptick in goods exports, although this was partially tempered by a decrease in primary income receipts. On the import side, both goods and services from, and income paid to, foreign residents also increased, climbing by $55.8 billion to reach $1.61 trillion. This surge in imports reflects a broader pattern of increased international trade activity.
Capital Transfers and Financial Account Transactions
Beyond the primary drivers of the current account, capital transfers also contributed to the overall international transactions picture. Capital-transfer receipts saw a significant increase of $3.3 billion, reaching $3.4 billion in the first quarter. Conversely, capital-transfer payments experienced a decrease of $0.9 billion, settling at $2.0 billion. Capital transfers are distinct from current transactions and involve the transfer of ownership of fixed assets or the forgiveness of liabilities without any goods or services being exchanged.
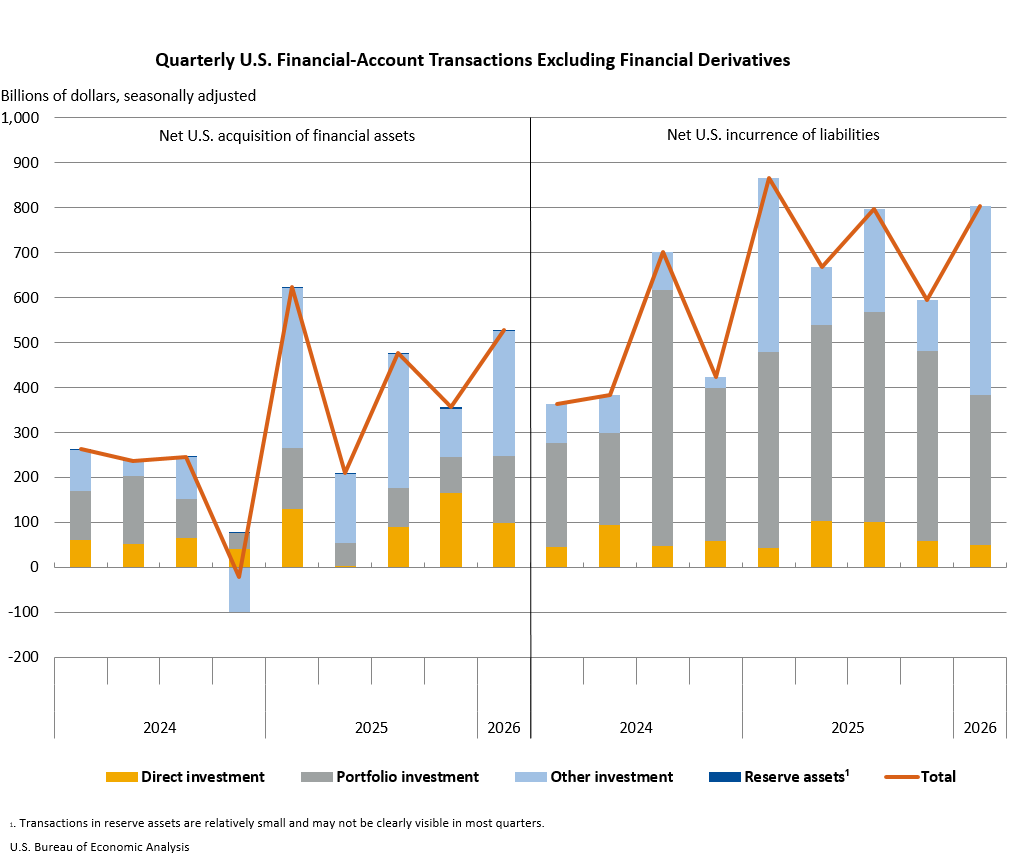
The financial account, which tracks international investment flows, recorded net transactions of negative $209.0 billion in the first quarter of 2026. This figure reflects a net borrowing by the U.S. from foreign residents, meaning that foreign investment into the U.S. exceeded U.S. investment abroad. During this period, U.S. residents increased their holdings of foreign financial assets by $527.3 billion, while simultaneously increasing their liabilities to foreign residents by a larger sum of $803.7 billion. This disparity underscores the net outflow of capital from a financial perspective.
It is important to note a correction issued by the BEA regarding the net financial-account transactions figure. An erratum clarified that the figure of -$209.0 billion was updated on June 30, 2026, to include a negative sign, which had been inadvertently omitted. This typo affected only this specific number within the news release and did not impact the data available through BEA’s Interactive Data Application or Application Programming Interface.
U.S. Net International Investment Position
The U.S. net international investment position, a measure of the difference between U.S. residents’ foreign financial assets and liabilities, stood at negative $21.27 trillion at the close of the first quarter of 2026. This represents a substantial net debtor position for the United States. Total U.S. foreign assets were valued at $43.37 trillion, while U.S. liabilities to foreign residents amounted to $64.64 trillion. At the end of the fourth quarter of 2025, the net investment position was revised to negative $21.87 trillion, indicating a slight improvement in the net position during the first quarter of 2026, despite the widening current-account deficit.
The increase in U.S. assets during the first quarter was substantial, rising by $462.9 billion. This growth was broadly distributed across major investment categories, with the exception of direct investment. Financial transactions accounted for $527.3 billion of this increase, but this was partially offset by exchange-rate fluctuations totaling negative $357.1 billion, which reduced the dollar value of foreign assets held by U.S. residents.
In contrast, U.S. liabilities to foreign residents saw a decrease of $140.4 billion during the first quarter. This reduction was primarily driven by a decline in portfolio investment liabilities, which was partially offset by increases in other major investment categories. The overall decrease in liabilities was a result of significant price changes, amounting to negative $1.18 trillion, which more than counteracted the positive impact of financial transactions totaling $803.7 billion. These price changes can reflect shifts in the market value of foreign-held assets in the U.S., such as stocks and bonds.
Annual Updates and Data Revisions
The statistics released reflect the annual updates to the U.S. International Transactions Accounts (ITAs) and the International Investment Position (IIP) Accounts. These comprehensive updates by the BEA are crucial for maintaining the accuracy and relevance of national economic data. The BEA incorporates newly available and revised source data from various agencies, including the U.S. Census Bureau and the U.S. Department of the Treasury, alongside its own extensive data collection efforts.
Key data sources integrated into these annual updates include benchmark and quarterly insurance services surveys (2019-2025), quarterly international services surveys (2023-2025), and benchmark, annual, and quarterly direct investment surveys (2022-2025). Revisions to Census-basis goods data from the U.S. Census Bureau for the years 2023-2025, and annual, quarterly, and monthly portfolio and other investment surveys from the U.S. Department of the Treasury for the years 2023-2025, also contribute to these significant revisions.
These updates are essential for ensuring that the BEA’s economic accounts accurately reflect the dynamic nature of global trade and investment. The process also involves recalculating seasonal and trading-day adjustments, which smooth out short-term fluctuations and reveal underlying trends.
Broader Implications and Future Outlook
The widening current-account deficit, while a concern, is part of a complex web of international economic interactions. The shift from a primary income surplus to a deficit warrants close monitoring. A persistent deficit in primary income could signal a growing reliance on foreign borrowing to finance domestic consumption and investment, or a decline in the profitability of U.S. overseas investments relative to foreign investments in the U.S.
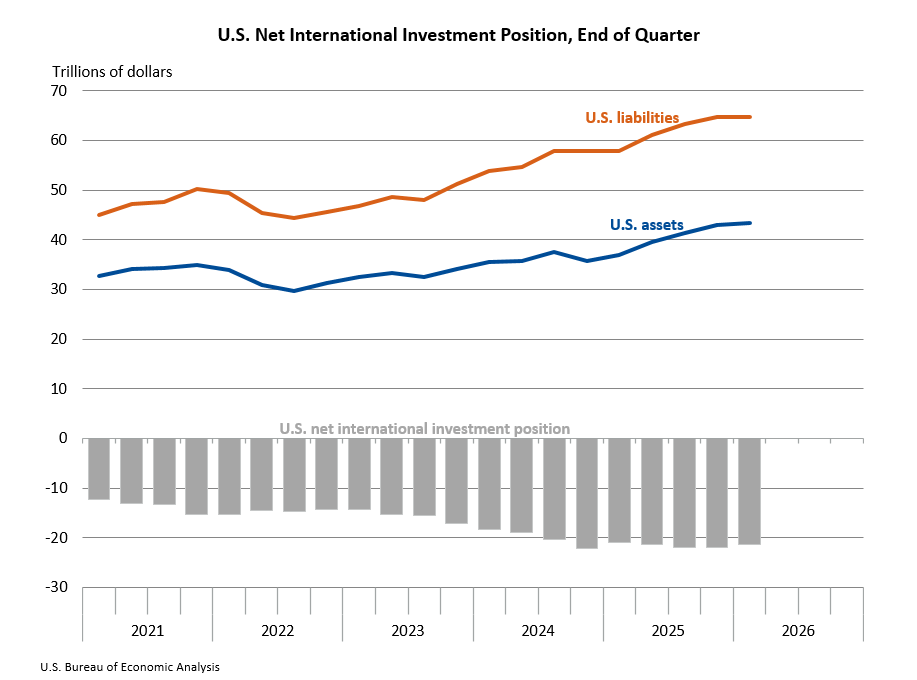
The net international investment position, while still significantly negative, showed a slight improvement in the first quarter of 2026 compared to the revised fourth quarter of 2025. This suggests that while the U.S. remains a net debtor nation, the valuation effects on assets and liabilities, particularly price changes, can play a significant role in shaping the overall net position.
The BEA’s commitment to annual updates and the incorporation of revised data underscore the importance of robust statistical frameworks for understanding and managing national economic performance. The detailed breakdown of international transactions and investment positions provides policymakers, businesses, and the public with critical insights into the U.S. role in the global economy.
The next release of U.S. International Transactions and Investment Position statistics, covering the second quarter of 2026, is scheduled for September 24, 2026. These upcoming figures will supersede the first-quarter data and provide further updates on the evolving landscape of U.S. international economic engagement. The BEA also announced an update to its disclosure avoidance method, employing coarsening techniques such as rounding, aggregation, and the use of ranges, to enhance data publication while safeguarding respondent confidentiality. This methodological adjustment aims to strike a balance between transparency and privacy in economic data reporting.








