

 Lana Rhoades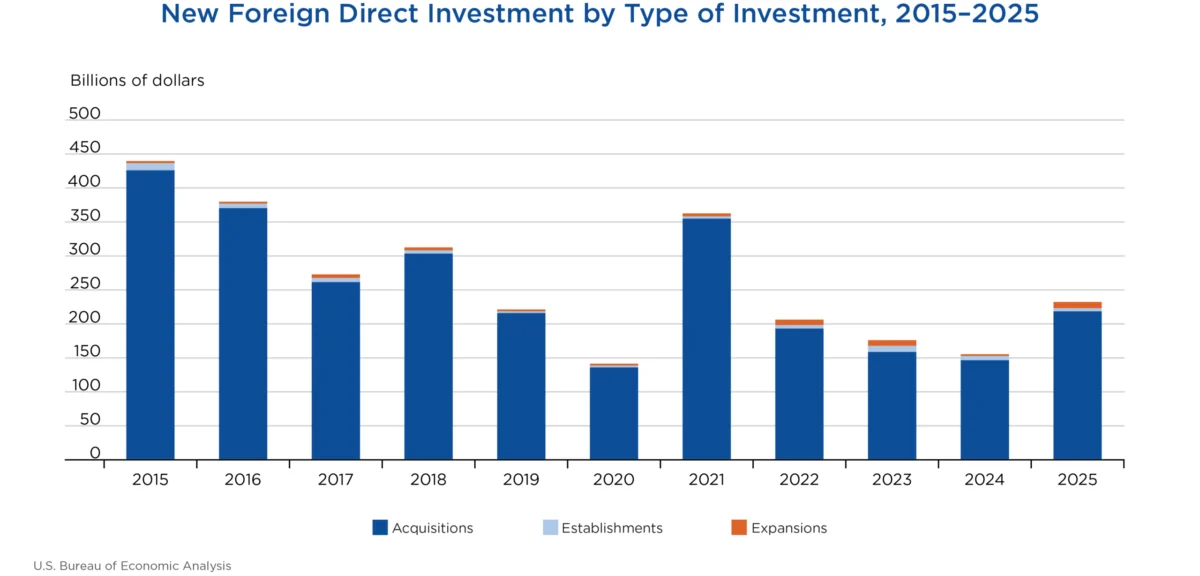
Expenditures by foreign direct investors to acquire, establish, or expand U.S. businesses reached a robust $232.2 billion in 2025, according to preliminary statistics released today by the U.S. Bureau of Economic Analysis (BEA). This represents a significant increase of $76.8 billion, or a remarkable 49.5 percent, compared to 2024 levels. The data underscores a dynamic period for international capital flows into the American economy, with acquisitions of existing U.S. businesses continuing to dominate the investment landscape, a trend consistent with previous years.
The BEA’s comprehensive report details a substantial allocation of foreign capital across various investment types. Acquisition expenditures alone accounted for $218.4 billion of the total. Expenditures aimed at establishing entirely new U.S. businesses, often referred to as greenfield investments, totaled $4.6 billion. Meanwhile, efforts to expand existing foreign-owned businesses within the United States contributed an additional $9.2 billion. Looking ahead, planned total expenditures, encompassing both initial first-year outlays and projected future investments, were estimated at a substantial $284.5 billion, signaling continued international interest in the U.S. market.
This surge in foreign direct investment (FDI) in 2025 translated directly into job creation and economic expansion. A total of 213,100 employees were employed in newly acquired, established, or expanded foreign-owned businesses across the United States during the year. This figure highlights the tangible impact of FDI on the American workforce and economic vitality.
Sectoral Dominance and Geographic Distribution of Investment
The BEA report provides a granular view of where foreign capital is flowing within the U.S. economy. By industry, the publishing sector emerged as a leading recipient of new direct investment, attracting $50.7 billion. This was closely followed by the chemicals manufacturing industry, which garnered $45.4 billion, and the plastics and rubber products manufacturing sector, with $19.0 billion. Collectively, the manufacturing sector represented a significant portion of overall investment, accounting for $121.8 billion, or 52.5 percent of all new direct investment expenditures. This strong performance in manufacturing suggests continued confidence in the sector’s resilience and future growth prospects among international investors.
On a country-by-country basis, Japan led the pack in terms of investment volume, injecting $50.5 billion into the U.S. economy. Germany followed with substantial investments totaling $26.7 billion, and Canada contributed $23.5 billion. When viewed regionally, Europe proved to be the most significant source of new FDI, contributing a collective $116.6 billion, which represented 50.2 percent of all new investment in 2025. The Asia and Pacific region also demonstrated robust engagement, ranking as the second-largest investing region with $71.9 billion in expenditures.
Geographically within the United States, California once again proved to be a magnet for foreign capital, attracting the largest share of first-year investment expenditures at $59.7 billion. Texas followed, with $21.5 billion in investment, and Pennsylvania secured the third position with $20.9 billion. These states, known for their diverse economies and robust business environments, continue to benefit significantly from global investment trends.
Greenfield Investments: Building the Future
Greenfield investments, which involve the establishment of new businesses or the expansion of existing foreign-owned enterprises, represent a crucial indicator of long-term commitment and capacity building. In 2025, these expenditures totaled $13.8 billion. Within the greenfield landscape, the transportation and warehousing sector attracted the largest share of investment, with $3.6 billion. This was followed by computers and electronics products manufacturing ($2.0 billion) and chemicals manufacturing ($1.8 billion).
Regionally, investors from the Asia and Pacific bloc spearheaded greenfield investments, contributing $8.3 billion. This regional strength was notably driven by Australia ($3.0 billion), South Korea ($2.2 billion), and Japan ($1.7 billion). By state, Louisiana emerged as a significant recipient of greenfield investment, drawing $3.0 billion, followed by Arizona ($2.7 billion) and Texas ($1.9 billion). The projected total expenditures for greenfield investments initiated in 2025, including planned future outlays, reached $66.1 billion, signaling a strong pipeline of future development and job creation.
Employment Dynamics Stemming from FDI
The impact of foreign direct investment on employment is a critical metric for understanding its contribution to the U.S. economy. In 2025, current employment within acquired enterprises stood at 211,700 individuals. When considering the planned employment for newly established businesses upon reaching full operational capacity, as well as anticipated job growth from expansions, the total planned employment figure reached an impressive 232,400.
Analyzing employment by industry, the plastics and rubber parts manufacturing sector reported the largest number of current employees, with 21,800. Transportation equipment manufacturing followed with 17,300 employees, and primary and fabricated metals manufacturing employed 16,400 individuals. By country of origin, Mexico accounted for the largest number of current employees through FDI, with 54,600 jobs, followed by Canada (29,500) and the United Kingdom (26,800). California led the nation in terms of current employment resulting from new FDI, with 37,200 jobs, followed by Illinois (17,600) and Texas (16,500).
Revisions to 2024 Data Signal Upward Trend
In addition to the 2025 preliminary data, the BEA also released revised figures for 2024, which indicated an upward adjustment in foreign direct investment. First-year expenditures for 2024 were revised to $155.3 billion, an increase from the previously published $151.0 billion. This revision was largely driven by an increase in expenditures for U.S. businesses acquired, which rose to $146.4 billion from $143.0 billion. Expenditures for establishing new businesses and expanding existing ones also saw modest upward revisions.
Similarly, planned total expenditures for 2024 were revised upward to $164.0 billion from $157.0 billion. These revisions suggest that the strong performance observed in 2025 may be built upon a more robust underlying trend than initially estimated for the prior year, reinforcing the narrative of growing international investor confidence in the U.S. economy.
Broader Economic Context and Implications
The substantial increase in foreign direct investment in 2025 occurs against a backdrop of global economic shifts and evolving trade policies. For the United States, a significant inflow of FDI offers multiple benefits. It can lead to the creation of high-skilled and well-paying jobs, inject capital into research and development, foster innovation through technology transfer, and enhance the competitiveness of domestic industries. Moreover, FDI can contribute to a more favorable balance of payments and strengthen international economic ties.
The dominance of acquisitions over greenfield investments, while consistent with historical trends, suggests that foreign investors are often seeking to leverage existing U.S. infrastructure, established market presence, and skilled workforces. While acquisitions can bring immediate economic benefits, a strong emphasis on greenfield investments, which represent the creation of new productive capacity, is often viewed as a more direct indicator of long-term, organic economic growth. The substantial planned expenditures for greenfield investments in 2025, however, offer a positive outlook for future capacity expansion.
The BEA’s commitment to enhancing data disclosure through methods like coarsening, which includes rounding and aggregation, allows for the publication of more detailed information while maintaining the confidentiality of survey respondents. This approach ensures that valuable economic insights can be shared with policymakers, businesses, and the public, facilitating informed decision-making.
As the U.S. economy navigates various domestic and international challenges, the consistent and increasing flow of foreign direct investment serves as a testament to its enduring appeal as a destination for global capital. The sectors attracting the most investment, such as manufacturing and publishing, along with key states like California and Texas, are poised to experience further growth and development. The BEA’s forthcoming release of 2026 data in June 2027 will provide crucial insights into whether this upward trajectory in FDI continues to shape the American economic landscape.
The detailed breakdown of expenditures by industry, country, and state, alongside employment figures, provides a critical toolkit for understanding the multifaceted impact of FDI. Businesses, policymakers, and economic analysts will closely monitor these trends to gauge the health of international investment in the U.S. and its contribution to overall economic prosperity. The BEA’s rigorous data collection and dissemination efforts are instrumental in providing the transparency needed to understand these complex economic dynamics.








