

 Lana Rhoades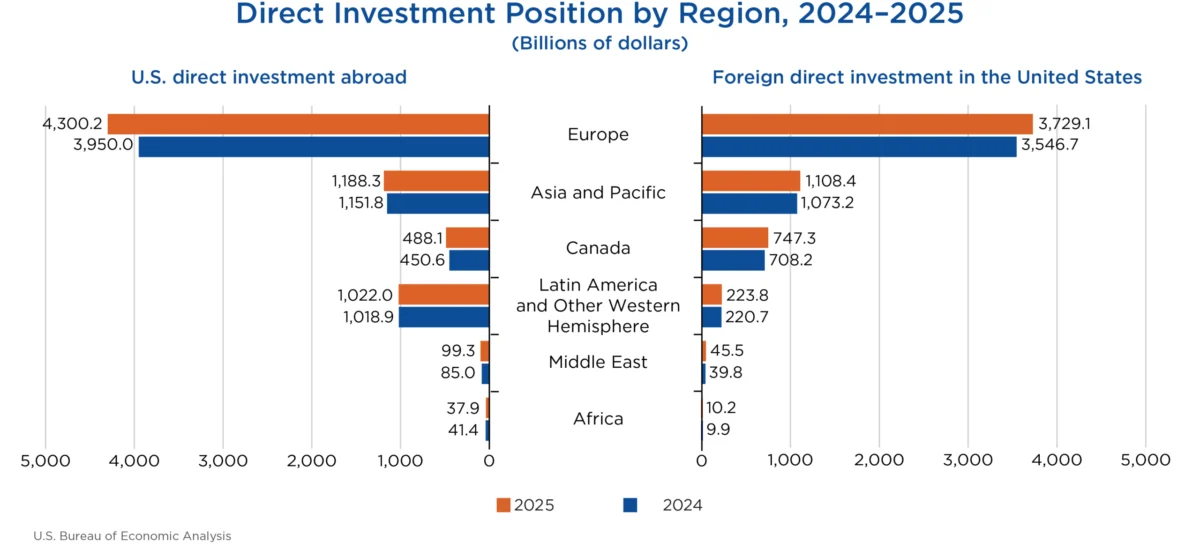
The cumulative level of U.S. direct investment abroad reached $7.14 trillion by the end of 2025, marking an increase of $438.1 billion from the previous year. This robust expansion was primarily fueled by a substantial $350.2 billion surge in investments within Europe, with the United Kingdom and Luxembourg emerging as the leading destinations. Manufacturing sectors, particularly chemical manufacturing, spearheaded this growth in outward U.S. investment. Simultaneously, foreign direct investment (FDI) in the United States also demonstrated considerable strength, climbing $266.0 billion to a total of $5.86 trillion. Europe was again a key driver of this inbound investment, contributing $182.4 billion to the overall increase. German and Canadian multinational enterprises were particularly active, with investments rising by $49.0 billion and $39.2 billion respectively. The manufacturing sector in the U.S. also saw significant gains in FDI, with electrical equipment and components manufacturing leading the charge. These figures, released today by the U.S. Bureau of Economic Analysis (BEA), underscore a dynamic and interconnected global economic landscape shaped by significant cross-border capital flows.
Global Investment Landscape: A Snapshot of 2025
The latest data from the BEA paints a picture of escalating international economic engagement. The total stock of U.S. direct investment abroad, representing the cumulative value of investments made by U.S. entities in foreign businesses where they have significant ownership, saw a notable expansion. This growth, totaling $438.1 billion, brought the overall position to an impressive $7.14 trillion by the close of 2025. A substantial portion of this increase, $350.2 billion, was directed towards European economies. The United Kingdom and Luxembourg, in particular, benefited from this surge, highlighting their continued importance as key hubs for U.S. multinational enterprises (MNEs).
On the inbound side, foreign direct investment in the United States also experienced a significant upswing. The total position increased by $266.0 billion, reaching $5.86 trillion. This inflow of foreign capital reflects the enduring attractiveness of the U.S. market for international businesses. Similar to outward investment trends, Europe played a pivotal role in driving this growth, contributing $182.4 billion to the increase in foreign direct investment within the U.S.
Sectoral Shifts and Key Players
Delving deeper into the sectoral composition of these investments reveals specific areas of robust activity. For U.S. direct investment abroad, the manufacturing sector was a primary beneficiary of increased capital. Within manufacturing, chemical manufacturing stood out as a significant driver of this growth. This suggests a strategic expansion of U.S. companies’ production and operational footprints in key global markets, potentially to access new consumer bases, leverage specialized resources, or optimize supply chains.
Conversely, foreign direct investment in the United States also saw its manufacturing sector experience the most substantial increase. This growth was particularly evident in the electrical equipment and components manufacturing sub-sector, indicating that foreign companies are actively investing in U.S. industrial capabilities and technological advancements. The finance and insurance sectors also saw considerable foreign investment, alongside wholesale trade, underscoring the diverse nature of international capital flows into the U.S. economy.
U.S. Direct Investment Abroad: A Closer Look
The BEA’s detailed statistics reveal that U.S. multinational enterprises (MNEs) maintain a broad global investment reach, with operations in nearly every country. However, a significant portion of this outward investment is concentrated in a select group of nations. In 2025, the top five countries accounted for more than half of the total U.S. direct investment abroad. The United Kingdom held the largest share, with a cumulative investment position of $1,114.7 billion. Following closely were the Netherlands ($1,044.0 billion), Luxembourg ($645.3 billion), Ireland ($511.9 billion), and Canada ($488.1 billion). These figures underscore the enduring importance of established economic partnerships and strategic geographical locations for U.S. global business operations.
Industry Distribution of U.S. Outward Investment
Examining the industry breakdown of foreign affiliates directly owned by U.S. entities provides further insight. Holding companies represented the largest share of U.S. direct investment abroad in 2025, accounting for 45.8 percent of the overall position. This suggests a significant role for financial and management structures in facilitating global business operations. Manufacturing affiliates followed, comprising 15.9 percent of the total, reinforcing the importance of production and industrial activities in U.S. foreign direct investment. Finance and insurance affiliates were the third-largest category, representing 13.5 percent of U.S. investment abroad.
When viewed from the perspective of the U.S. parent companies, manufacturing MNEs were the most significant investors, contributing 50.2 percent of the total position abroad. MNEs in the finance and insurance sectors were the next largest group, accounting for 15.8 percent of U.S. outward investment. This duality in reporting—by industry of the foreign affiliate and by industry of the U.S. parent—offers a comprehensive view of the structure and drivers of U.S. foreign direct investment.
Income Generation from U.S. Investments Abroad
In 2025, U.S. MNEs generated substantial income from their cumulative investments abroad, totaling $660.1 billion. This represented an 11.1 percent increase compared to the income earned in 2024, signaling a healthy return on foreign assets. The growth in income was most pronounced in holding companies, which saw an increase of $40.0 billion. Conversely, income from investments in the finance and insurance sectors experienced a slight decline, falling by $6.3 billion compared to the previous year. This nuanced performance across sectors highlights the varied economic dynamics at play within the global investment portfolio of U.S. corporations.
Foreign Direct Investment in the United States: A Global Attraction
The United States continues to be a prime destination for foreign capital. By country of foreign parent, four nations accounted for over half of the total FDI position in the U.S. in 2025. Japan emerged as the leading investing country, with a position of $776.3 billion. The Netherlands followed closely at $751.8 billion, with Canada at $747.3 billion and the United Kingdom at $738.3 billion rounding out the top four. These figures reflect strong, long-standing investment relationships between the U.S. and these major global economies.
The Nuances of Ultimate Beneficial Ownership
A more granular analysis, considering the country of the ultimate beneficial owner (UBO)—the entity at the apex of the global ownership chain—provides additional layers of understanding. On a UBO basis, Japan remained the top investing country with $827.1 billion. Canada secured the second position with $819.8 billion, followed by Germany with $706.2 billion. Notably, the investment figures from the Netherlands and Luxembourg were considerably lower when analyzed by UBO compared to their reported positions as foreign parents. This discrepancy suggests that a significant portion of investment channeled through these financial hubs is ultimately owned by investors based in other countries, illustrating the complex and often multi-layered nature of international capital flows.
Industry Concentration of Foreign Investment
The industrial distribution of FDI in the United States reveals a strong concentration within the U.S. manufacturing sector, which accounted for 42.8 percent of the total foreign direct investment position. Within this substantial $2.51 trillion invested in U.S. manufacturing, chemical manufacturing represented a significant portion, comprising one-third of the total, or $835.9 billion. Beyond manufacturing, considerable foreign investment was also directed towards the finance and insurance sectors ($629.7 billion) and wholesale trade ($534.0 billion), demonstrating the broad appeal of the U.S. economy across key industries.
Income Generated by Foreign Investors in the U.S.
Foreign multinational enterprises earned $310.1 billion in income from their cumulative investments in the United States in 2025. This figure represents a slight decrease of 1.9 percent compared to the income earned in 2024. While overall income saw a modest dip, this can be attributed to various market factors and the cyclical nature of economic returns across different sectors.
Historical Context and Revisions
The BEA’s release also includes revisions to previously published statistics, offering a more accurate historical perspective on direct investment trends. These revisions are crucial for understanding the long-term trajectory of U.S. and foreign direct investment. For instance, statistics for U.S. direct investment abroad from 2023-2024 and foreign direct investment in the United States from 2022-2024 have been updated to incorporate newly available and revised source data. These updates ensure the accuracy and reliability of the economic data, providing policymakers, businesses, and researchers with the most current and comprehensive information available for strategic decision-making. The table below summarizes these revisions:
| Year | U.S. Direct Investment Abroad (Previously Published) | U.S. Direct Investment Abroad (Revised) | Foreign Direct Investment in the U.S. (Previously Published) | Foreign Direct Investment in the U.S. (Revised) |
|---|---|---|---|---|
| 2022 | …. | …. | 5,124 | 5,110 |
| 2023 | 6,620 | 6,598 | 5,376 | 5,338 |
| 2024 | 6,827 | 6,698 | 5,708 | 5,598 |
Note: U.S. direct investment abroad data not revised for 2022.
Broader Economic Implications and Future Outlook
The significant growth in both outward U.S. direct investment and inbound foreign direct investment in 2025 underscores the interconnectedness of the global economy and the continued importance of international capital flows for economic development and expansion. The strong performance in manufacturing sectors, both domestically and abroad, suggests a robust global demand for goods and a strategic focus on production capabilities. The substantial role of holding companies in U.S. outward investment highlights the sophisticated financial architectures employed by multinational corporations to manage their global operations.
The leading positions of countries like the United Kingdom, Netherlands, Japan, and Canada in direct investment flows indicate their central roles in the global economic system. The analysis of Ultimate Beneficial Owners further illuminates the complex networks of global finance, revealing how capital can be channeled through various jurisdictions before reaching its final investment destination.
For the United States, the sustained inflow of foreign direct investment signifies ongoing confidence in the U.S. economy’s stability, innovation potential, and market size. This investment contributes to job creation, technological advancement, and overall economic productivity. The slight decrease in income earned by foreign investors in the U.S. in 2025, while notable, does not detract from the overall strength and attractiveness of the U.S. as an investment destination.
The BEA’s commitment to refining its data through updated disclosure avoidance methods, including rounding and aggregation, aims to provide a more comprehensive and accessible dataset while maintaining respondent confidentiality. This approach allows for the publication of more granular economic insights, which are invaluable for understanding complex financial flows.
Looking ahead, the BEA plans to release the next comprehensive update on Direct Investment by Country and Industry in July 2027, covering data for 2026. This ongoing data collection and analysis will be critical for monitoring evolving global investment trends, informing economic policy, and understanding the dynamic interplay of national economies in the years to come. The continued robustness of direct investment flows suggests an ongoing commitment to international economic integration, with significant implications for global trade, employment, and technological diffusion.








