Lana Rhoades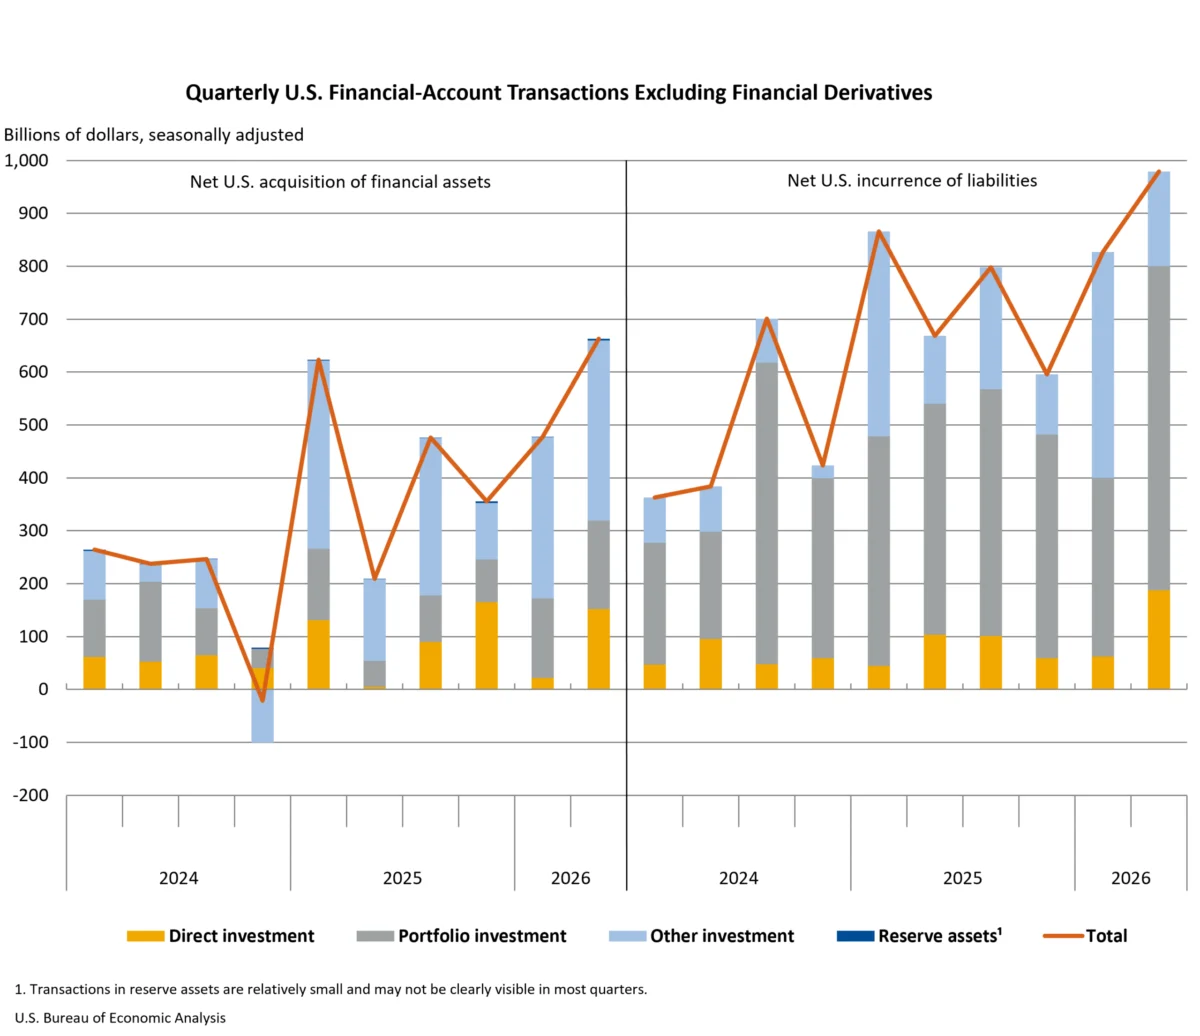
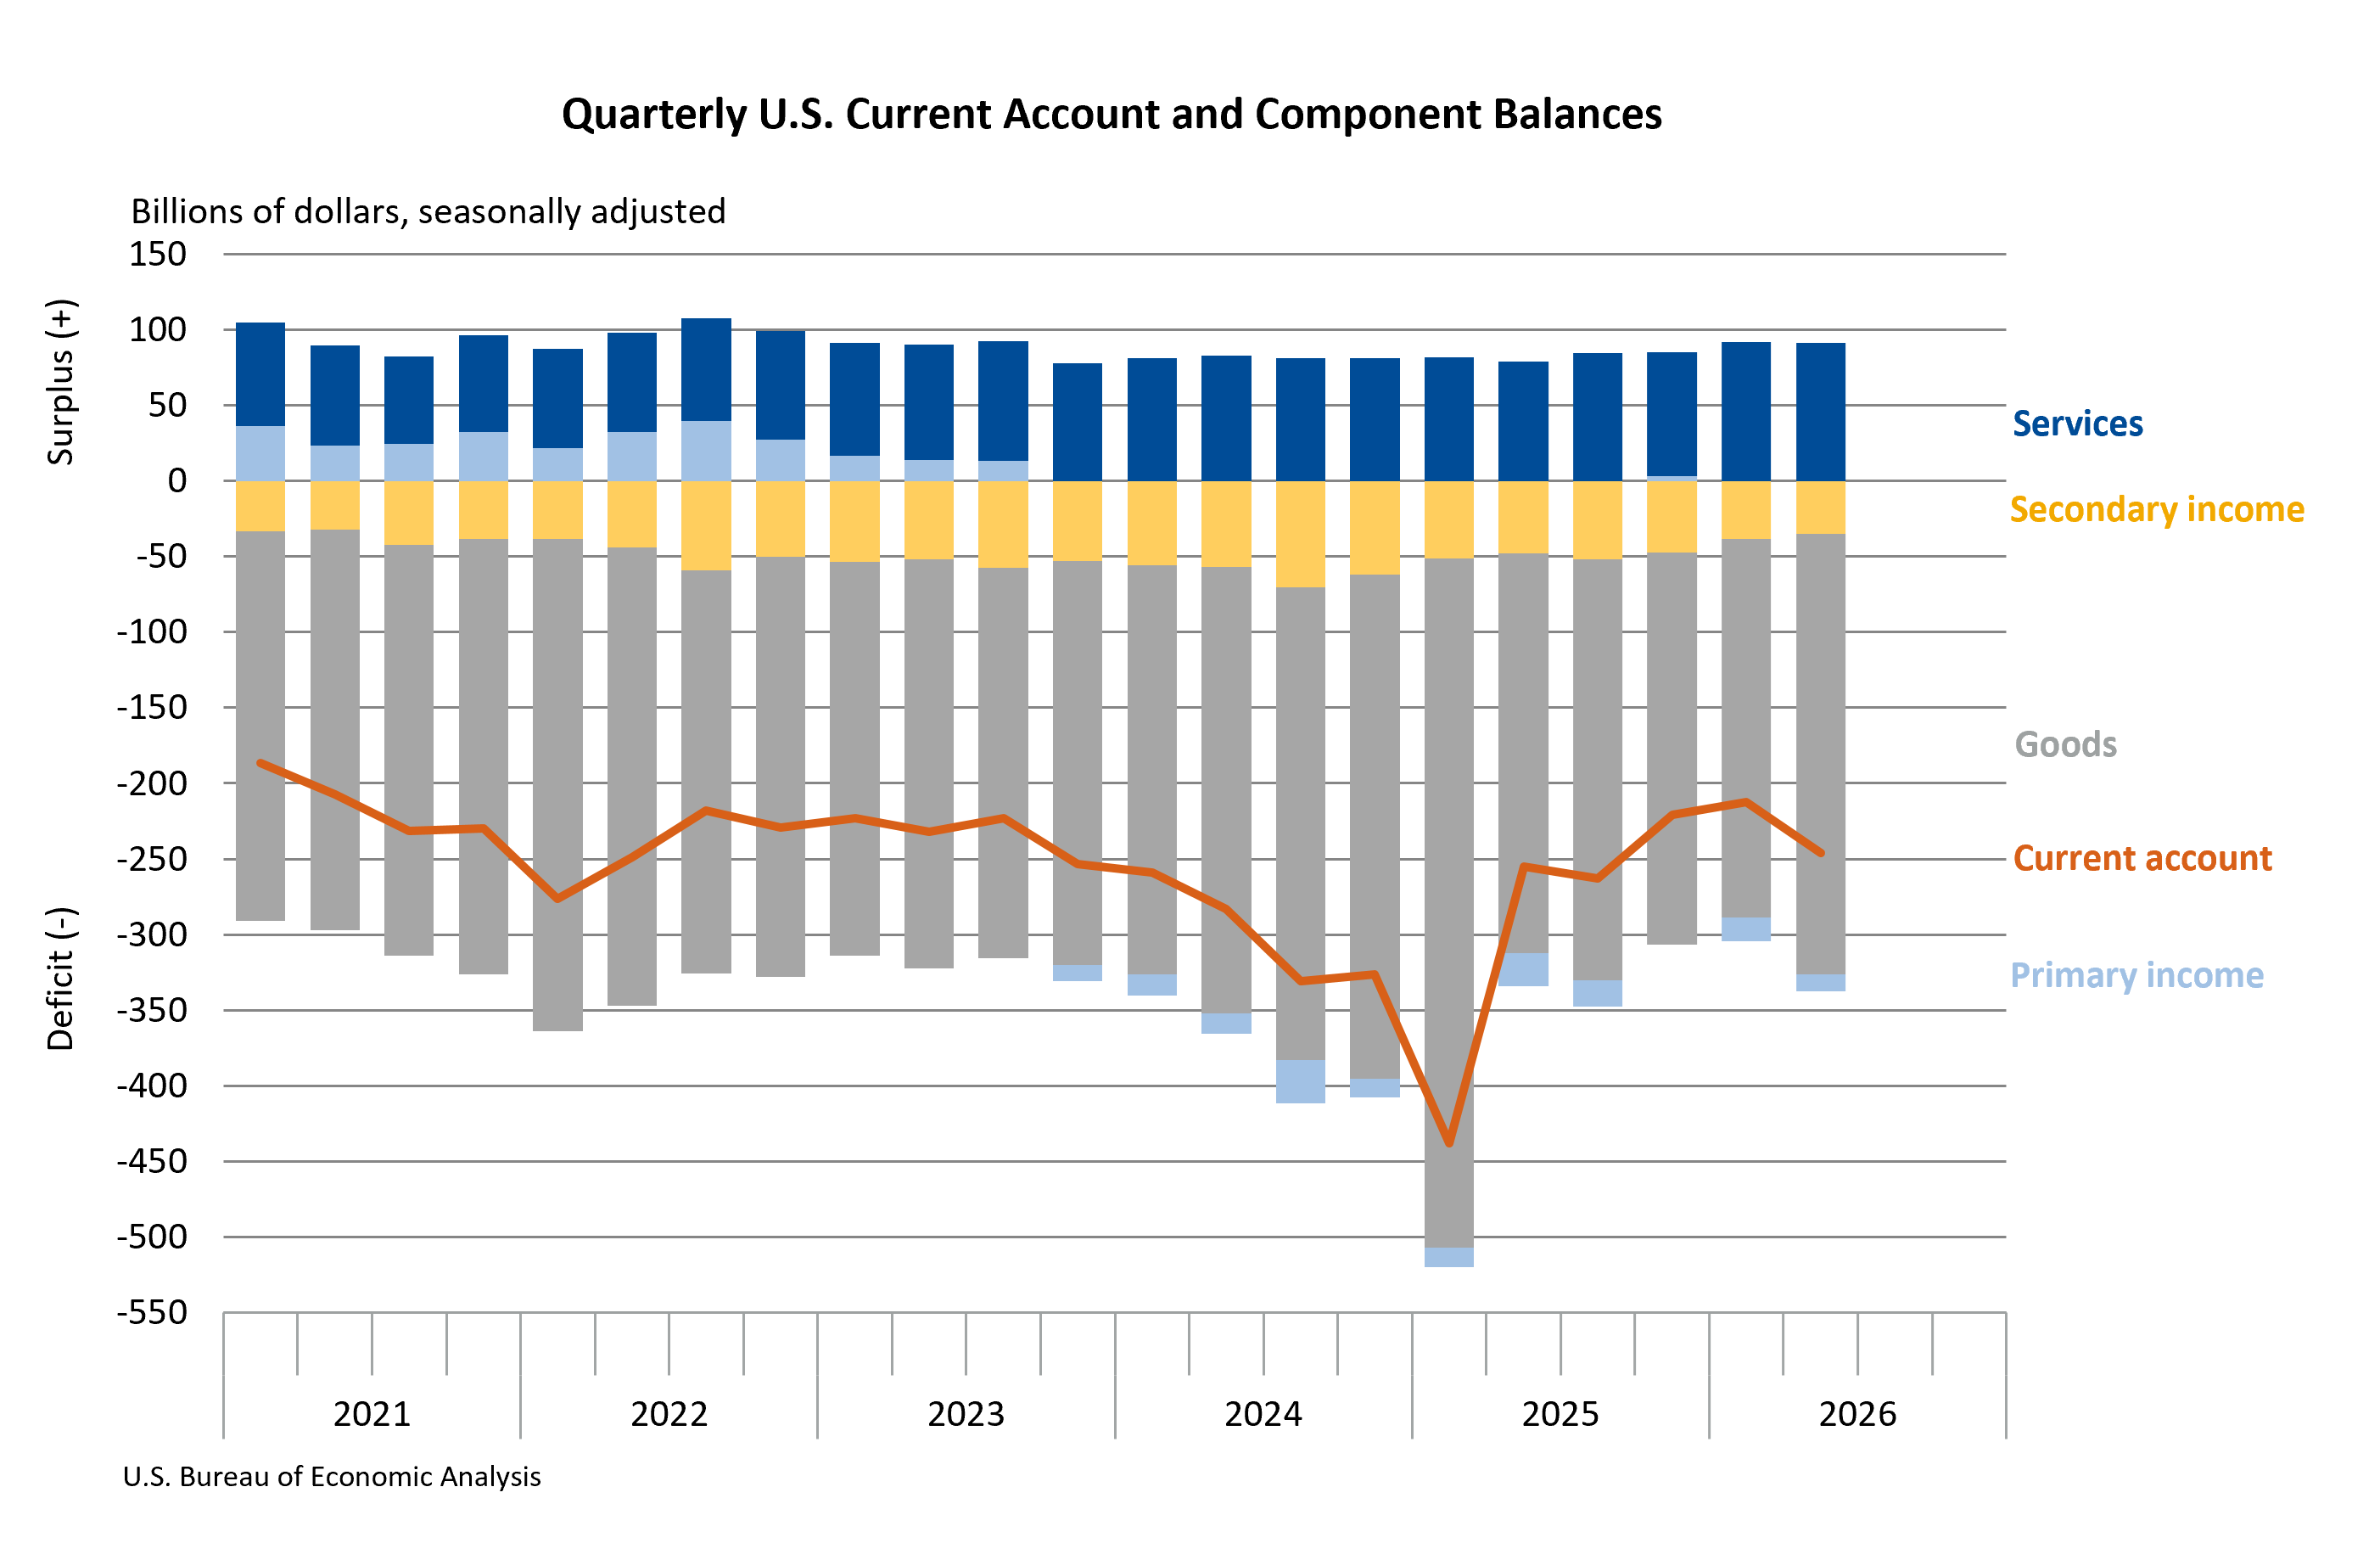
The U.S. current-account deficit, a key measure of a nation’s international economic transactions, expanded by $33.4 billion, or 15.7 percent, to reach $246.0 billion in the second quarter of 2026. This widening, as reported by the U.S. Bureau of Economic Analysis (BEA), signals an increasing imbalance in the country’s trade in goods and services, income flows, and transfers with the rest of the world. The revised deficit for the first quarter of 2026 stood at $212.6 billion, indicating a clear upward trend in the deficit.
Deepening Deficit Reflects Economic Interconnectedness
The current-account deficit in the second quarter represented 3.0 percent of the U.S. dollar-denominated gross domestic product (GDP), an increase from 2.7 percent in the preceding quarter. This metric provides crucial insight into the nation’s financial relationship with the global economy. A widening current-account deficit generally suggests that a country is importing more goods and services, and paying out more in income and transfers, than it is earning from exports and receiving in income and transfers.
The primary driver behind this significant quarterly expansion was a substantial increase in the deficit on goods. This indicates that the value of goods imported into the United States outpaced the value of goods exported by a larger margin during the second quarter. While this trend exerted upward pressure on the overall deficit, it was partially mitigated by a reduction in deficits related to primary (earned) income and secondary income (current transfers).
Breakdown of Transactional Flows
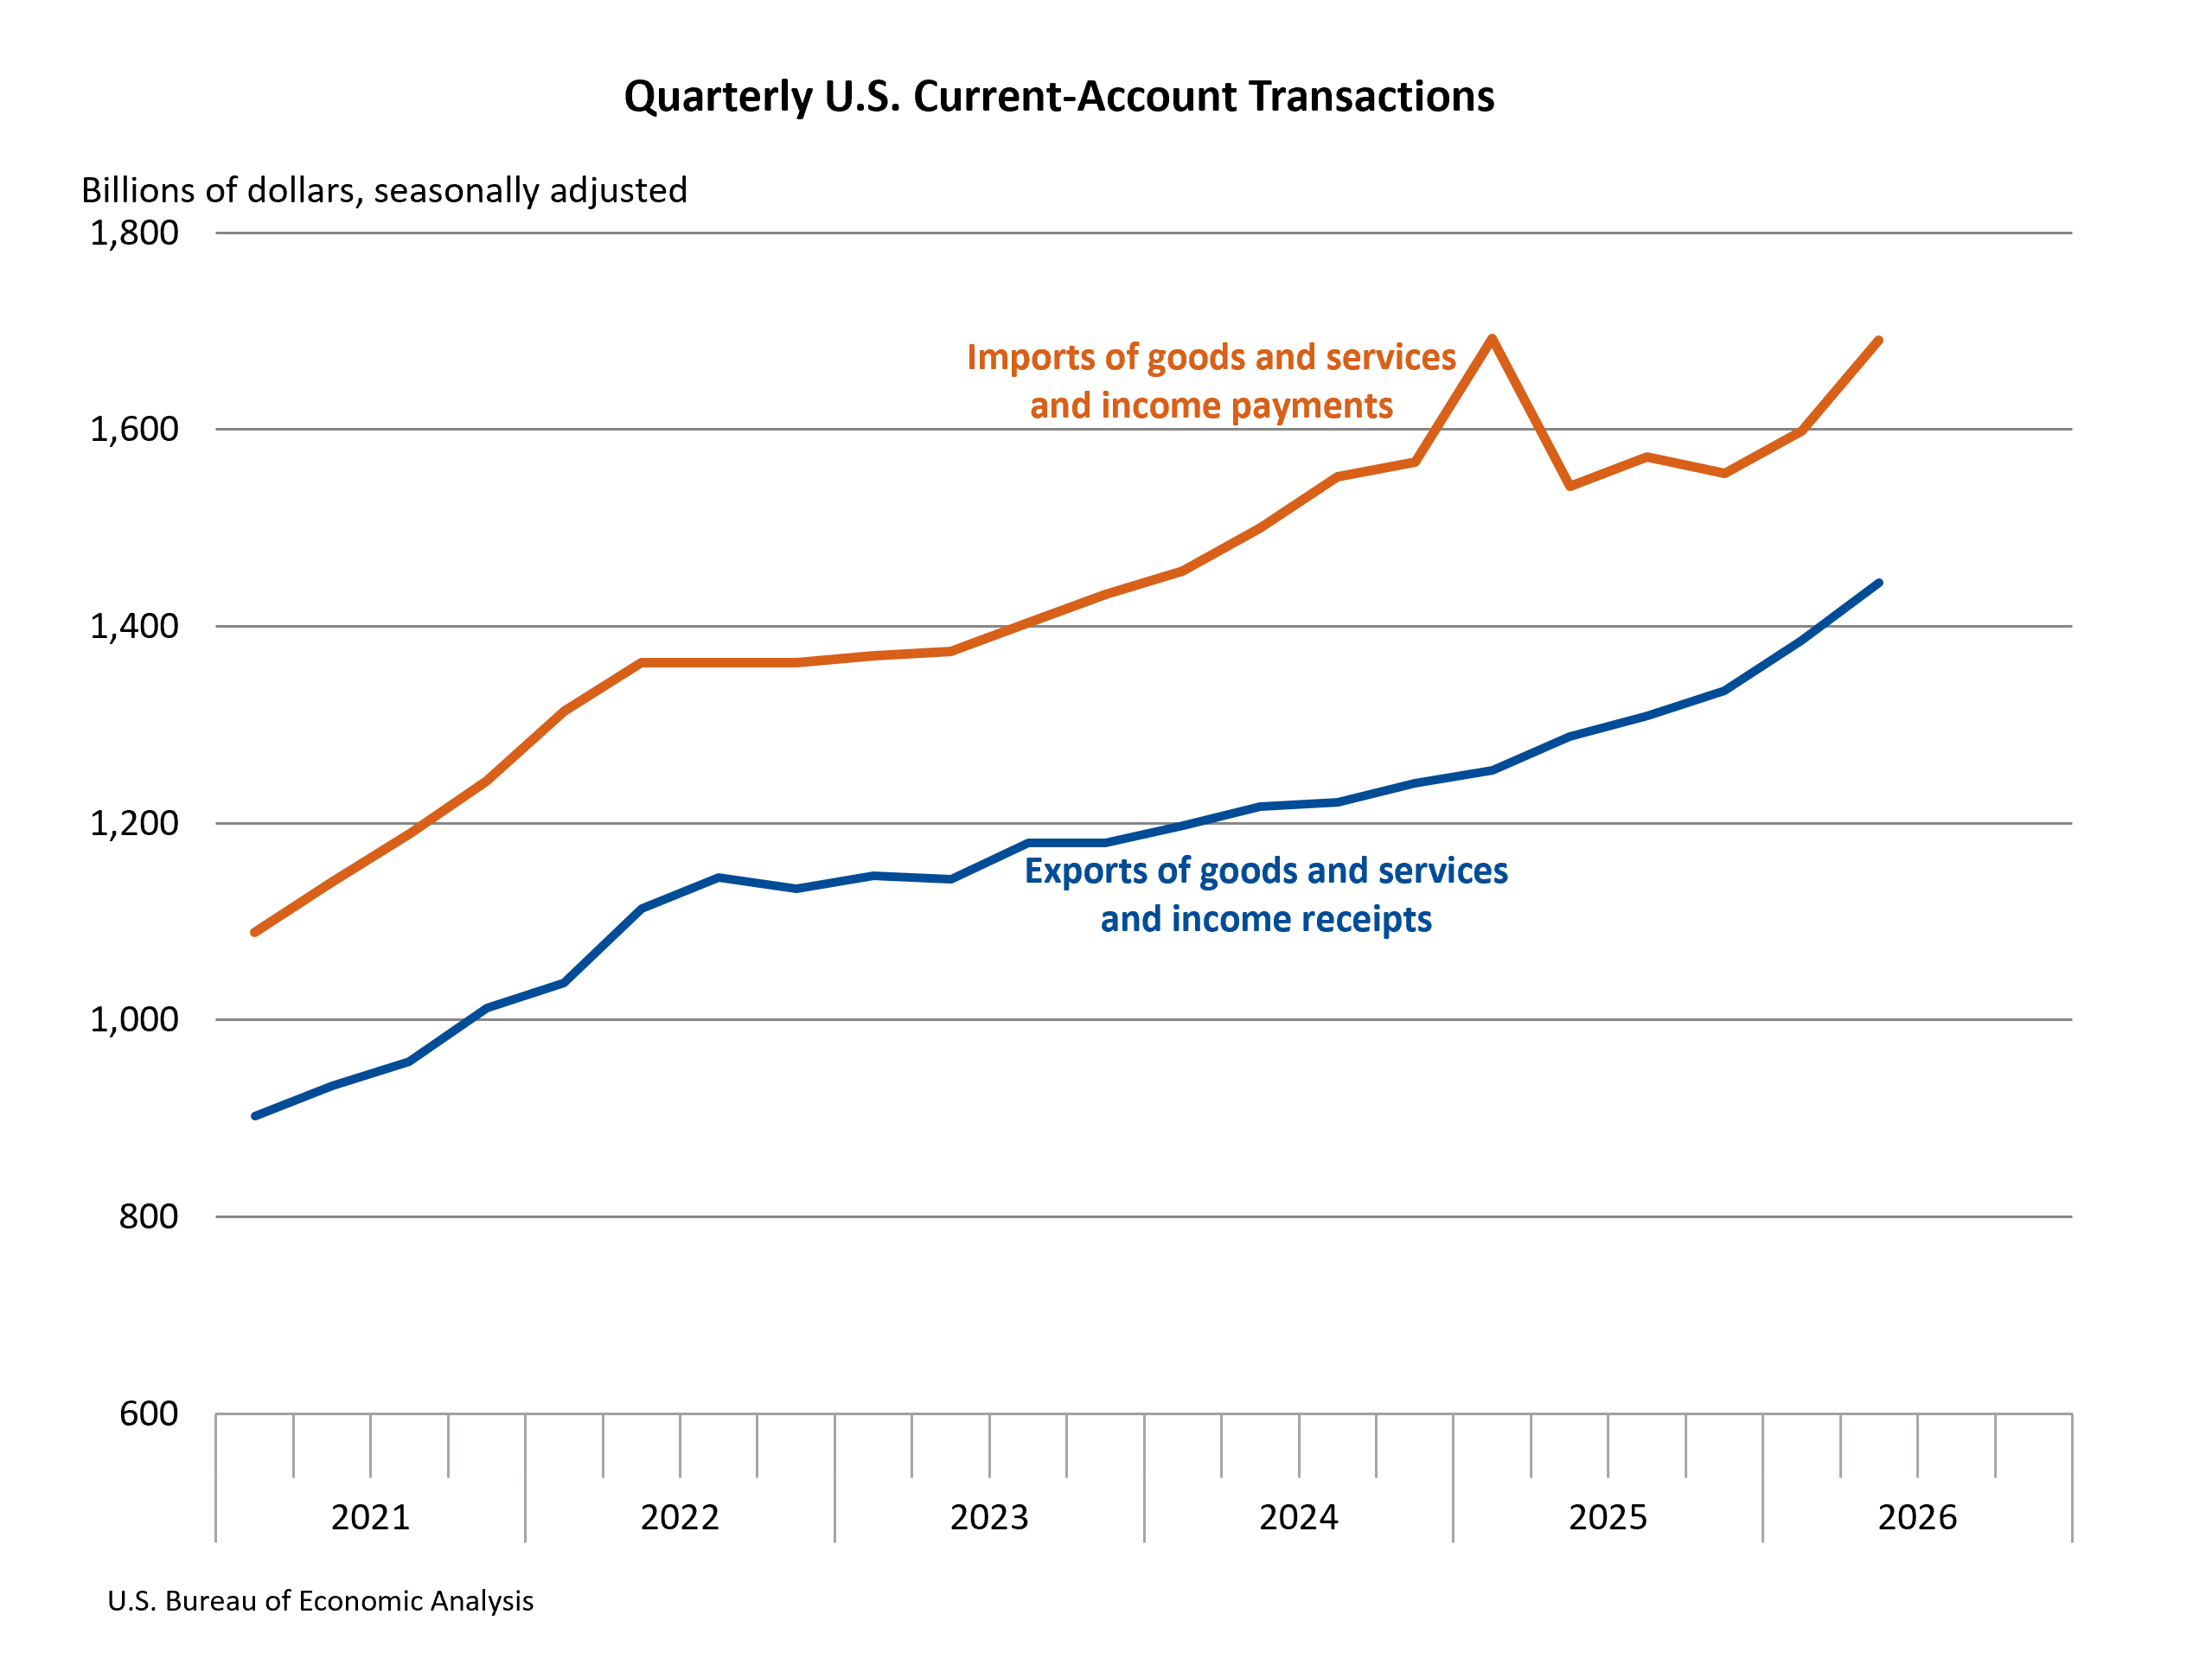
The BEA data reveals a robust increase in overall international transactions during the second quarter. Exports of goods and services, along with income received from foreign residents, collectively rose by $58.8 billion to a total of $1.44 trillion. This surge was primarily attributed to growth in the export of goods and an increase in primary income receipts, which includes earnings from foreign investments.
Conversely, imports of goods and services, and income paid to foreign residents, experienced an even larger increase, climbing by $92.2 billion to $1.69 trillion. This expansion was largely fueled by a rise in goods imports and an increase in primary income payments, such as profits and interest paid to foreign investors. The net effect of these opposing movements in exports and imports resulted in the widening of the goods deficit and, consequently, the overall current-account deficit.
Secondary income, which encompasses current transfers like remittances and foreign aid, also played a role, though its impact was less pronounced. The deficit on secondary income narrowed, suggesting a decrease in net outflows of these transfers compared to the previous quarter. Similarly, the deficit on primary income also saw a reduction, indicating that the growth in income received from abroad outpaced the growth in income paid abroad.
Capital transfers, which are distinct from current transfers and involve the transfer of ownership of fixed assets or the forgiveness of liabilities, saw a decline. Capital-transfer receipts decreased by $1.1 billion to $2.3 billion, and capital-transfer payments fell by $0.9 billion to $1.0 billion. These movements had a minimal impact on the overall current-account balance.
Financial Account Dynamics and Net International Investment Position
The financial account, which tracks the flow of financial assets and liabilities between the U.S. and the rest of the world, presented a complex picture. Net financial-account transactions in the second quarter resulted in a deficit of $369.7 billion. This figure signifies net U.S. borrowing from foreign residents, meaning that liabilities incurred by U.S. residents to foreigners exceeded the financial assets acquired by U.S. residents from abroad.
During the second quarter, U.S. residents’ holdings of foreign financial assets increased by $663.3 billion. Concurrently, U.S. liabilities to foreign residents escalated significantly, growing by $978.9 billion. This substantial increase in liabilities underscores the growing reliance on foreign capital to finance domestic economic activities and investments.
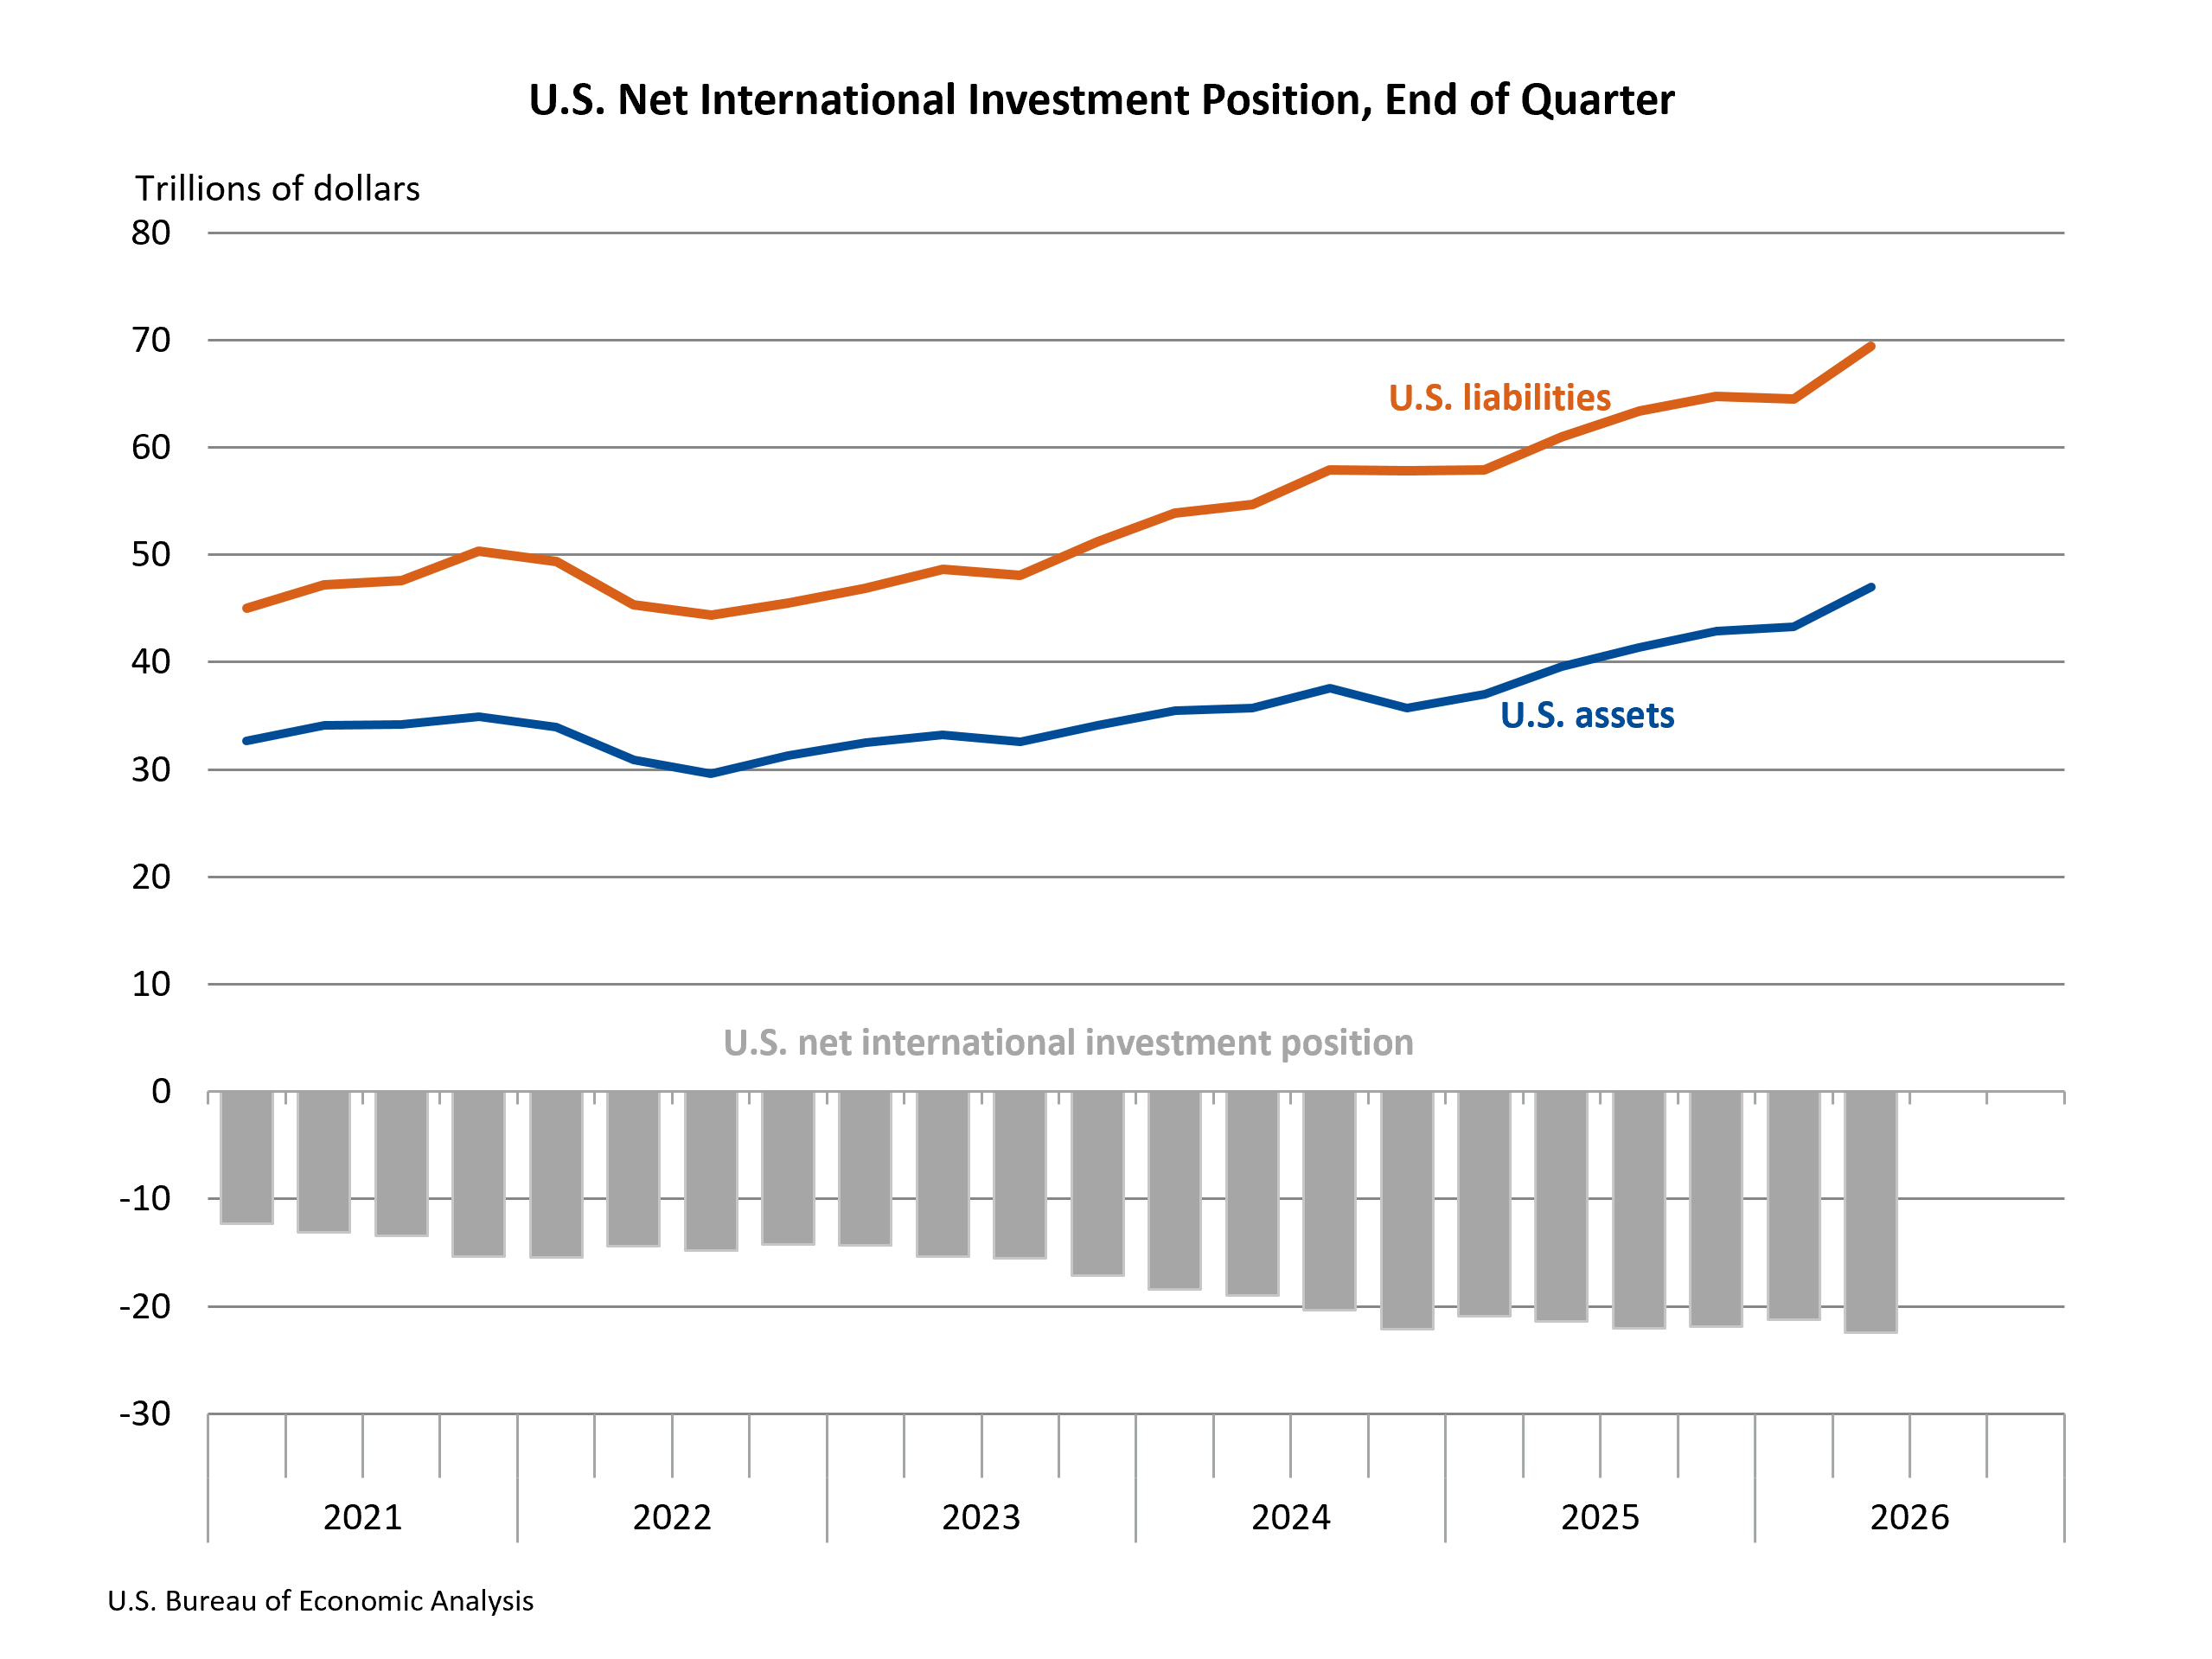
The cumulative effect of these international transactions is reflected in the U.S. net international investment position, which represents the difference between U.S. residents’ foreign financial assets and liabilities. At the close of the second quarter of 2026, this net position stood at a deficit of $22.42 trillion. This figure, while large, represents a slight deterioration from the revised preliminary estimate of -$21.27 trillion at the end of the first quarter.
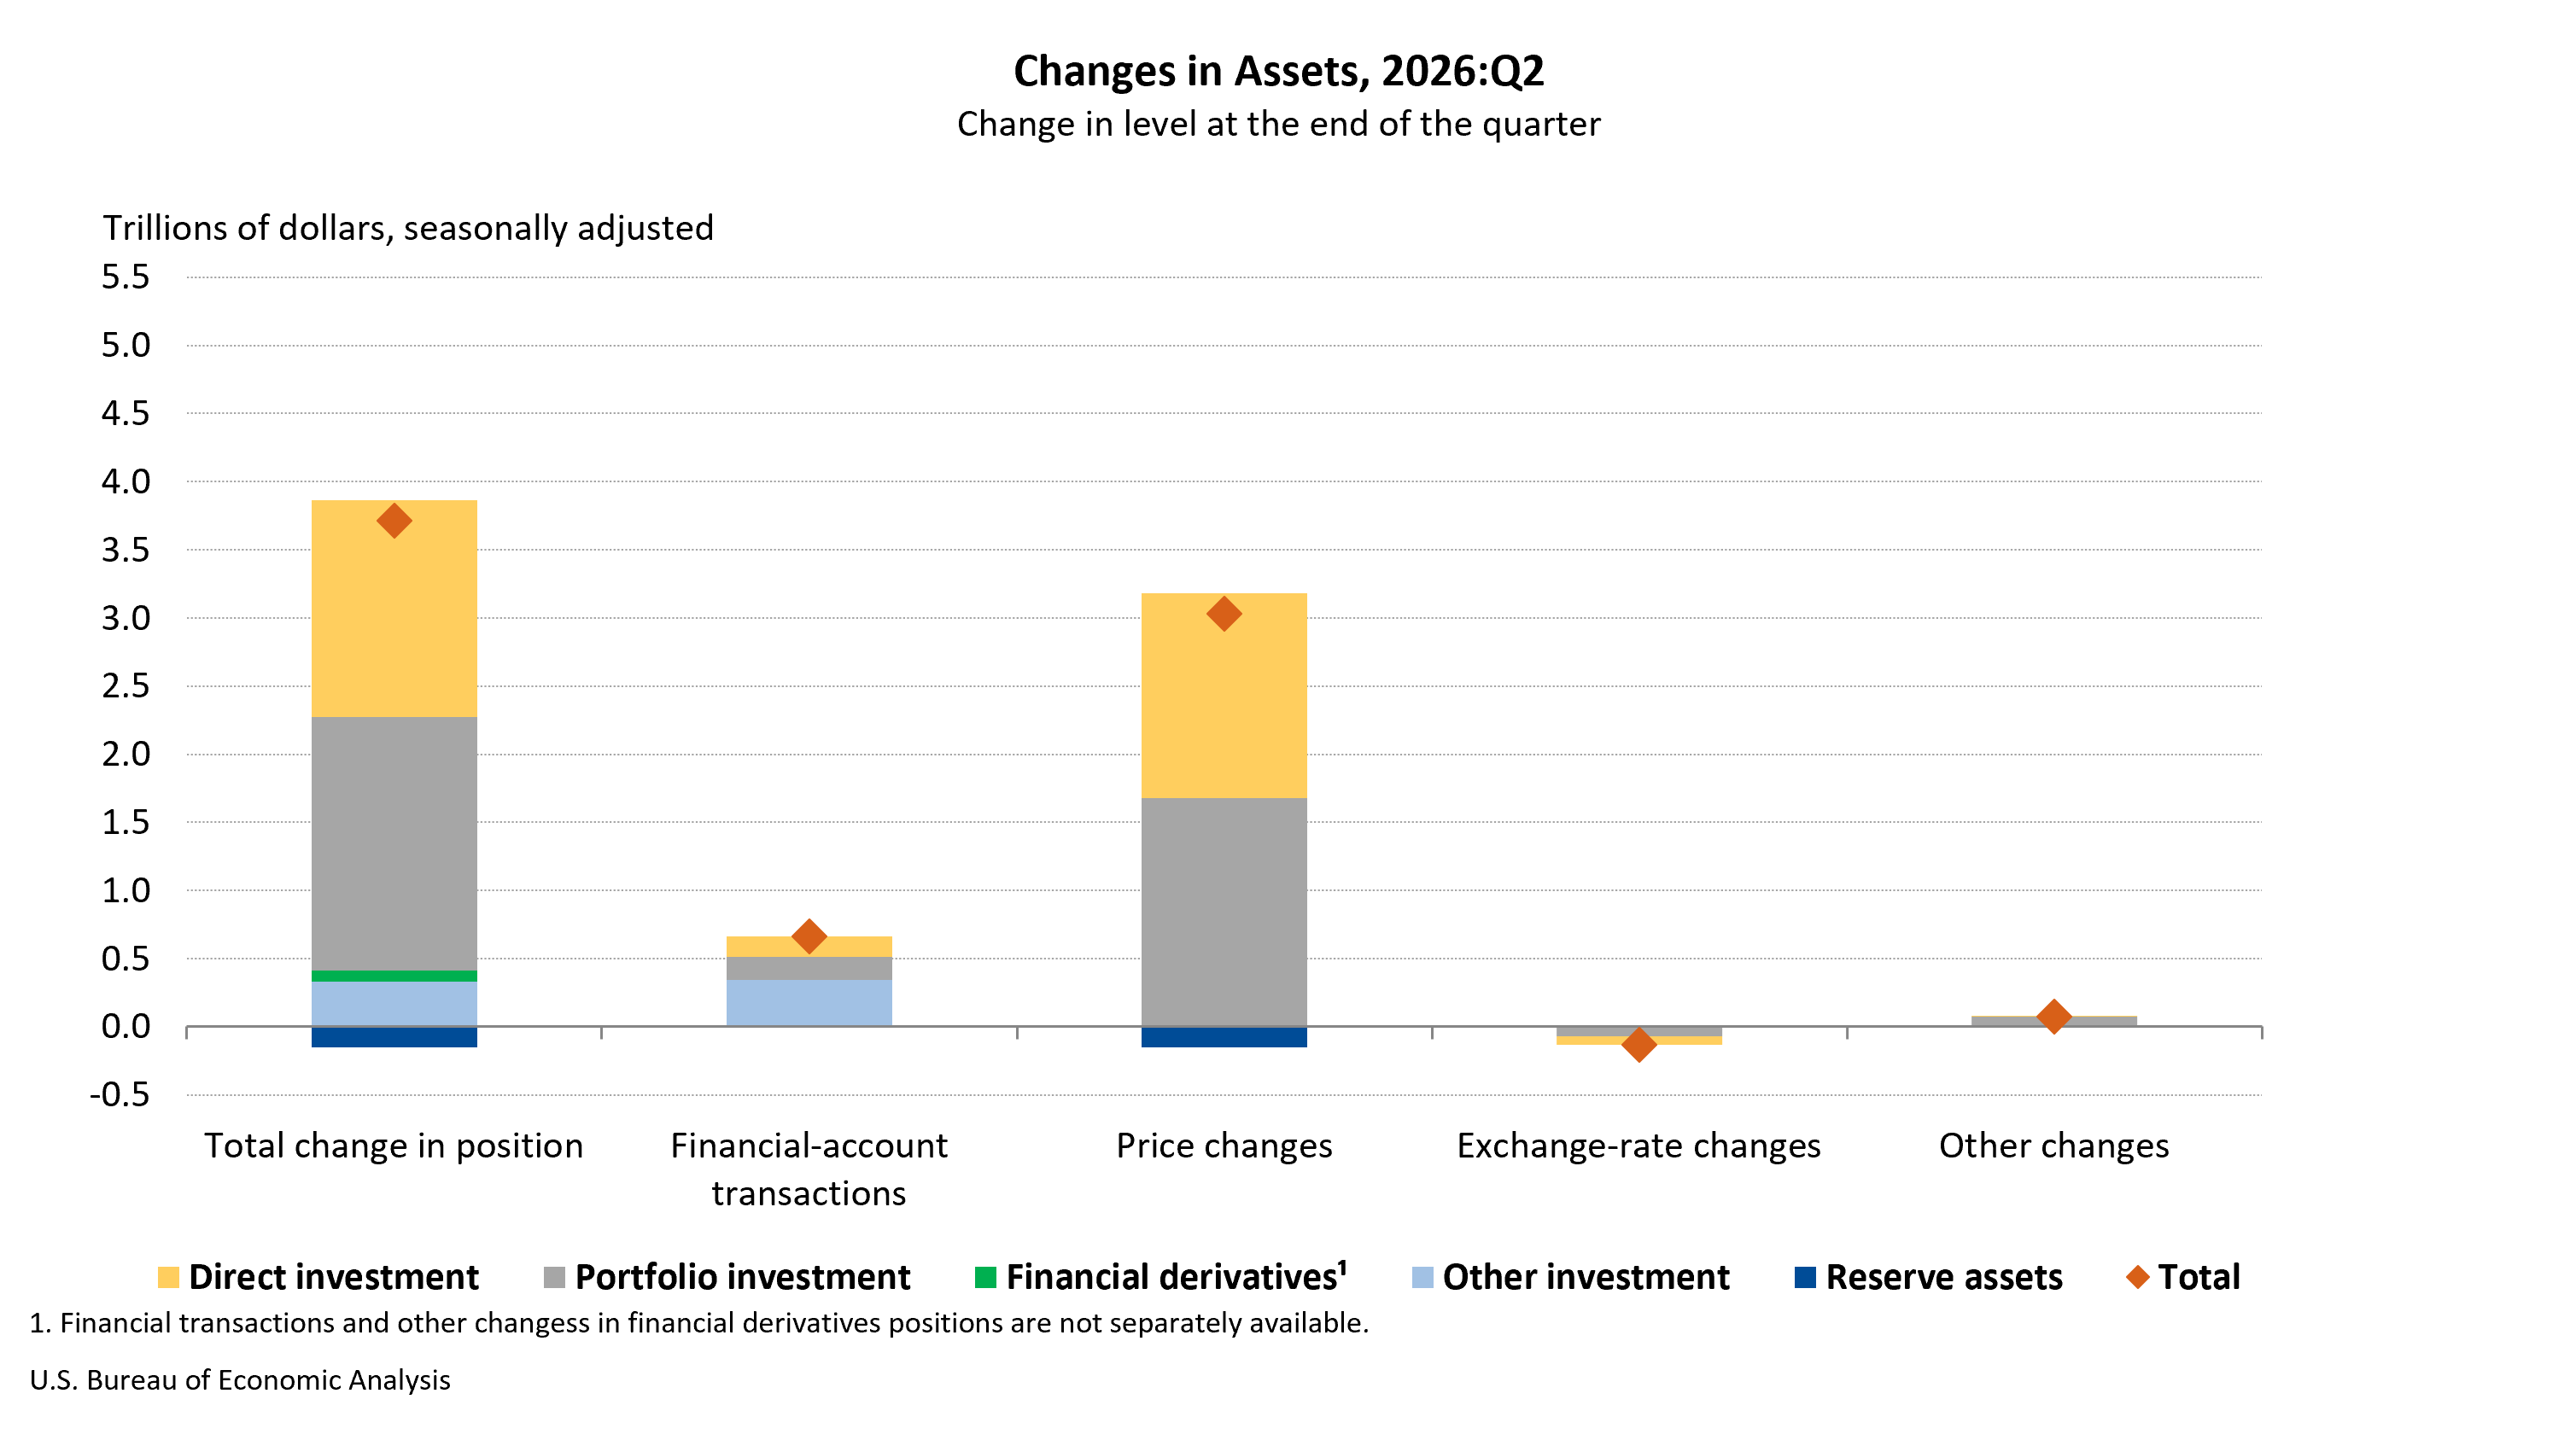
Breaking down the investment position further, U.S. assets abroad totaled $46.97 trillion, while U.S. liabilities to foreigners amounted to $69.39 trillion. The increase in U.S. assets during the second quarter was $3.72 trillion, driven by increases across most major investment categories, with the exception of reserve assets. This growth was significantly influenced by price changes, which contributed $3.03 trillion, alongside financial transactions amounting to $663.3 billion.
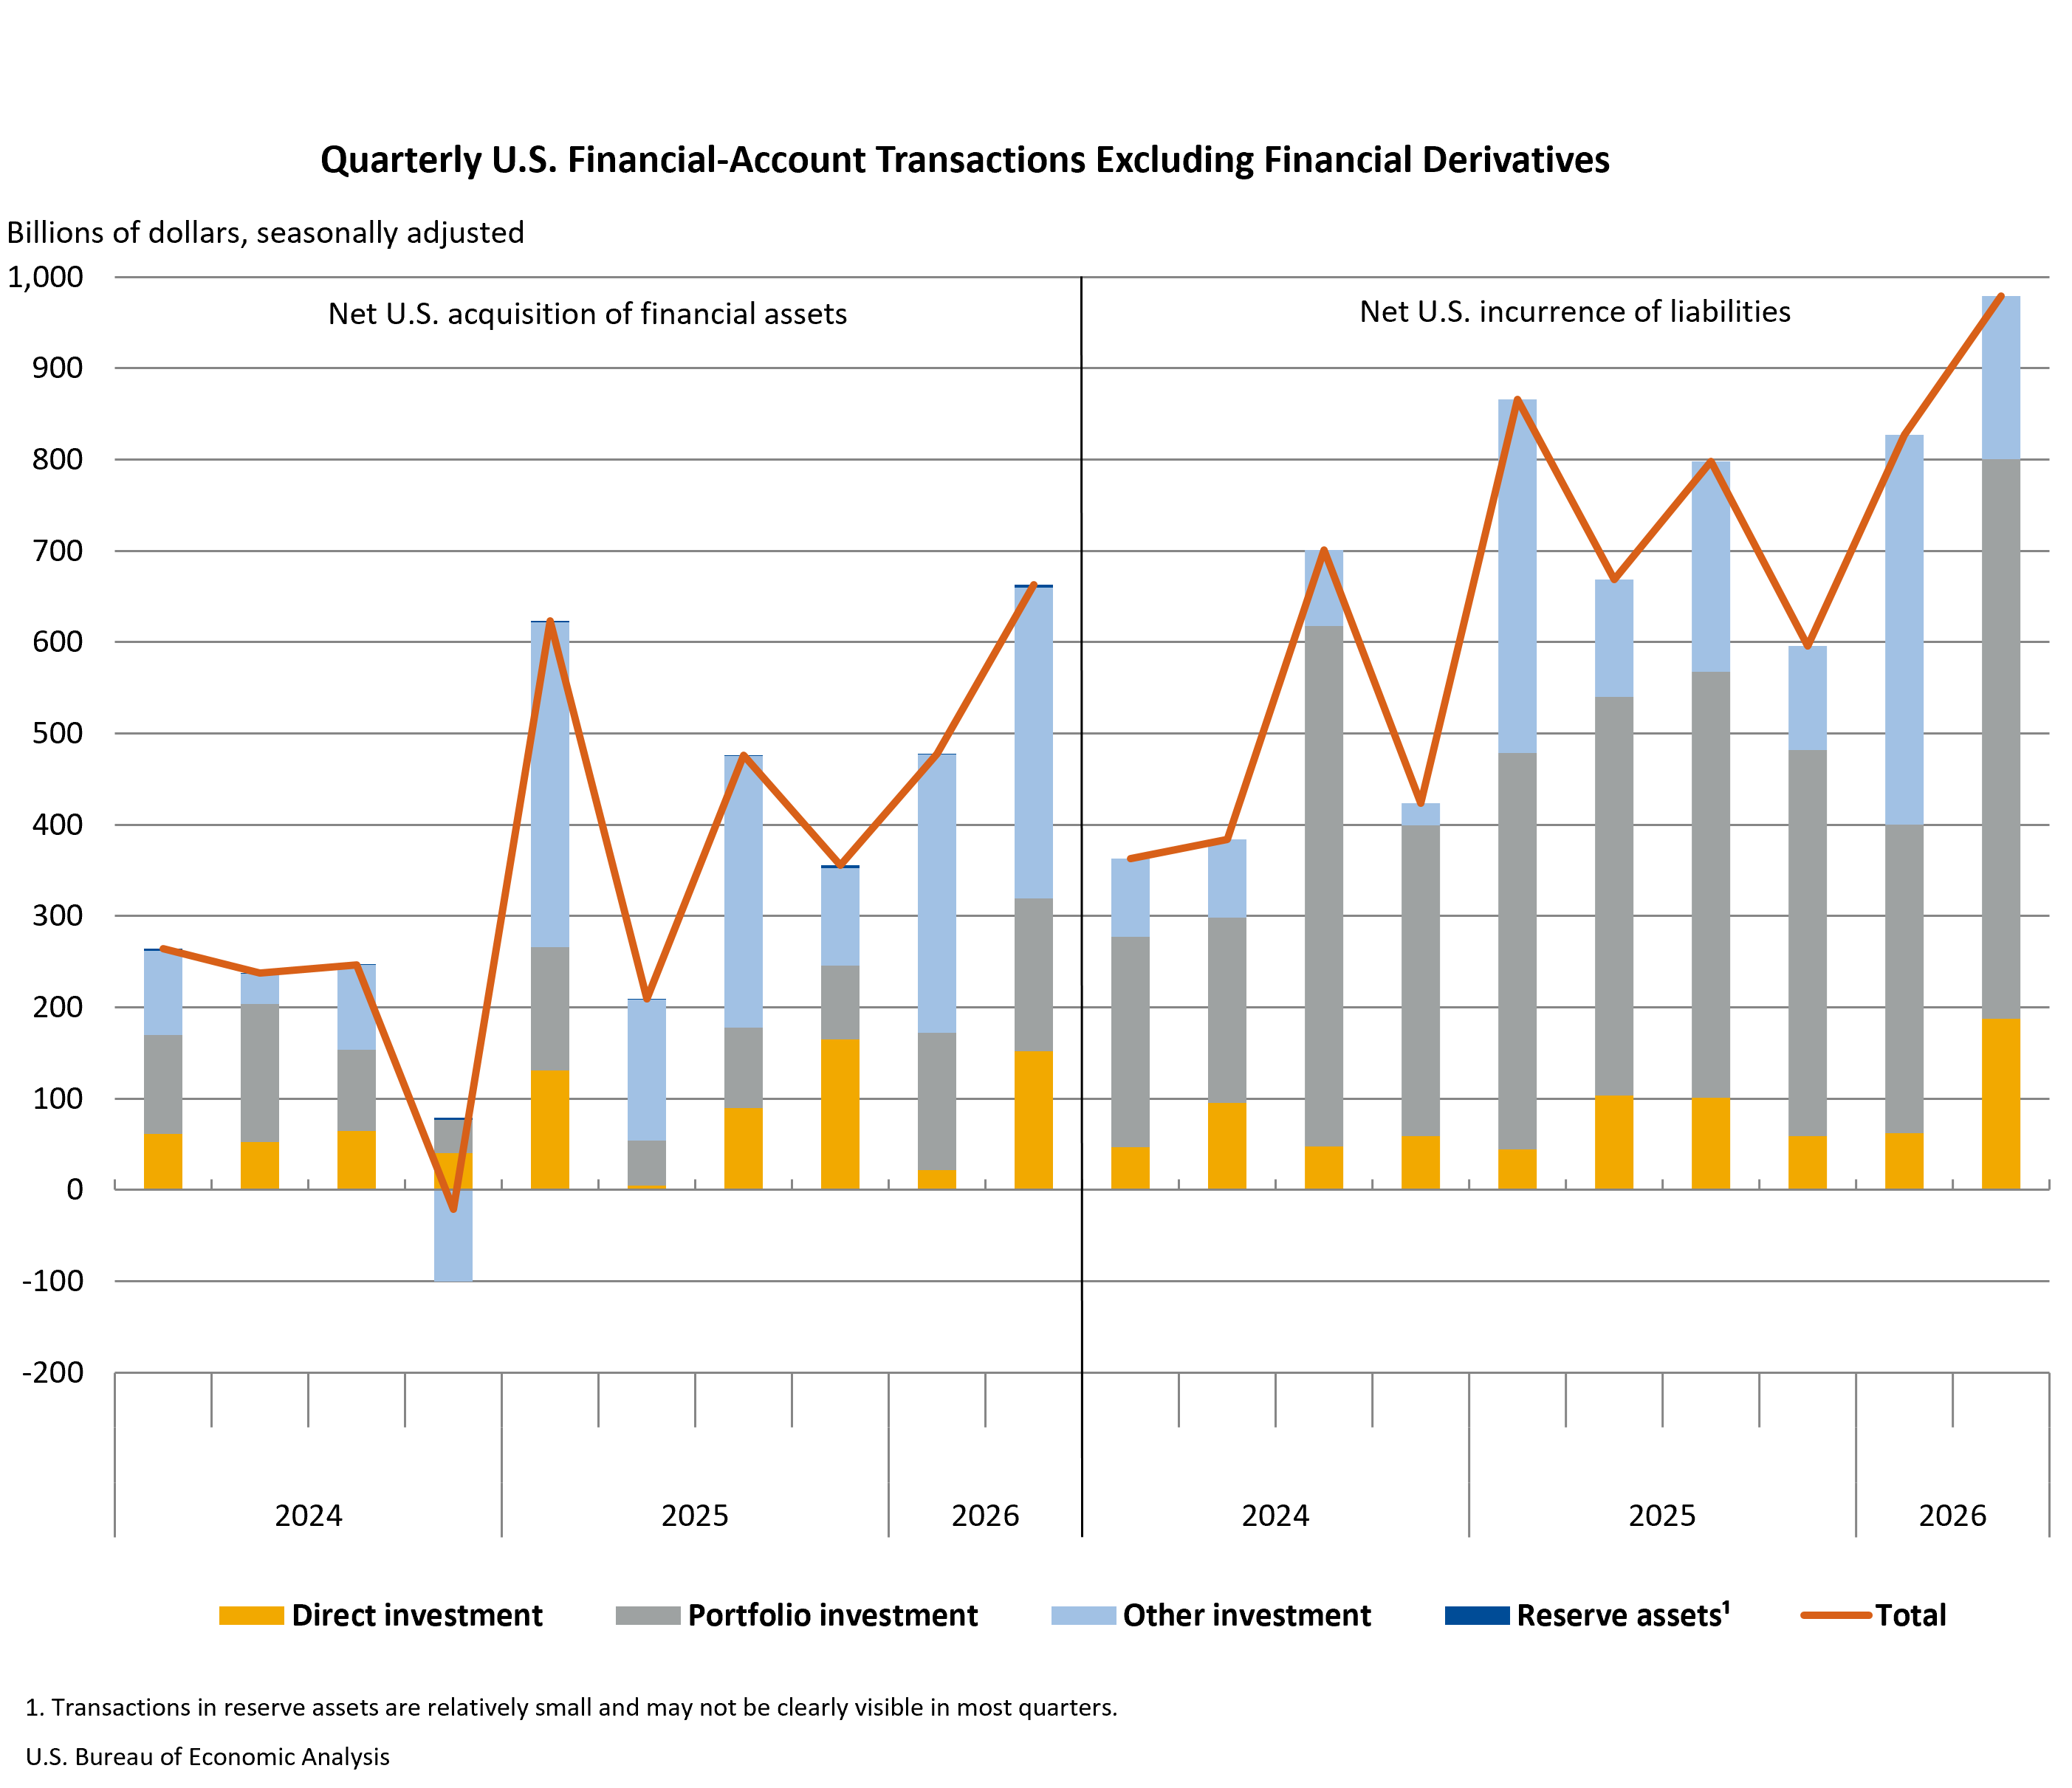
In parallel, U.S. liabilities saw a more substantial increase of $4.87 trillion. This rise was broadly distributed across all major investment categories, with portfolio investment experiencing a notable expansion. Similar to assets, price changes played a significant role, contributing $3.95 trillion to the increase in liabilities, with financial transactions accounting for the remaining $978.9 billion. The greater increase in liabilities compared to assets contributed to the widening net investment position deficit.
Context and Historical Trends
The widening current-account deficit is not an isolated event but part of a broader trend that has characterized the U.S. economy for decades. Factors such as higher consumer demand for imported goods, the U.S. dollar’s status as a global reserve currency, and the country’s attractiveness as an investment destination have historically contributed to persistent deficits.
Economists often analyze the current-account balance in conjunction with the financial account. A current-account deficit must, by definition, be financed by a net inflow of capital, meaning a surplus in the financial account. In the second quarter of 2026, the current-account deficit of $246.0 billion was financed by a net financial account deficit of $369.7 billion, indicating that the inflow of foreign capital exceeded the current-account deficit, leaving a net increase in U.S. liabilities to foreigners.
Analysis and Implications
The sustained widening of the current-account deficit can have several implications for the U.S. economy.
- Increased Foreign Debt: A larger deficit implies a greater accumulation of foreign debt or a reduction in foreign assets. This can lead to increased interest payments to foreign creditors in the future, potentially impacting national income.
- Exchange Rate Pressures: Persistent current-account deficits can, over the long term, put downward pressure on the U.S. dollar. However, the dollar’s role as a safe-haven currency and its global reserve status often mitigate these pressures.
- Economic Vulnerability: A high level of dependence on foreign capital can make the U.S. economy more vulnerable to shifts in global investor sentiment and capital flows. Sudden withdrawals of foreign investment could lead to financial instability.
- Trade Policy Considerations: The ongoing imbalance in goods trade, a primary driver of the deficit, will likely continue to be a focal point for trade policy discussions, potentially leading to debates about tariffs, trade agreements, and industrial policy.
Revisions to First Quarter Data
The BEA also provided revised estimates for the first quarter of 2026, offering a clearer picture of the preceding period’s economic activity.
International Transactions Accounts Balances (First Quarter 2026 Revisions):
| Balance Type | Preliminary Estimates (Billions USD) | Revised Estimates (Billions USD) |
|---|---|---|
| Current-account balance | -226.8 | -212.6 |
| Goods balance | -250.9 | -250.9 |
| Services balance | 85.1 | 92.1 |
| Primary income balance | -13.3 | -15.8 |
| Secondary income balance | -47.8 | -38.0 |
| Net financial-account transactions | -209.0 | -295.2 |
The revisions show that the current-account deficit in the first quarter was somewhat smaller than initially estimated, primarily due to upward revisions in the services balance and a reduction in the secondary income deficit. However, the net financial-account transactions deficit was significantly larger than previously reported, indicating a greater net inflow of foreign capital in the first quarter.
International Investment Position Aggregates (First Quarter 2026 Revisions):
| Position Type | Preliminary Estimates (Trillions USD) | Revised Estimates (Trillions USD) |
|---|---|---|
| U.S. net international investment position | -21.27 | -21.27 |
| U.S. assets | 43.37 | 43.25 |
| U.S. liabilities | 64.64 | 64.52 |
The revisions to the first-quarter international investment position were minimal, with the net position remaining unchanged at -$21.27 trillion. Slight adjustments were made to the preliminary estimates of U.S. assets and liabilities.
Future Outlook and Data Release
The U.S. Bureau of Economic Analysis regularly updates these figures, with the next release of third-quarter 2026 International Transactions and Investment Position statistics scheduled for December 18, 2026, at 8:30 a.m. EST. These upcoming figures will provide further insights into the continuing evolution of the U.S. economy’s engagement with the global marketplace. The BEA’s interactive data application and data archive serve as valuable resources for researchers and the public seeking detailed historical and current data on U.S. international economic activities. The consistent tracking of these metrics is vital for understanding the nation’s economic health and its position within the global financial system.