Lana Rhoades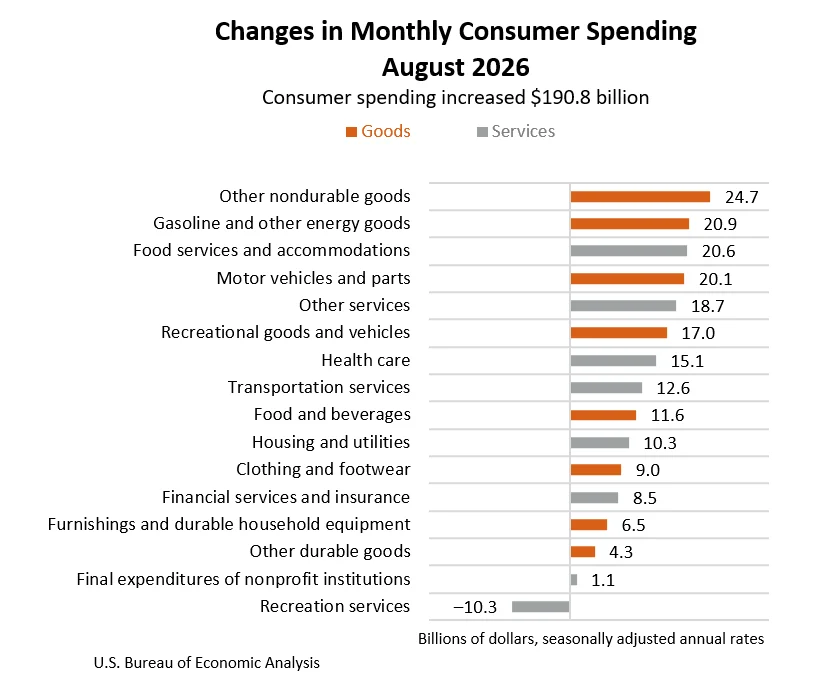
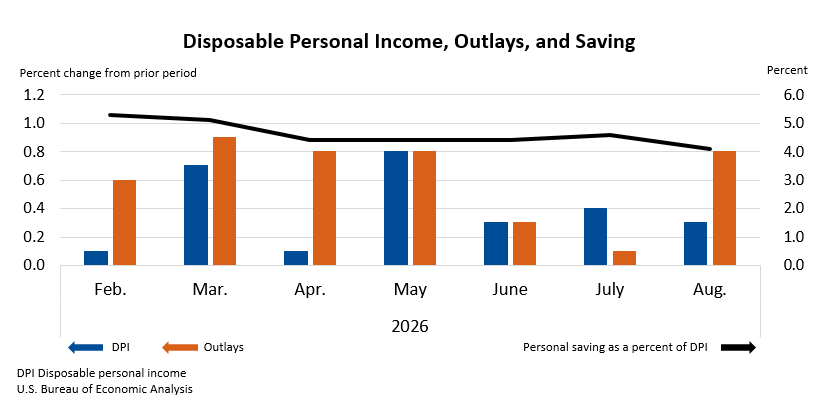
August witnessed a notable uptick in consumer activity, as personal income edged upward while personal consumption expenditures (PCE) experienced a significant surge, according to the latest data released by the U.S. Bureau of Economic Analysis (BEA). Personal income rose by $66.6 billion, marking a 0.2 percent increase at a monthly rate. This growth in income translated into higher disposable personal income (DPI), which measures personal income after taxes. DPI climbed by $68.6 billion, or 0.3 percent, providing consumers with more funds. The most pronounced movement was observed in personal consumption expenditures, which surged by $190.8 billion, a robust 0.9 percent increase.
This acceleration in consumer spending signals a dynamic economic landscape, where households are demonstrating an increased propensity to spend. The BEA’s report underscores a continued trend of economic engagement, with consumers driving demand across both goods and services. The figures provide a crucial snapshot of household financial health and spending patterns, offering insights into the broader economic trajectory.
Key Economic Indicators in August
The BEA’s comprehensive report detailed several critical economic indicators for August:
- Personal Income: Increased by $66.6 billion (0.2 percent monthly rate). This figure represents the total income received by individuals from all sources, before any deductions for taxes.
- Disposable Personal Income (DPI): Rose by $68.6 billion (0.3 percent monthly rate). DPI is a pivotal metric as it reflects the income available to households for spending or saving after accounting for personal current taxes.
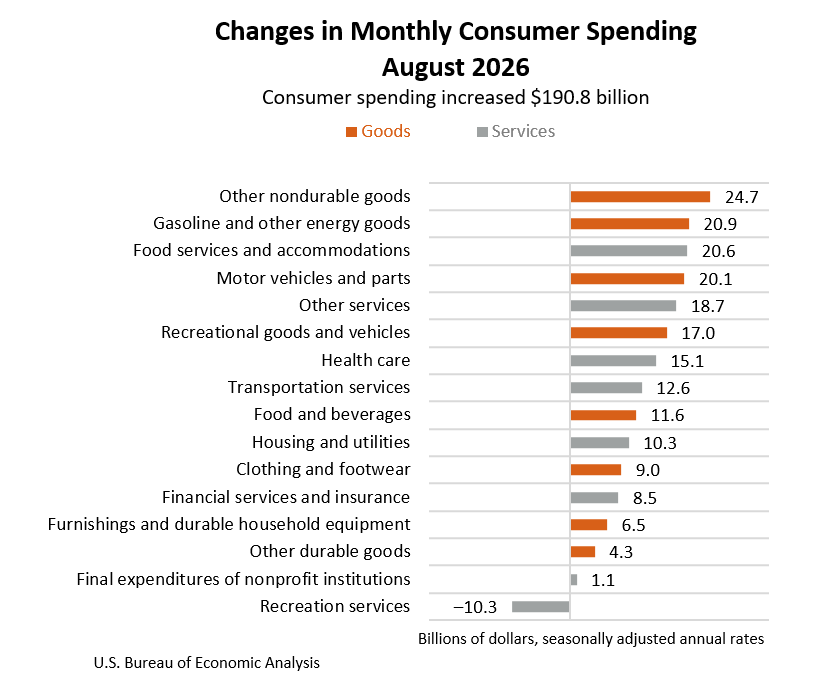
- Personal Consumption Expenditures (PCE): Saw a substantial increase of $190.8 billion (0.9 percent monthly rate). PCE is a primary measure of consumer spending on goods and services.
- Personal Outlays: Which encompass PCE, personal interest payments, and personal current transfer payments, collectively increased by $190.7 billion in August.
- Personal Saving: Stood at $990.2 billion. The personal saving rate, calculated as personal saving as a percentage of DPI, was 4.1 percent. This indicates that while spending rose significantly, a considerable portion of disposable income was still being saved.
The growth in current-dollar personal income during August was primarily attributed to increases in compensation and government social benefits. This suggests a dual engine of income generation, with both wage-based earnings and government support contributing to the overall rise.
Consumer Spending Trends
The substantial $190.8 billion increase in current-dollar PCE was a significant driver of economic activity. This expansion was broadly distributed, with spending on goods rising by $114.1 billion and spending on services increasing by $76.7 billion. This balanced growth across goods and services indicates a widespread consumer demand.
Beyond nominal values, the BEA also reported on real PCE, which adjusts for inflation. Real PCE increased by $92.8 billion, or 0.6 percent at a monthly rate. This signifies that consumer purchasing power also grew, not solely due to higher prices but also due to an actual increase in the volume of goods and services consumed.
Inflationary Pressures and Consumer Price Index
While consumer spending demonstrated strength, the report also provided insights into inflationary trends. The PCE price index, a key inflation gauge, increased by 0.3 percent in August from the preceding month. This figure is closely watched by policymakers as it reflects the cost of goods and services purchased by consumers.
Furthermore, when excluding the more volatile categories of food and energy, the core PCE price index (often referred to as core inflation) rose by 0.2 percent in August. This measure is particularly important as it offers a clearer view of underlying inflationary pressures in the economy, free from temporary price shocks.
Year-over-year, the PCE price index for August showed a 3.4 percent increase compared to the same month in the previous year. The core PCE price index also saw a year-over-year increase of 3.0 percent. These figures provide a longer-term perspective on inflation and highlight the ongoing efforts by central banks to manage price stability.
Analysis of August’s Economic Performance
The August data presents a nuanced picture of the U.S. economy. The robust growth in personal consumption expenditures, especially in real terms, suggests that consumers remain a significant engine of economic expansion. This surge in spending could be influenced by several factors, including accumulated savings from previous periods, increased wage growth, or a general sense of economic confidence.
The modest increase in personal income, driven by compensation and social benefits, provides the financial foundation for this increased spending. The fact that disposable personal income also grew indicates that households had more discretionary funds available.
However, the continued rise in the PCE price index, particularly the core measure, signals that inflationary pressures persist. While the rate of increase in core inflation has shown some moderation compared to previous periods, it remains a key concern for economic policymakers. The BEA’s data on the personal saving rate at 4.1 percent suggests a delicate balance between spending and saving. A declining saving rate could indicate that households are drawing down on reserves to maintain their spending levels, which might not be sustainable in the long term. Conversely, a stable or slightly increasing saving rate, as seen here, can provide a buffer against economic downturns.
Historical Context and Revisions
The BEA’s monthly release of Personal Income and Outlays is a critical component of national economic accounting. These estimates are subject to revisions as more comprehensive data becomes available. For instance, the August report included revisions to compensation data for earlier months of the year, incorporating updated wage and salary information from the Bureau of Labor Statistics (BLS). These revisions are essential for ensuring the accuracy and reliability of economic indicators.
Specifically, the January through March 2026 compensation estimates were revised due to the incorporation of first-quarter wage and salary data from the BLS Quarterly Census of Employment and Wages program. Additionally, estimates for wages and salaries for April through July 2026 were updated to reflect revised monthly data from the BLS Current Employment Statistics (CES) program. Updates to Medicaid benefits were also incorporated based on new information from the Centers for Medicare & Medicaid Services. Such revisions underscore the dynamic nature of economic data collection and analysis.
Implications for Policymakers and Consumers
The August data has significant implications for both economic policymakers and individual consumers. For the Federal Reserve, the combination of strong consumer spending and persistent inflation will likely inform their monetary policy decisions. The central bank aims to strike a balance between fostering economic growth and controlling inflation. The current data suggests that while growth is robust, the inflation picture requires careful monitoring.
For consumers, the increase in disposable income is welcome news, allowing for greater purchasing power. However, the ongoing rise in prices means that the real value of their income gains is somewhat diminished. Consumers may need to continue making strategic decisions about their spending and saving habits to navigate the current economic environment. The trend in personal saving rate will be particularly important to watch in future reports.
Broader Economic Outlook
The August performance provides a snapshot of the economy’s momentum heading into the latter part of the year. The strength in consumer spending is a positive indicator for economic growth, as consumer spending constitutes a significant portion of the U.S. Gross Domestic Product (GDP). The continued increase in compensation and government social benefits also points to a supportive income environment.
However, the persistent inflationary pressures, even after excluding food and energy, remain a challenge. The BEA’s PCE price index is a key metric for understanding the cost pressures faced by households and businesses. The year-over-year increases, while moderating from their peaks, still indicate a higher cost of living compared to a year ago.
The BEA’s report also highlights the interconnectedness of various economic components. For instance, the increase in personal income directly influences disposable income, which in turn fuels personal consumption expenditures. The relationship between spending, saving, and inflation is a continuous feedback loop that shapes the overall economic trajectory.
Future Economic Indicators
The BEA will release the Personal Income and Outlays report for September 2026 on October 29, 2026, at 8:30 a.m. EDT. This upcoming release will provide further insights into the continuation of these trends and any shifts in consumer behavior and economic conditions. Analysts will be closely observing whether the robust consumer spending continues and how inflationary pressures evolve. The interplay between income growth, spending patterns, and price stability will remain central to understanding the U.S. economic outlook in the coming months.
The BEA’s commitment to providing detailed and timely economic data, coupled with its transparent revision process, is crucial for informed economic analysis and decision-making. The August report serves as a vital data point, illustrating the ongoing economic dynamics within the United States.